


Asset Class Returns - 10/31/2026
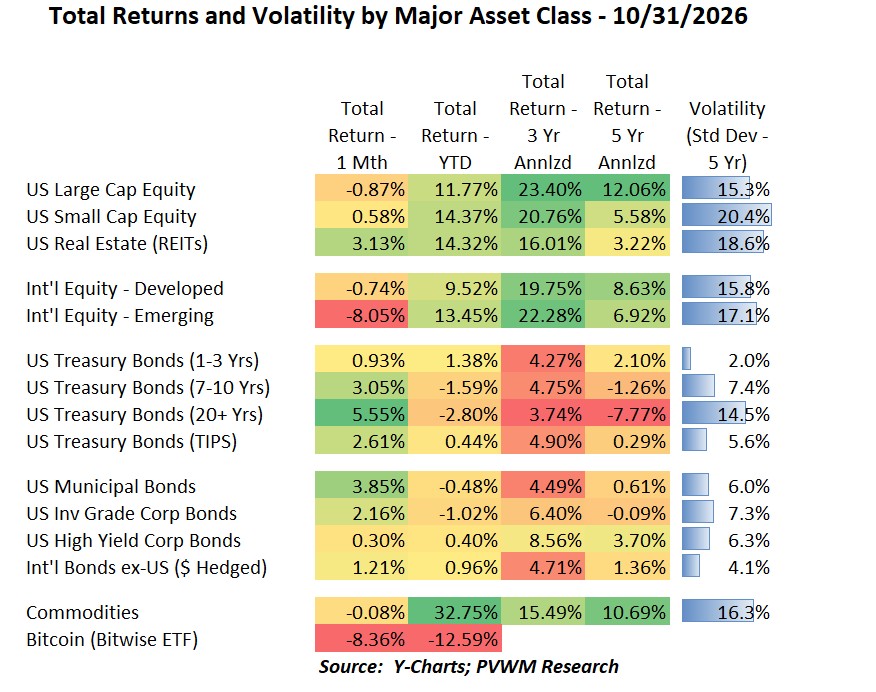
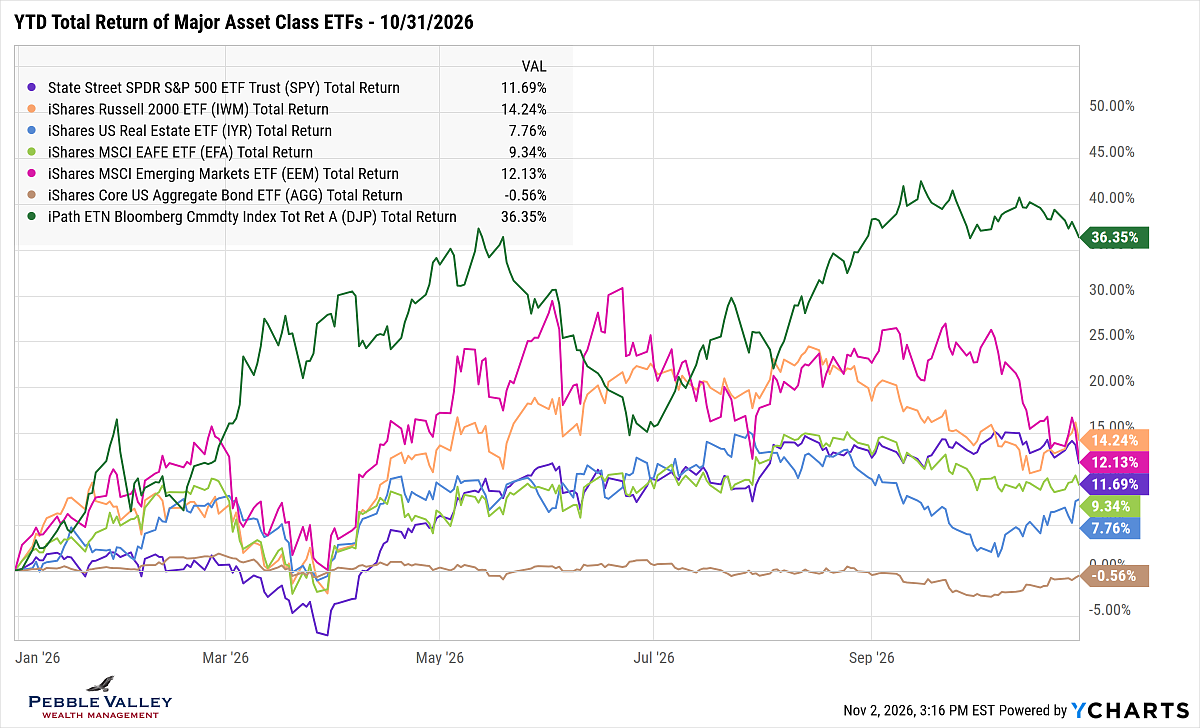
As I was preparing this month’s blog post I was expecting to write about negative returns for the month – at least that’s what it felt like. However, monthly returns for most asset classes were positive, despite the weak end to October. There was plenty of dispersion within asset classes however. Credit risk-free bonds (Treasuries) had a very solid month of returns as rates fell more than -0.32% (32 basis points). Credit spreads widened however as the bond market begins choking on the large supply of tech company issuance, leaving corporate bonds with lower but still positive returns. US Small Caps and REITs also liked the lower rate environment. Looking at the table above and YTD major asset class ETFs graph below, here are some additional observations.
US Large Caps were down -0.9% for October, though returns within the sector ranged from +14% for Energy to -15% for Communication Services (75+% is Alphabet/Google, Meta/FB)
Small Caps were up slightly at +0.6%, reacting favorably mid-month to falling interest rates; other than Commodities, Small Caps have highest YTD return at +14.7%
REITs were also loving the lower interest rates, reversing most of last month’s damage with a +3.1% rally for October and +14.3% YTD
Developed markets were down -0.7%, in line with US Large Caps
Emerging markets got clocked, down -8.1% as AI sell-off hit the two largest countries in index – Taiwan and South Korea; Brazil politics resulted in large sell-off (4% of index)
Bond markets’ returns this month present some interesting lessons:
Rates fell -0.32% (32bp) giving nice gains for Treasuries – longer the better (DURATION!)
Inv Grade bonds were up over +2%, but less than Treasuries (SPREAD WIDENING +14bp)
High Yield bonds squeaked out a small +0.3% gain (RISKIER SPREADS WIDER +44bp)
Commodities were flat, with the strong Energy returns offset by the other commodity sub-sectors including Precious Metals; the YTD return of +32.8% rises above the pack!
Bitcoin was drifting lower for the month, but then got hit hard on a $6.3BB hack of a non-US, non-regulated exchange (Binance); final damage was down -8.4% on the month.
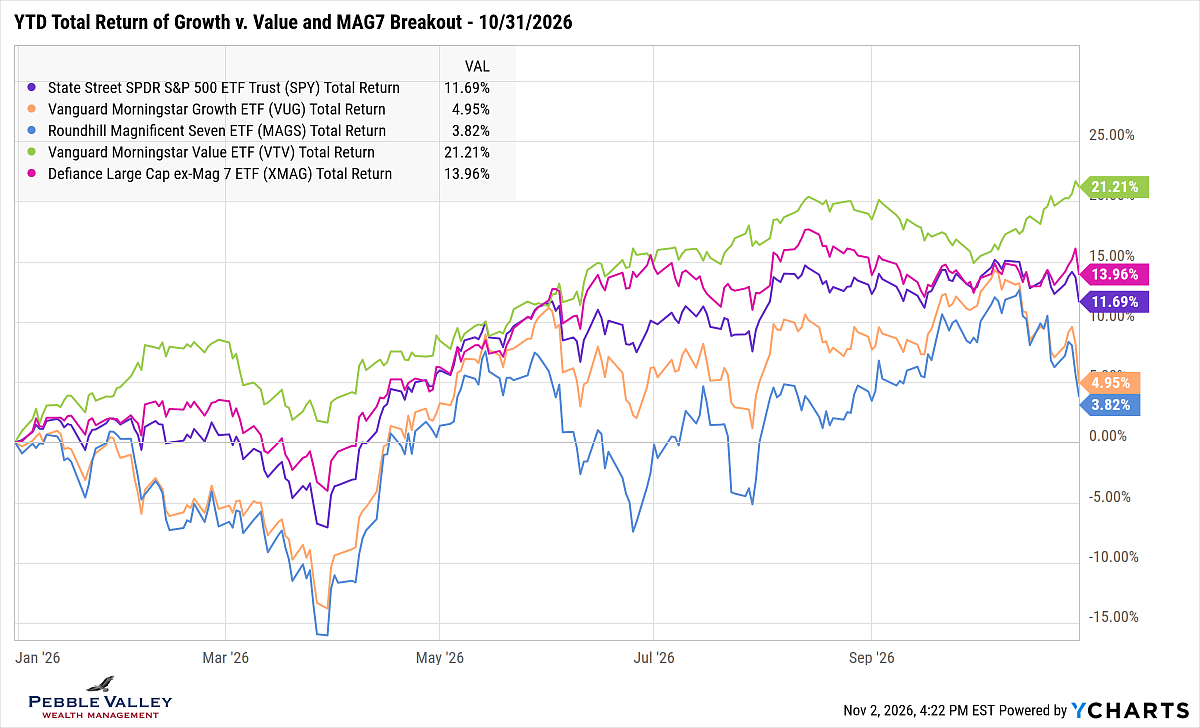
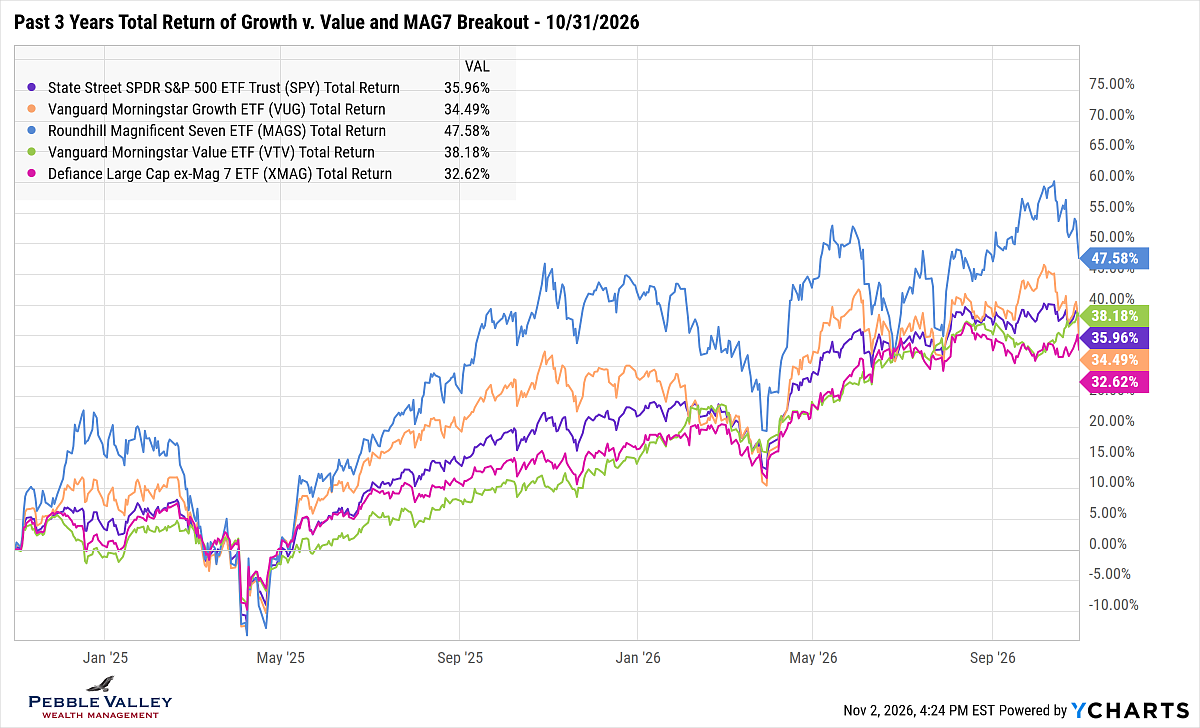
The extra graph this month shows Growth vs. Value again with the added twist of adding MAG 7 (AAPL, MSFT, GOOG/L, AMZN, NVDA, META, TSLA) and “Other 493”. In years past the MAG 7 didn’t track Growth as closely as this year. The Vanguard Value ETF (VTV) has been outperforming Growth all year and is now approaching the +15% outperformance seen at the end of March after the first month of the Iran war. The top 10 holdings in VTV has the usual suspects – JPM, BRK-B, XOM – but also two tech names - MU and CSCO (under 6% combined). The first graph shows YTD to see the relatively tight tracking of MAG 7 to Growth. I then show the past three years to acknowledge the MAG 7 has outperformed – provided you held on during larger pullbacks. Visually the bigger swings imply a higher market Beta – for a given 1% move in the S&P 500 how much does that ETF move – both up and down. The 1 Yr Beta based on Morningstar is VUG=1.4; VTV=.05; MAGS=1.2; XMAG=0.8.
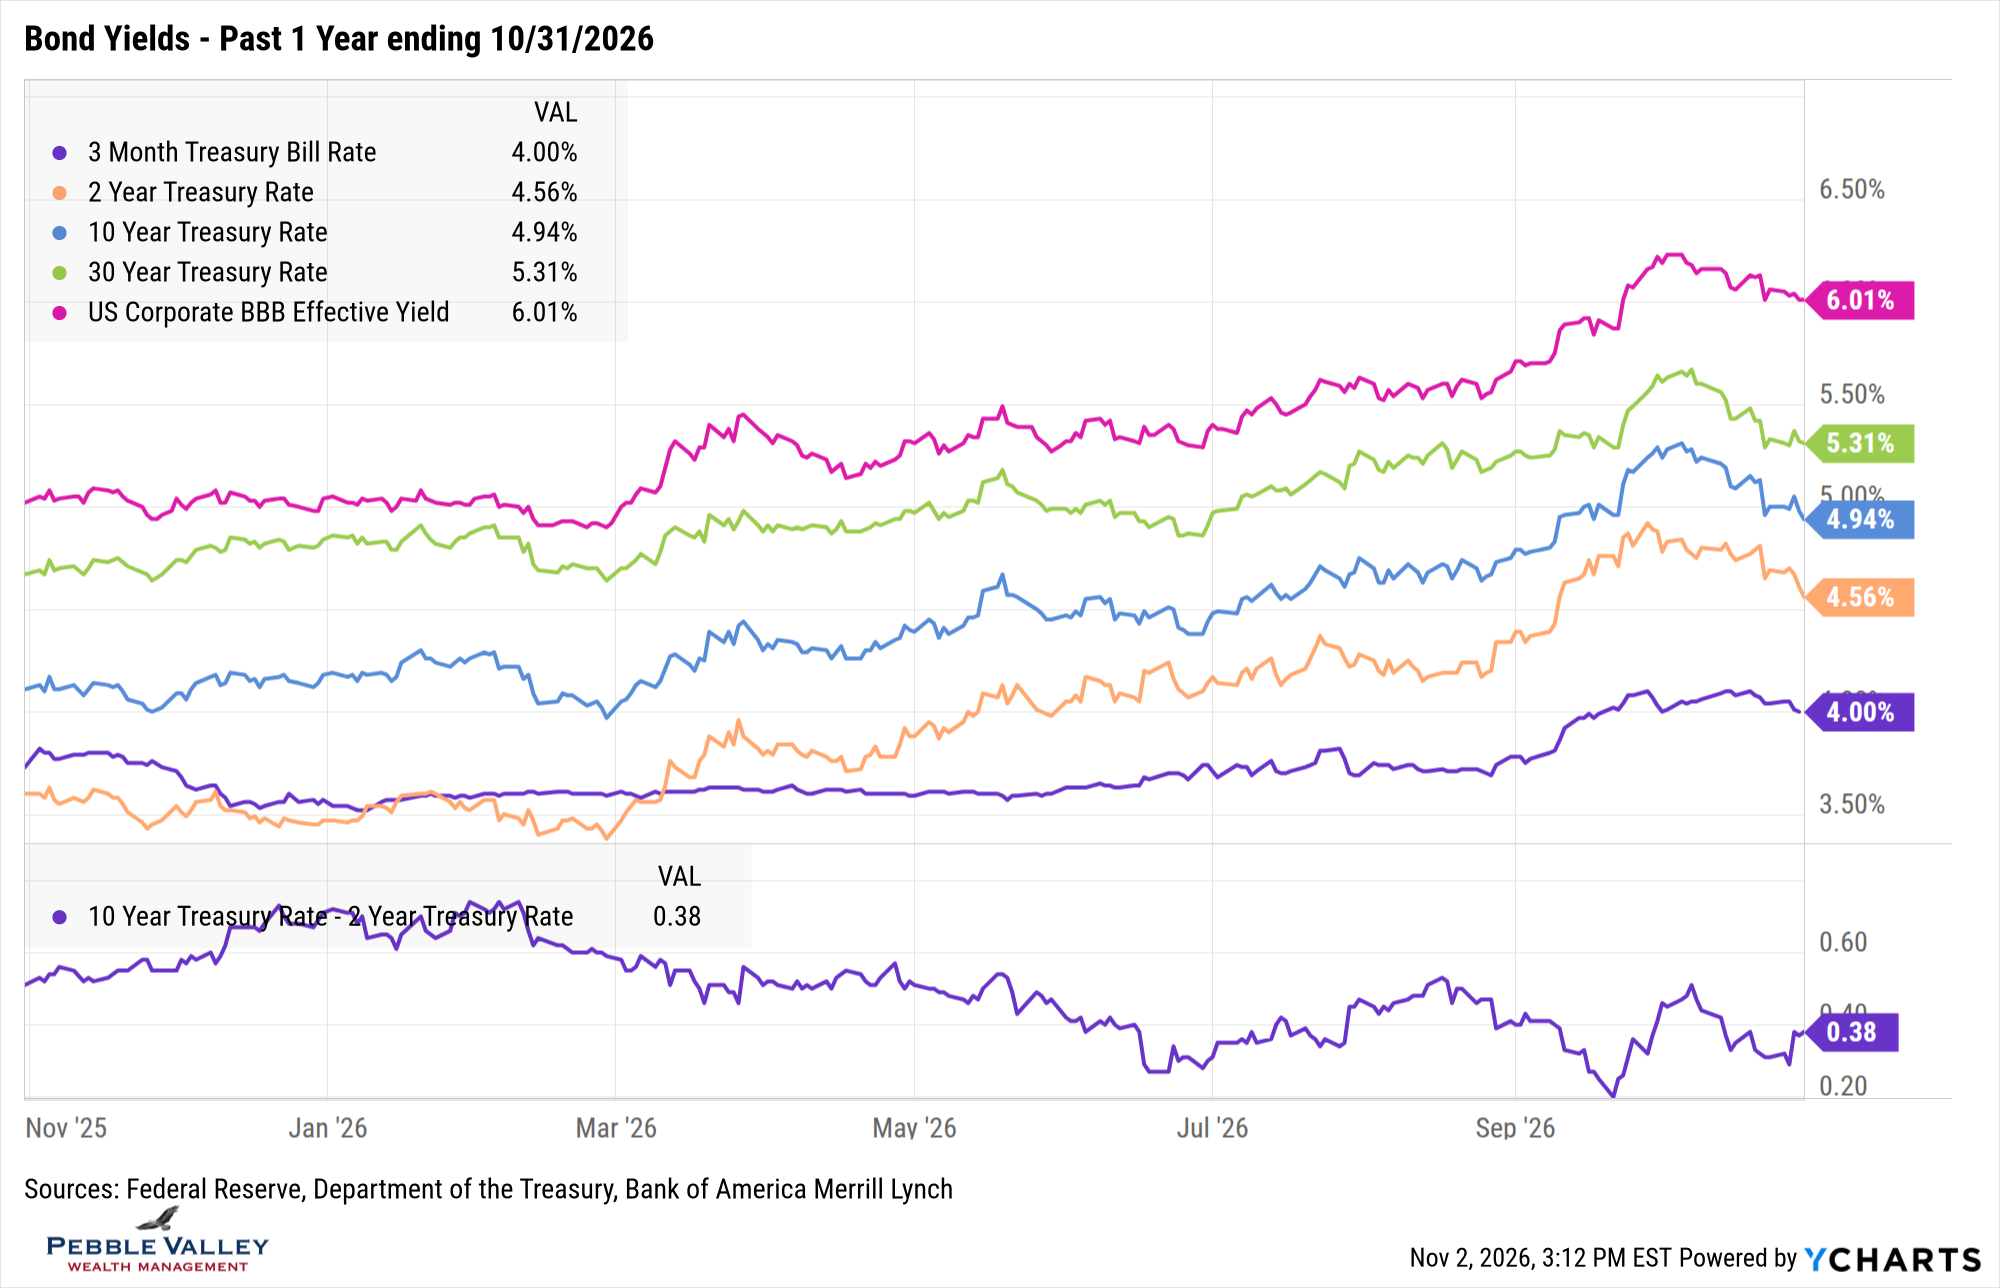
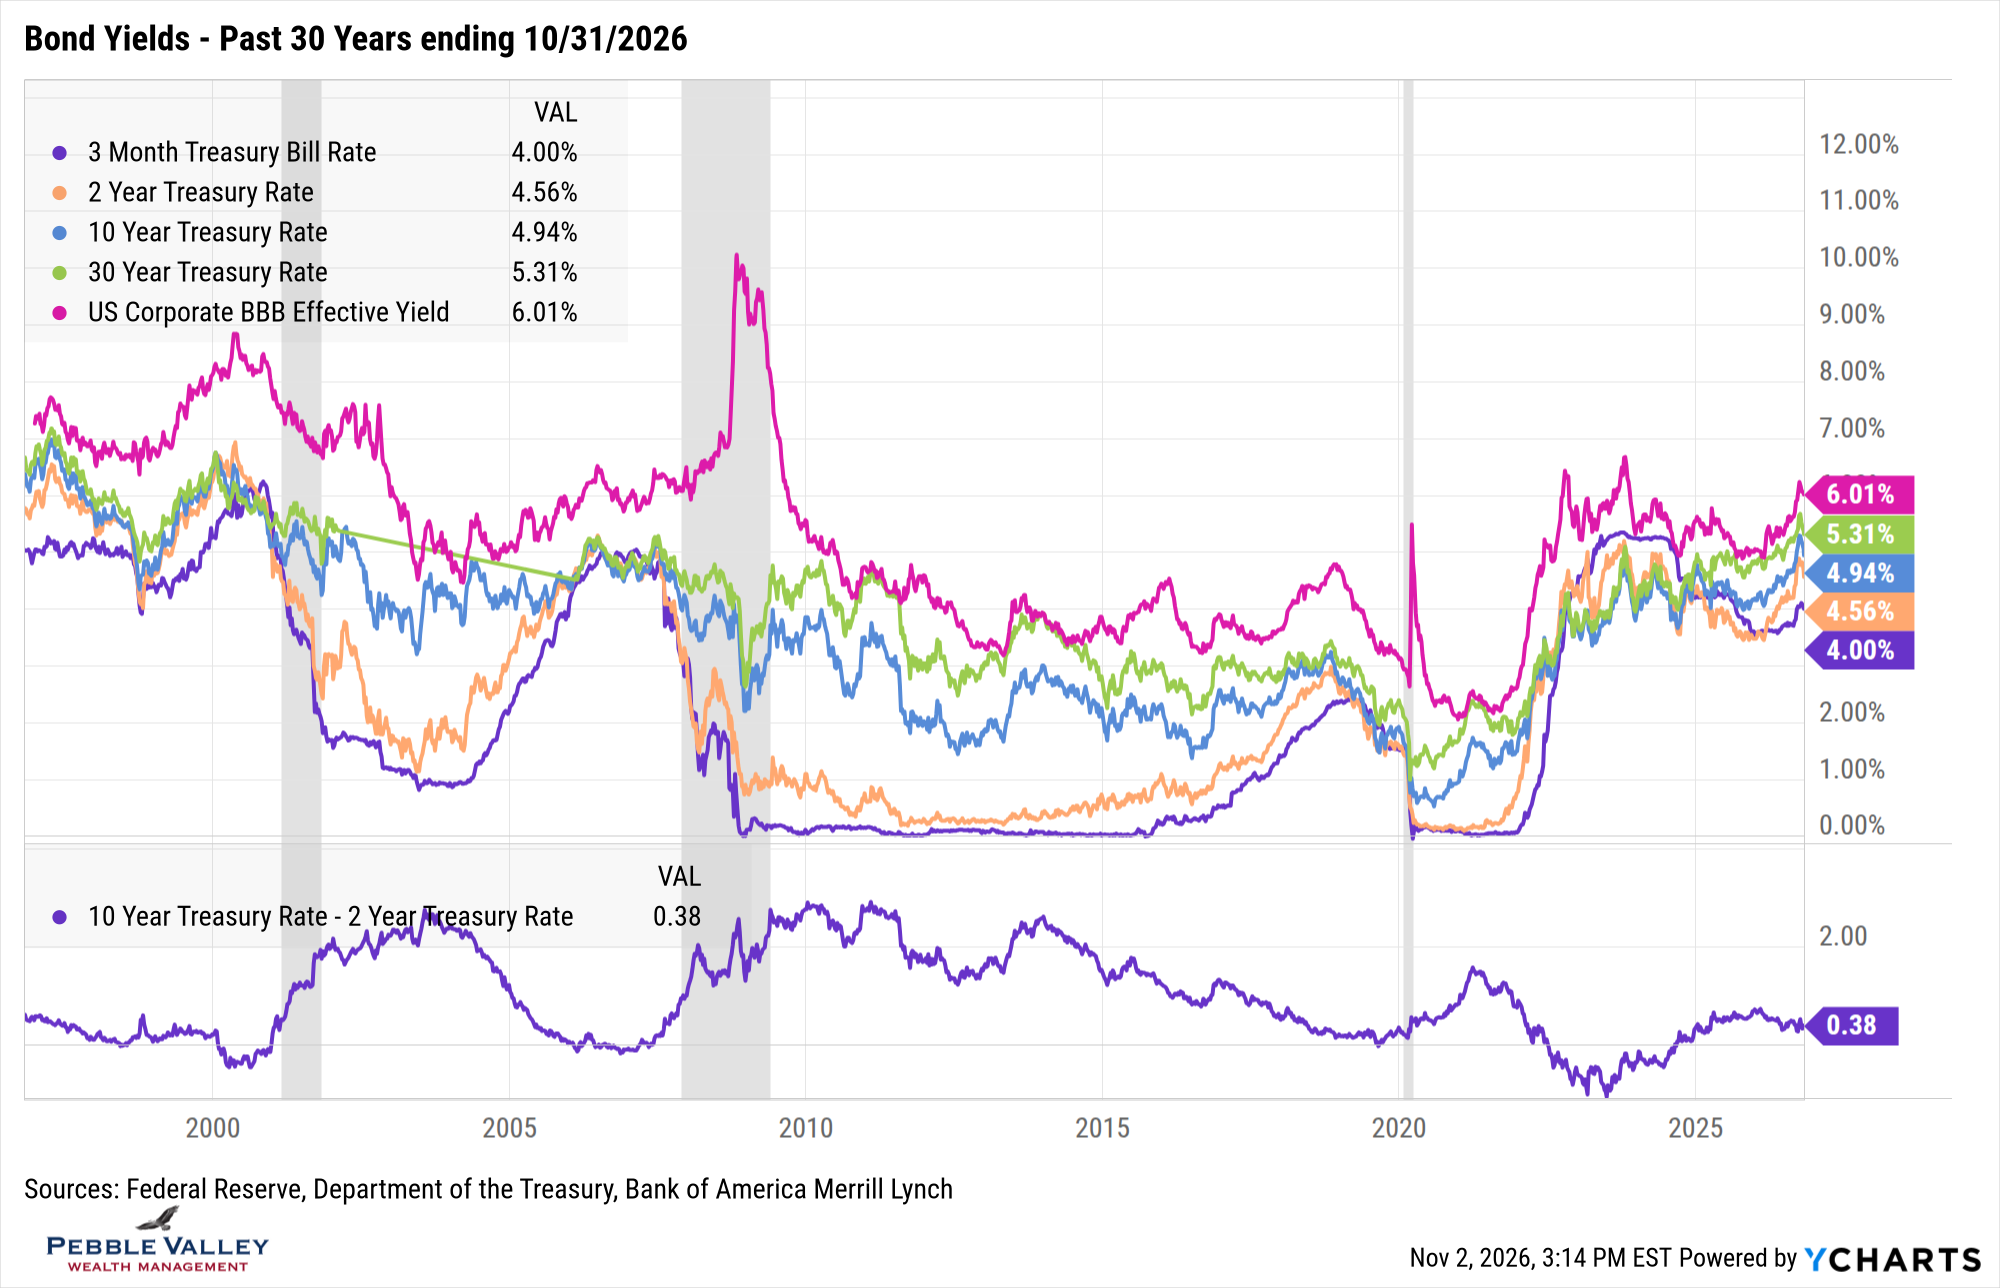
Next are the bond yield graphs over the past one- and thirty-year time frames. Looking at the 1-year chart, you can see some of the rate rise in September reversed in October, but not in the same magnitude for all. The 30-year rate gave up most while TBills and Corporate BBB-Rated didn’t drop nearly as much (BBB spreads widened about 15 basis points). The 2-yr and 10-yr didn’t go all the way back to early September levels but did drop 32 and 35 basis points respectively in October. It remains to be seen if the late September rate move higher was technically driven (large supply of bonds hitting market) or if we return there as the demand for more debt from both governments and corporate issuers continues while the investors reassess creditworthiness and exposure to a given sector. The 2-year rate is driven by Fed rate expectations. The market has two more rate hikes priced in. If the AI build-out slows due to markets choking on capital demands, perhaps further hikes won’t be needed.
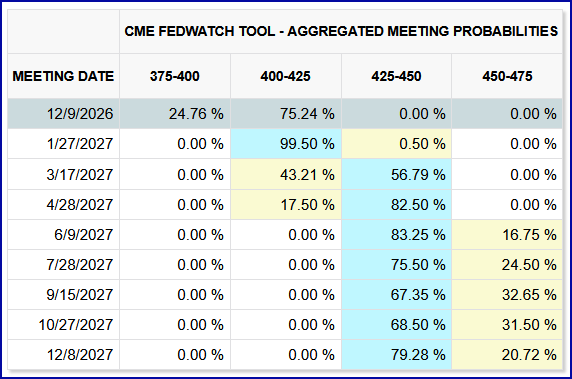
The Fed held rates steady at the last FOMC meeting on October 28. The current rate is 3.75% - 4.00%. The FOMC statement’s last paragraph concluded with the same first and last sentences but modified the middle. “Inflation remains elevated. The accumulation of more information will help the Committee determine the policy stance appropriate to ensure a timely return of inflation to the Committee’s 2 percent goal. The Committee will deliver price stability.” There were two dissenters who wanted to hike. The press conference gave a sneak preview to some meeting changes in 2027 and recapped what the FOMC has done so far. Chair Warsh continues to not provide forward guidance though said the Fed could during stressful times. One question raised was if the current Fed Funds rate was the right one. Warsh said it needs to be determined, but only after a pause which I viewed as his bias to not raising rates. The Fed Funds futures market definitely is biased to higher rates with at least two more rate hikes by next June (Source: CME FedWatch, Nov 2, end of day). I believe that is overdone.
I have three special topics this month.
I Bond rate reset
The Treasury set the latest I Bond fixed rate at 1.4% for new I Bond deposits made between Nov 1, 2026 to April 30, 2027. That fixed rate remains for the full 30-year life of the I Bond. Every six-months the actual inflation component (as measured by CPI-U) is added on top of the 1.4%. The annualized rate for the current period is 5.51% - but focus on the high fixed! I Bonds have not seen a fixed rate this high since 2007, though it did have a 1.3% fixed rate from Nov 2023 – Oct 2024. Many I Bond holders likely have a 0.0% fixed rate which was the case for new I Bond deposits made from May 2020 – Oct 2022 when demand rose with high inflation. Investors with those I Bonds have a 4.08% rate rather than current 5.51% this cycle due to different fixed rate. Here is a link for those wanting to see how the rate is calculated.
Recall you can only deposit $10,000 per calendar year for each SS # (spouse needs to open own account). I view I Bonds as a very attractive reserve fund paying a high fixed rate PLUS actual inflation. However, you can’t touch the funds for the first twelve months so be sure to have access to other funds initially. Withdrawals over the next four years lose the last three months’ interest. Using both calendar years, you can get $20,000 locked in at this 1.4% fixed rate. If you feel already have enough in I Bonds, consider cashing out a low fixed rate I Bond (be aware of lost three months interest and taxes) and lock in this higher rate.
2027 Social Security Inflation Adjustment
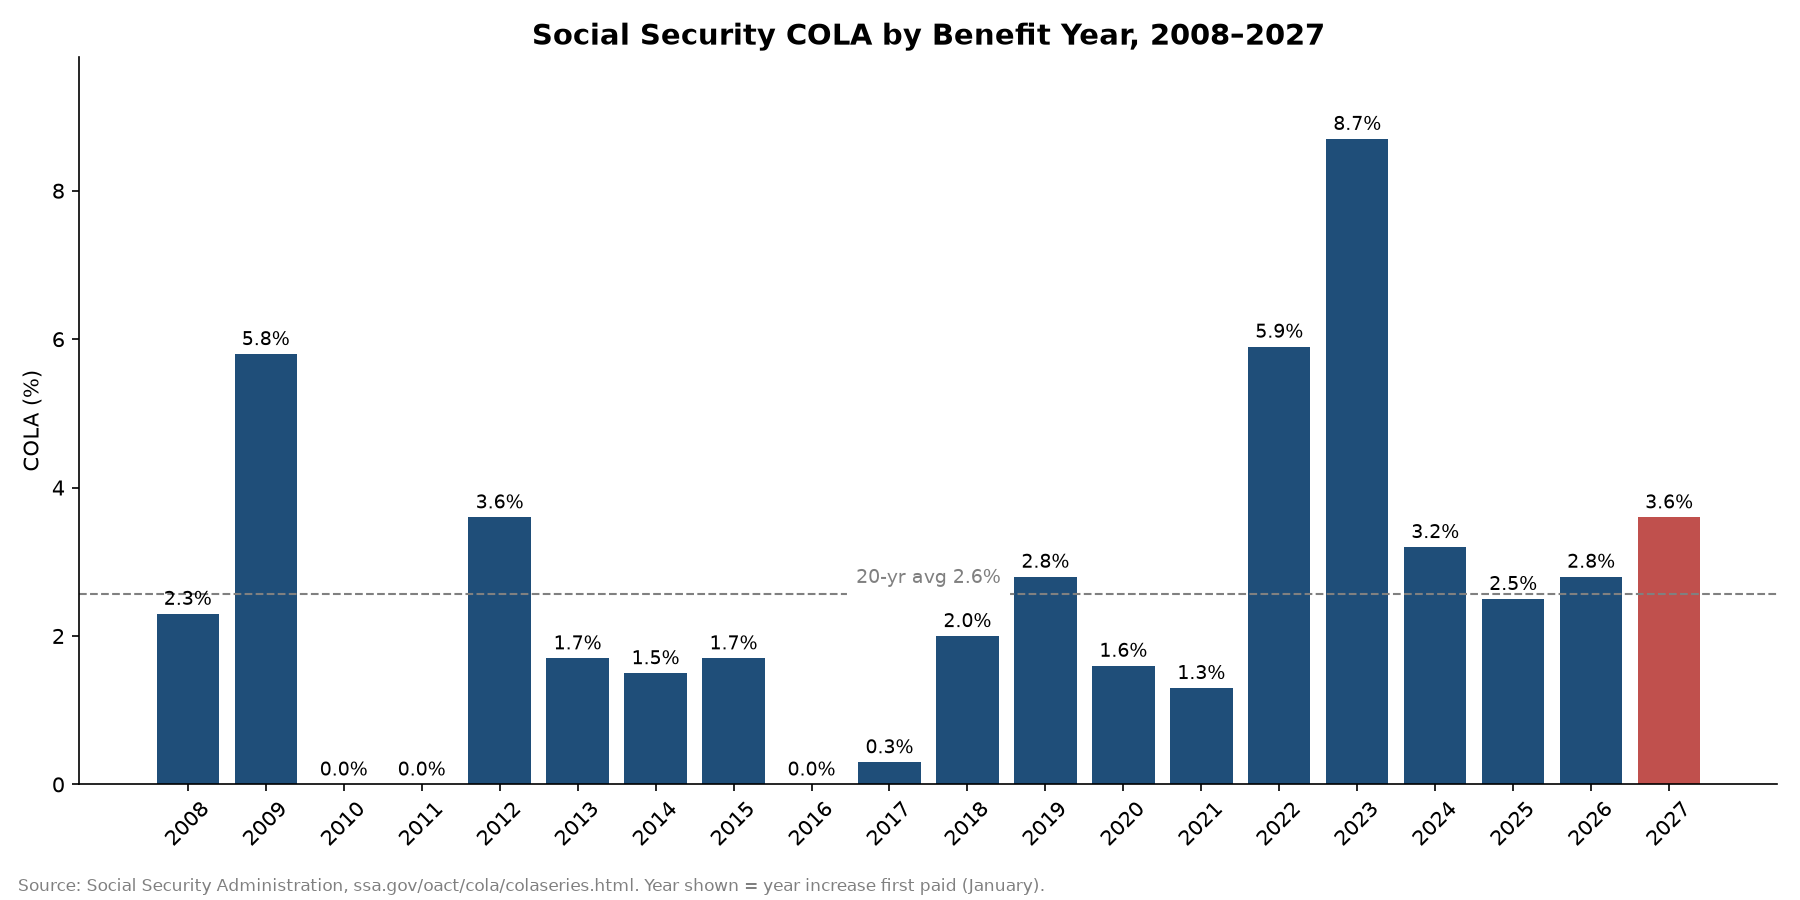
With the release of September CPI data (and CPI-W) on 10/14, the 2027 Social Security inflation adjustment was finalized. SS benefits will rise by 3.6% for 2027. Medicare premiums for 2027 have not been announced yet by the CMS but is expected in the next couple weeks. The graph below shows how the current COLA adjustment compares to the past 20 years. There were three years where the inflation index was down, resulting in no COLA.
Trading Compute and Other AI Action
While keeping up with the latest developments in the capital requirements for AI and any signals from the market, I came across this article in the WSJ which mentioned a developing market in “trading compute” by Jump Trading. The contract is linked to the hourly rental rates of a high-end Nvidia B300 chip and is viewed as a potential hedge for an AI infrastructure developer who may rent out chips. A put option on these contracts would protect against falling chip rental prices if demand drops. I am not making a direct link at all, but this reminded me of the “bandwidth trading” that Enron developed in early 2000 as that market was heating up along with the extensive use of off-balance sheet debt structures. Demand for AI is high and like bandwidth, will continue to grow. But the size and complexity of financing that demand, and the interconnectedness of various companies with contingent financing bears watching. And a reminder to how far the “AI Trade” can reach many companies including Utilities (huge power demand) and Industrials (building data centers) this headline from Bloomberg caught my attention – “Caterpillar Shares Slump as AI Trade Faces New Reality Check”.
The clocks have changed. The early morning walkers are happy for the extra sunlight but the after-work bike riders have been deflated.
Have questions? Reach out! We're happy to help.
Posted by Kirk, a fee-only financial advisor who looks at your complete financial picture through the lens of a multi-disciplined, credentialed professional. www.pvwealthmgt.com