


Asset Class Returns - 9/30/2026
tetet
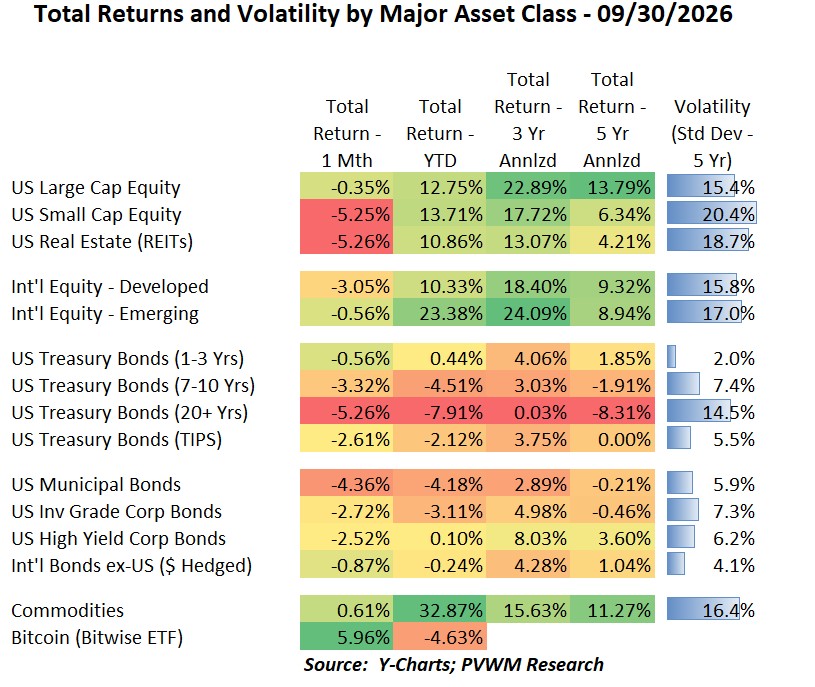
Negative returns were back in September. While equities saw their share of red, the bond market was also down substantially in price; yields were up. Historically rate-sensitive REITs – though in recent past not as much – finally felt the heat of higher rates and were down -5.3%. Looking at the table above and YTD major asset class ETFs graph below, here are some additional observations.
US Small Caps underperformed Large Caps substantially, as higher borrowing costs typically hit smaller companies harder
International equities were also down, with Developed markets underperforming Emerging due to a stronger dollar - returns less when convert to US since takes more to buy $1
Emerging markets had a very solid YTD return, helped by Technology in South Korea and Taiwan
Bond duration math was on full display as rates rose by a similar +0.55% across the curve but total returns were much lower for longer maturity bonds
Damn, that 5-year annualized long bond return continues to jump out at me
Muni and corporate bond indices are mostly following the returns relative to the duration of their respective markets; High Yield has shorter duration so much of that negative return was from spread widening
Commodities were relatively flat but that YTD return – and even the 3- and 5-year to the right – is quite impressive; diversification can be boring but comes in handy
Bitcoin had another solid month, bringing YTD returns close to break-even; CLARITY Act did not pass the Senate; for now crypto will rely on less permanent rules from the SEC and CFTC.
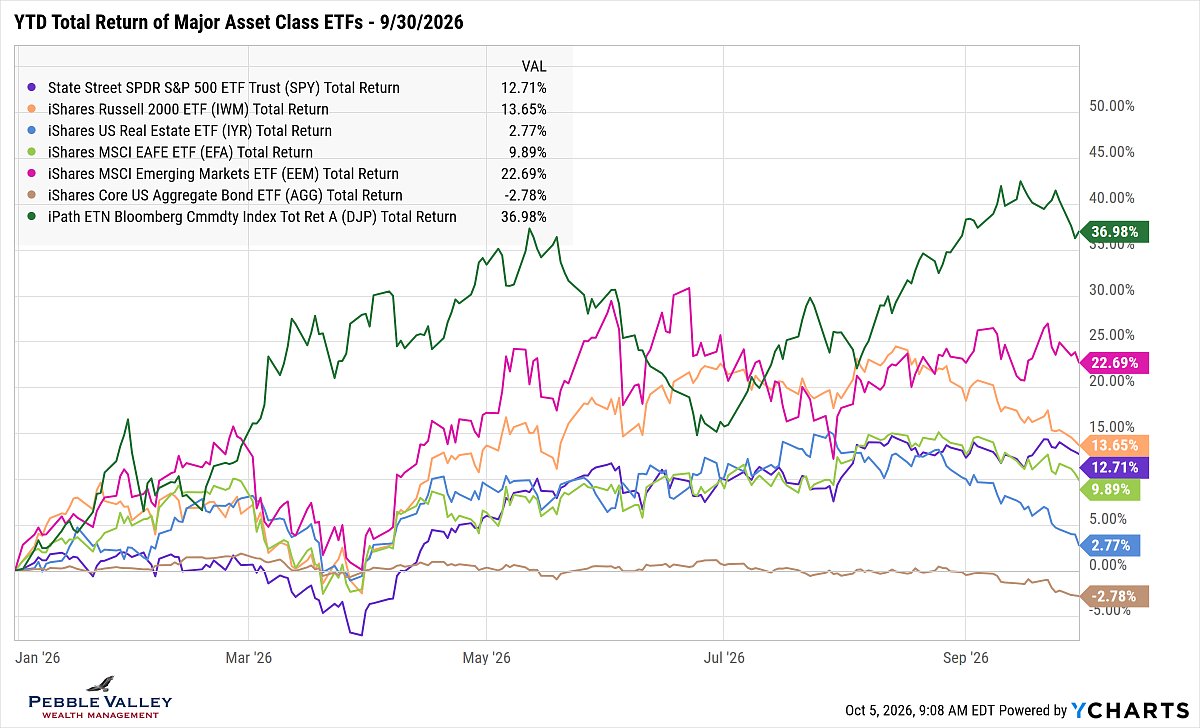
The graph below shows the drift lower in September returns but note S&P500 and Emerging Markets are relative flat; the Treasury-heavy US Aggregate Bond returns are down close to -3%
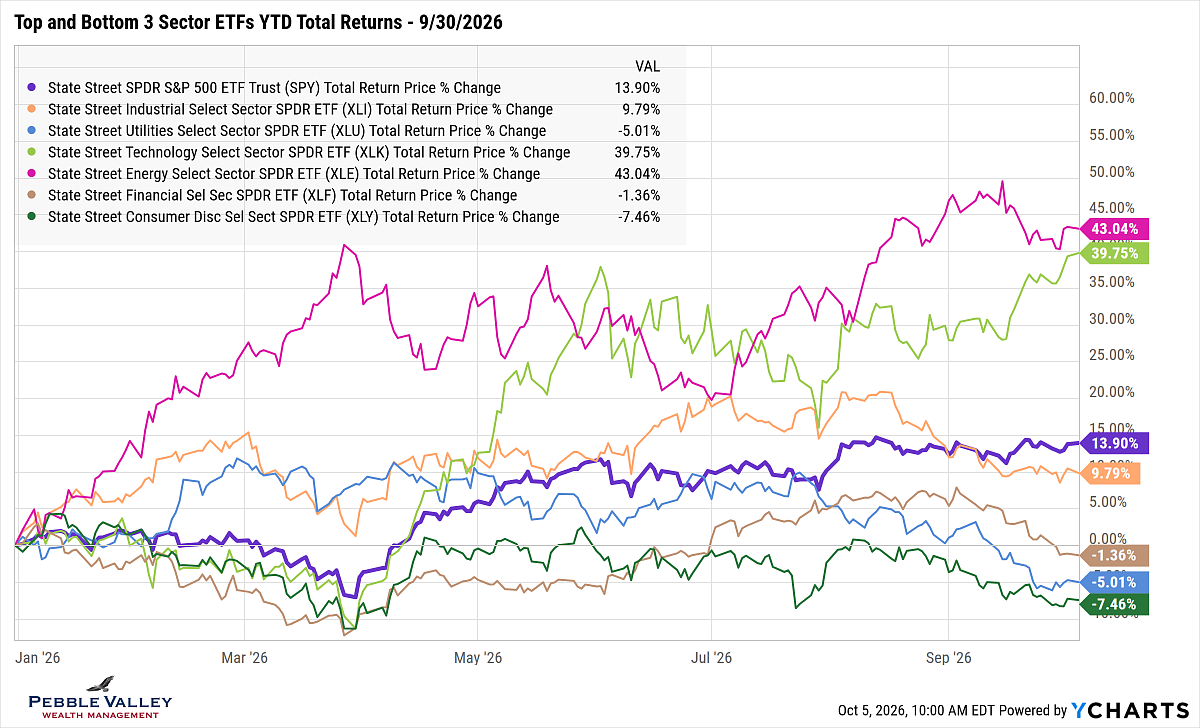
The extra graph this month shows the top and bottom three sector returns on YTD basis, along with the S&P 500. You may have been surprised to see the S&P 500 relatively flat for the month when market news felt so negative. The answer is the Technology sector – not only due to strong monthly returns but also the fact that the Technology sector makes up about 40% of the S&P500 index. Yes, Energy was also up strongly, but it only has a 3.4% weight to the S&P 500 index. On the negative side, rate sensitive Utilities were in the down pack. Financials started the downward trend on the back of rising short-term rates.
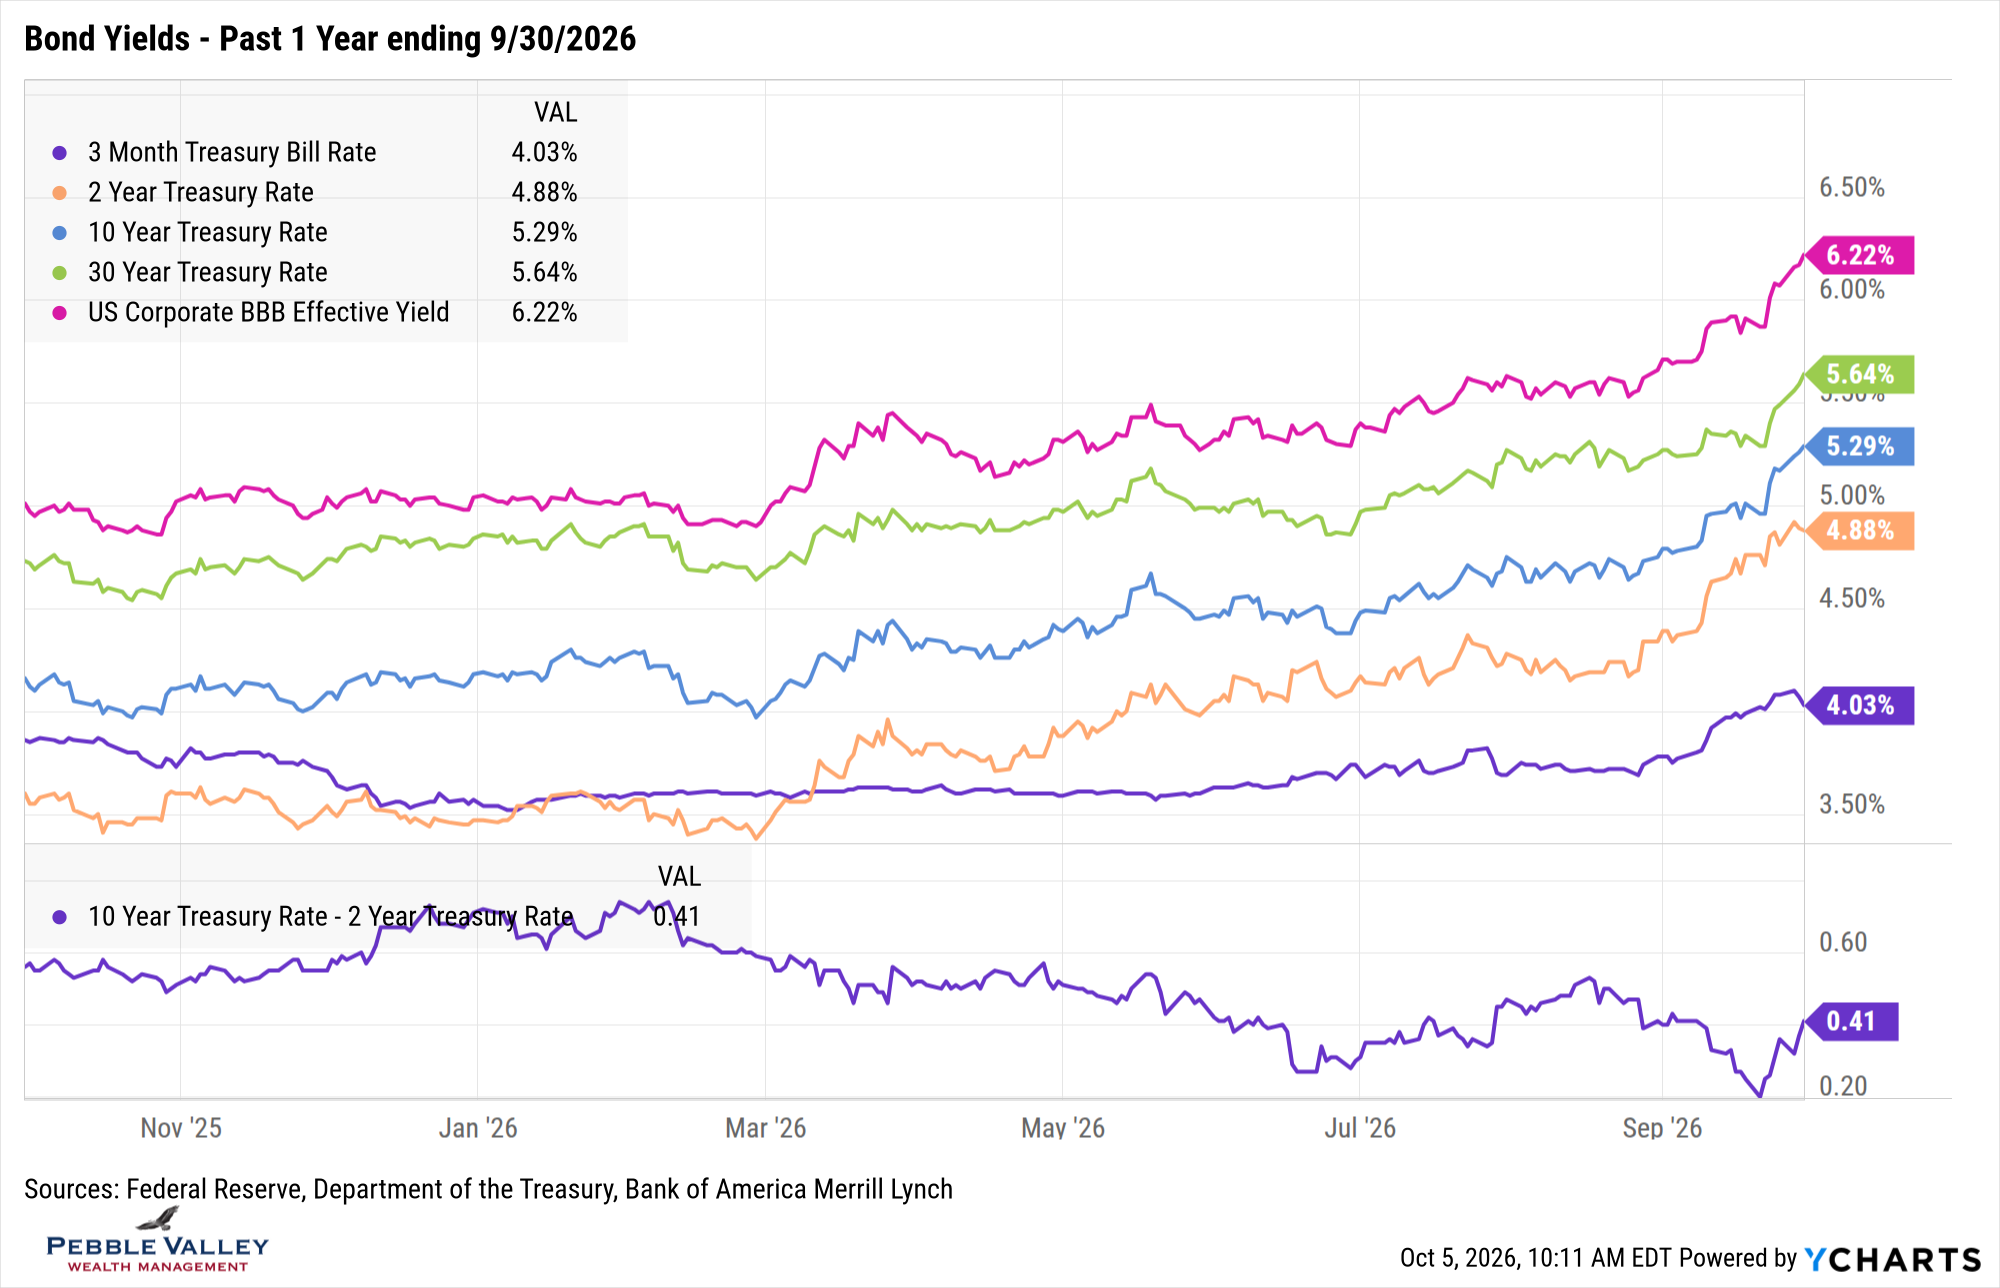
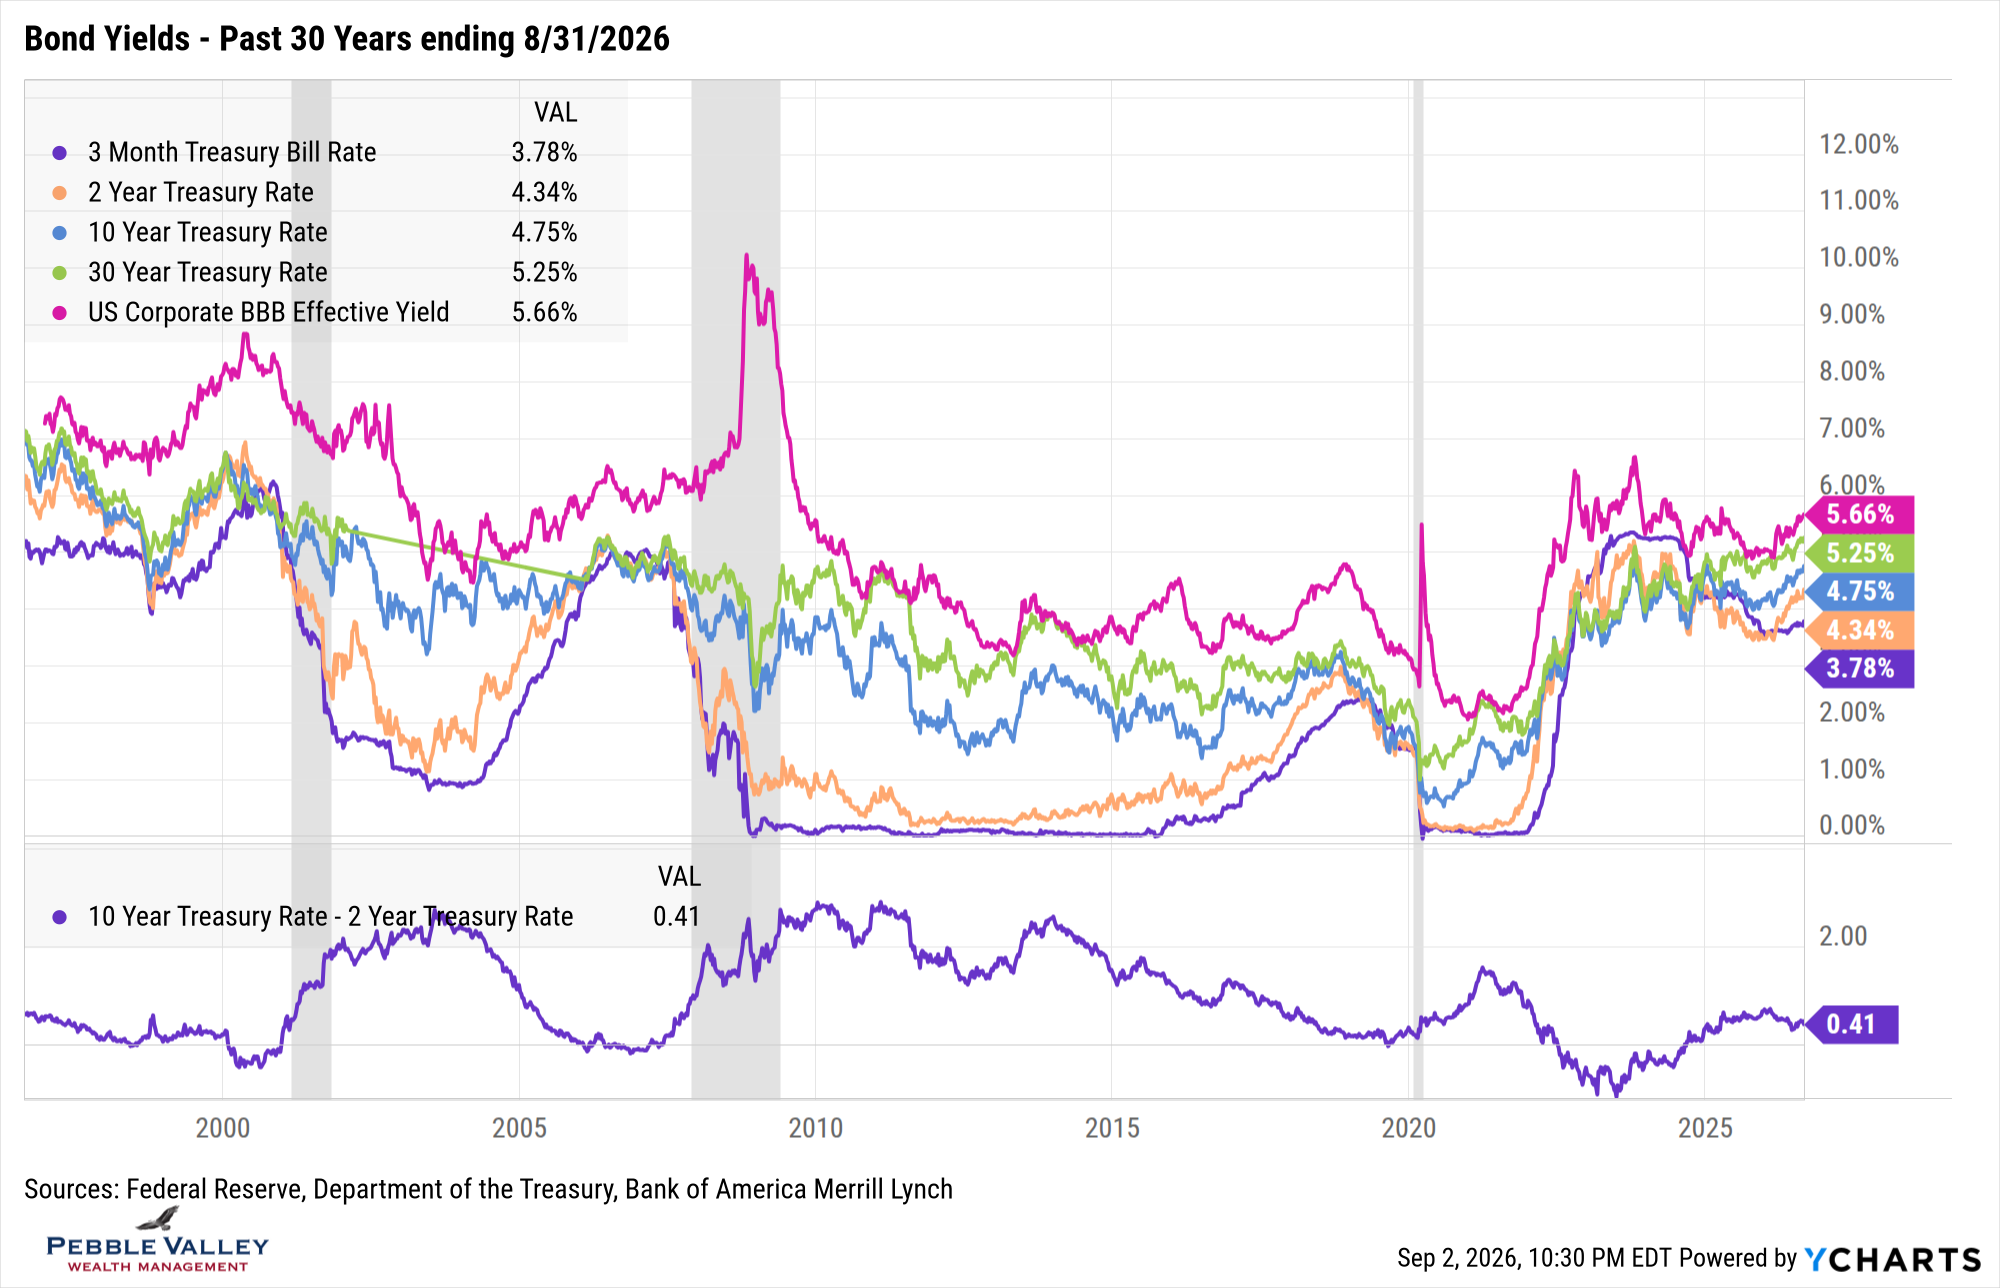
Next are the bond yield graphs over the past one- and thirty-year time frame. Looking at the 1-year chart, you can see the big move in rates this past month. Recall the bottom portion of the graph shows the 2s/10s spread. The change for the month was relatively muted but mid-month got quite flat as the 10-year kept marching while the 2-year cooled as the market backed off on expected rate hikes. The all-in BBB-Rated yield (magenta line) is now approaching 6.25% - not from extra credit spread (still remains tight at about 1.0%) but the underlying treasury yield. The 30-year time frame shows current levels getting back to pre-financial crisis levels. That is prior to 2008 for the younger readers!
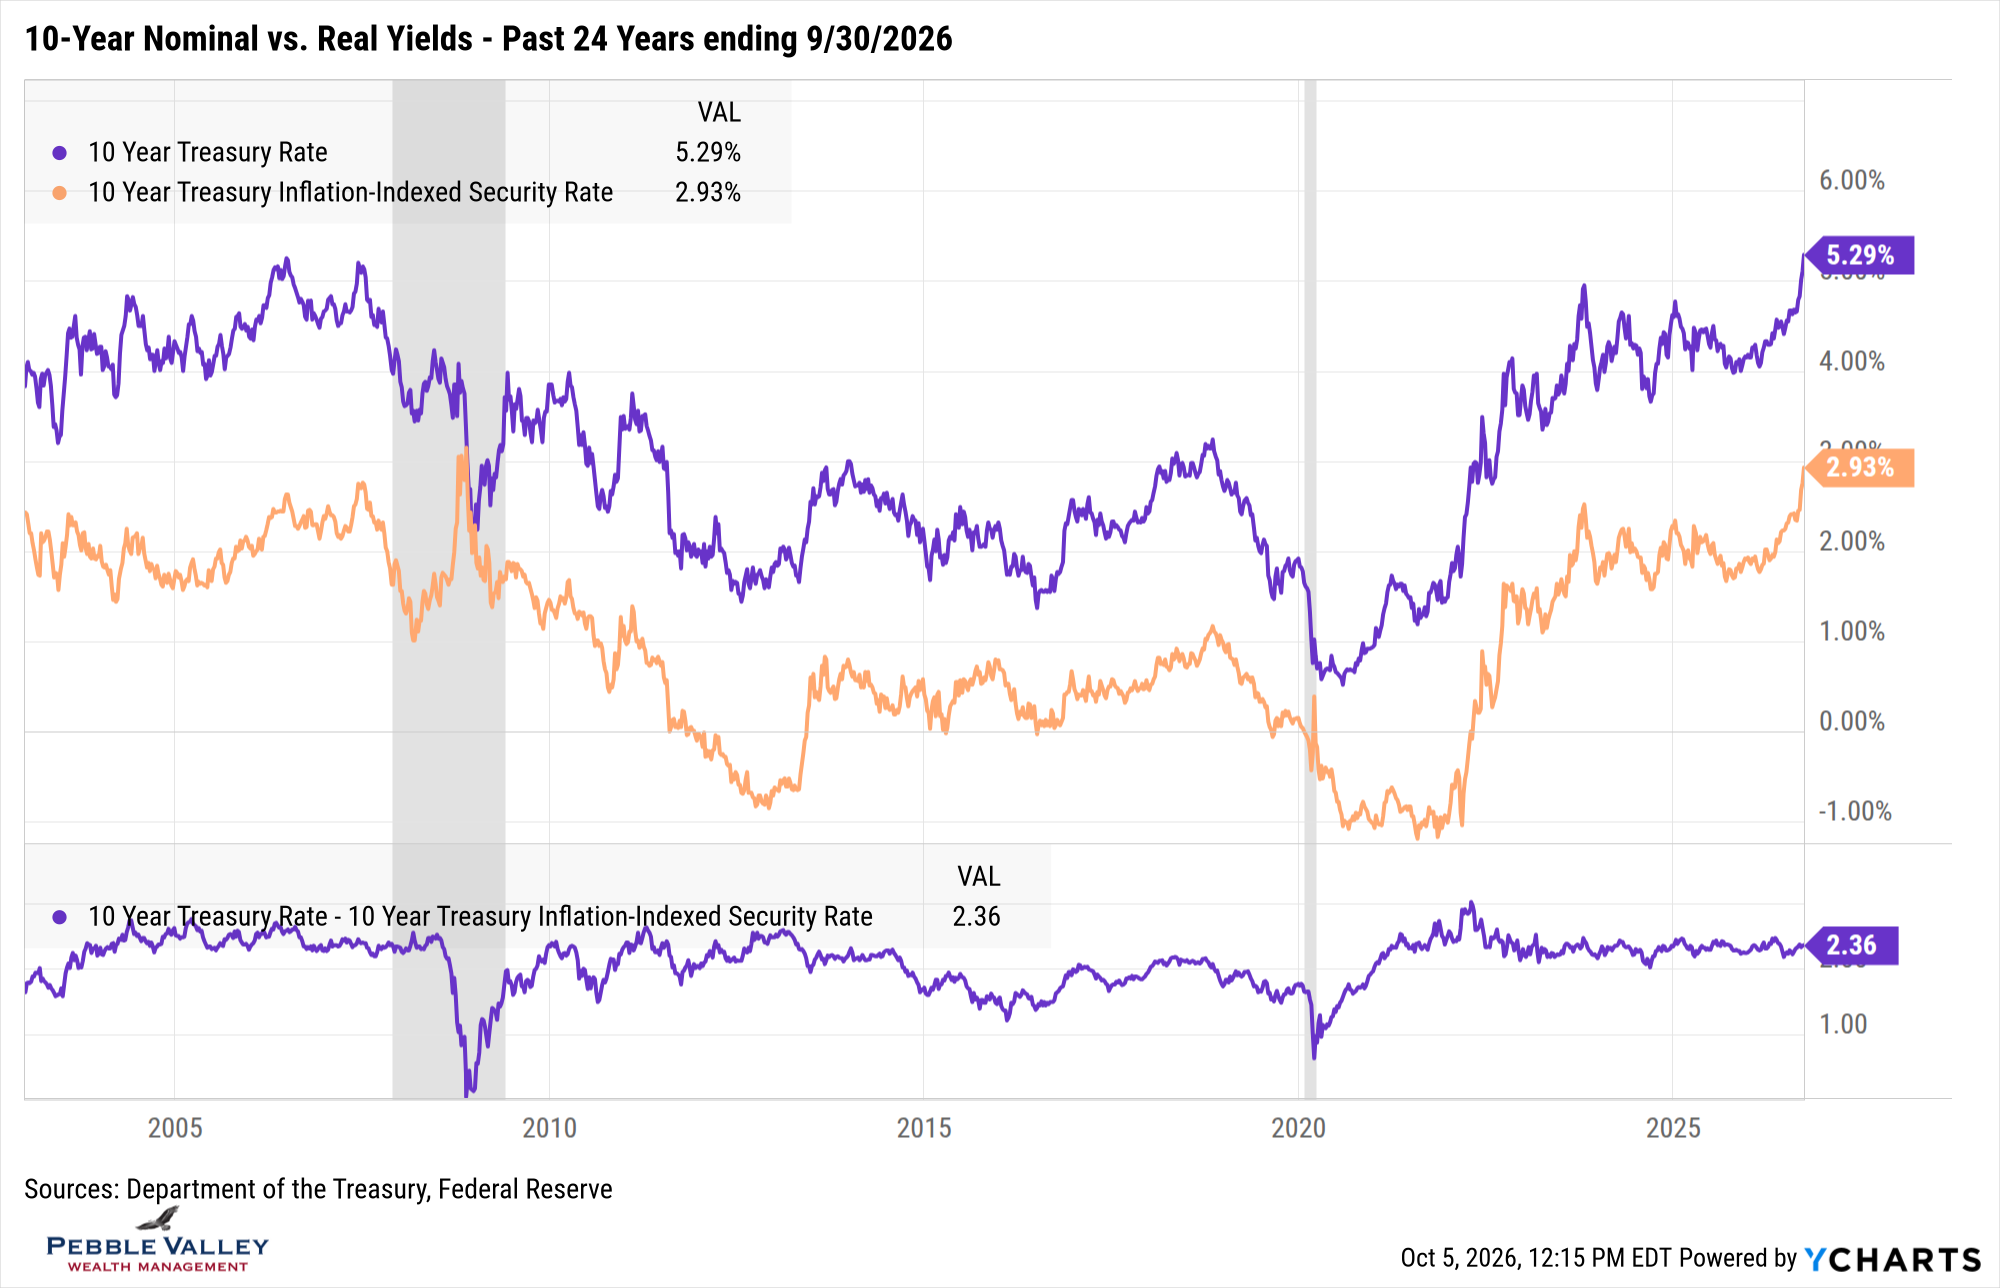
I am including an extra chart showing real yields which I haven’t included for a while. Recall a regular treasury bond’s yield is also called a nominal yield, while Treasury Inflation Protected Securities (TIPS) is called a real yield. A TIPS actual return is from both the fixed real yield plus actual inflation which is captured by increases to the par amount of the bond. The difference between the nominal and real yield is referred to as “breakeven inflation rate”. If actual inflation runs higher than breakeven over the maturity of the bond, an investor is better off buying TIPS over regular treasuries and vice versa. The graph below shows these values for the 10-year maturities. Note how the real yield has also been rising along with nominal, leaving the “breakeven inflation rate” relatively flat. The move higher in rates is driven by many things, including expected inflation, but the recent increase is driven more by underlying economic growth rather than higher expected inflation. Here is a link to last month’s market update where I show a long-term graph of nominal GDP growth vs. the 10-year nominal yield.
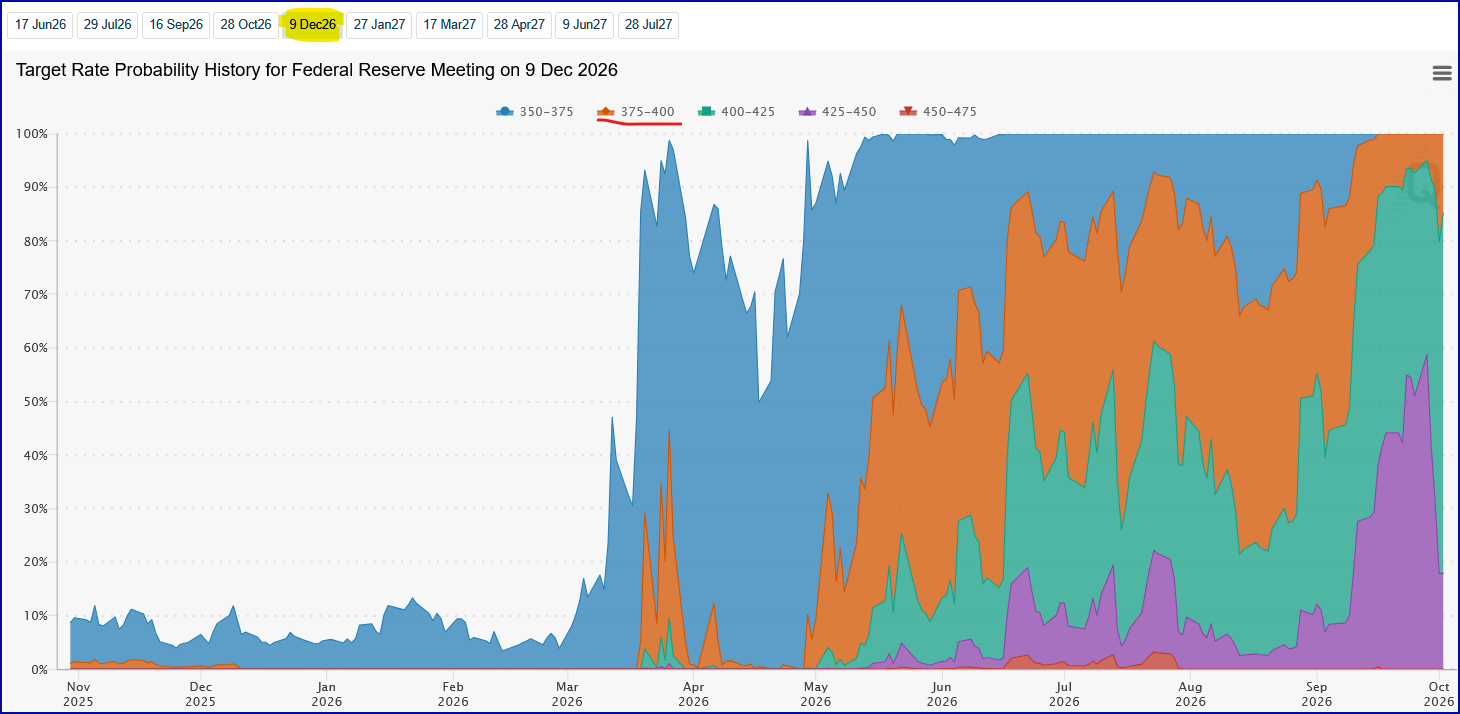
The Fed raised rates at the last FOMC meeting on September 16 by a quarter-point, up to 3.75% - 4.00% level. The FOMC meeting statement concluded with “Inflation remains elevated. Today’s policy action will support a timelier return to the Committee’s 2 percent goal. The Committee will deliver price stability.” Here is a link to the Summary of Economic Projections which included stronger economic projections but also higher inflation. As a result, higher Fed Funds rates were also projected. Chair Warsh did not add his views. One of the Fed task forces will opine on whether this Summary is continued into 2027. The Fed Funds futures market was beginning to price in two more rates hikes before the end of the year but has since backed off to a 67% chance of only one more rate hike (Source: CME FedWatch, Oct 5 am).
I have two special topics this month – both related to inflation.
I Bond rate reset
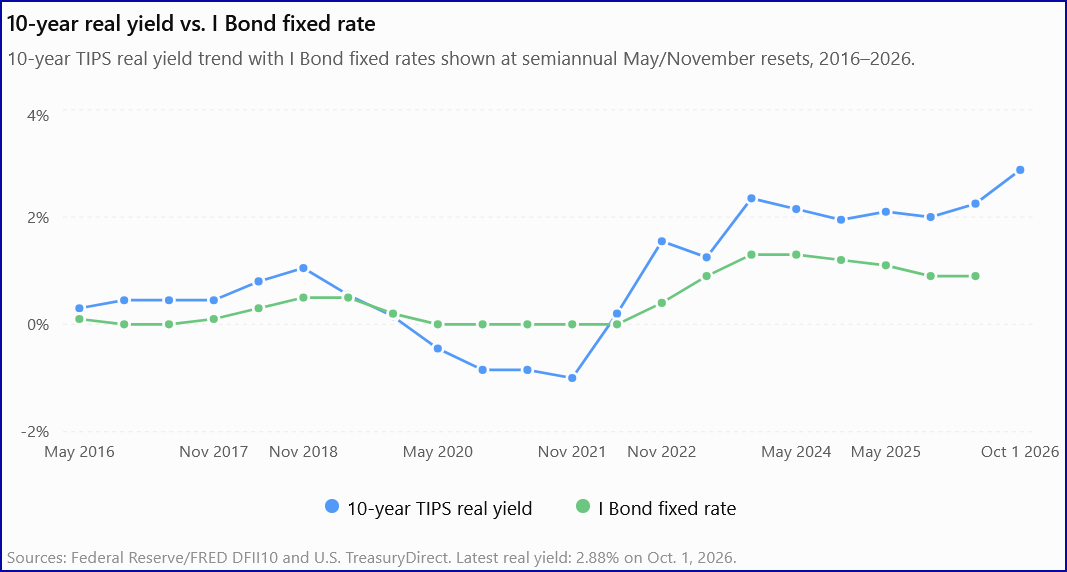
I Bonds from treasurydirect.gov became very popular in May 2022 when the annualized semi-annual rate setting came in at 9.62%. Many people deposited the maximum $10,000/year to capture this high rate. Ironically, the fixed rate component of that particular I Bond (and a few rate settings around that time) was set to 0.0%, locked in for the life of the bond. A quick glance at the real yield graph above shows low and even below 0.0% real rate which drove this. The last rate reset – which occurs every May and November 1 - had a fixed rate of 0.90%. This is a very attractive fixed rate PLUS actual inflation on top. Treasury has discretion in setting the fixed rate, but given the increase in real yields, I expect the fixed rate to be noticeably higher at this November’s reset. The graph below shows the 10-year real yield (blue line) vs. the I Bond fixed rate components over the past ten years. I recommend you get $20,000 ready if you can – and use up your ’26 maximum in November and the ’27 maximum in January. If you have an old 0.0% fixed rate I Bond, call us for the “repurpose strategy”. As long as you have access to other funds for twelve months, this vehicle can serve as a great reserve fund.
Preliminary estimate of 2027 Social Security Inflation Adjustment
With the upcoming release of September CPI on 10/14, the 2027 Social Security inflation adjustment can be calculated (see the end of this past blog post for how determined). Because two of the three inflation readings for the calculation are known, an estimate can be provided. Thanks to my intern Maura for pulling the historic data and setting up the spreadsheet, I was able to update the estimate with the August CPI-W reading. I expect the 2027 SS COLA to be in the 3.30 – 3.50% range. Tune in on Wednesday, October 14th for the official reading.
As I type this on October 5th , we have the office windows open on a sunny day. Go get some of that!
Have questions? Reach out! We're happy to help.
Posted by Kirk, a fee-only financial advisor who looks at your complete financial picture through the lens of a multi-disciplined, credentialed professional. www.pvwealthmgt.com