

Asset Class Returns - 3/31/2026
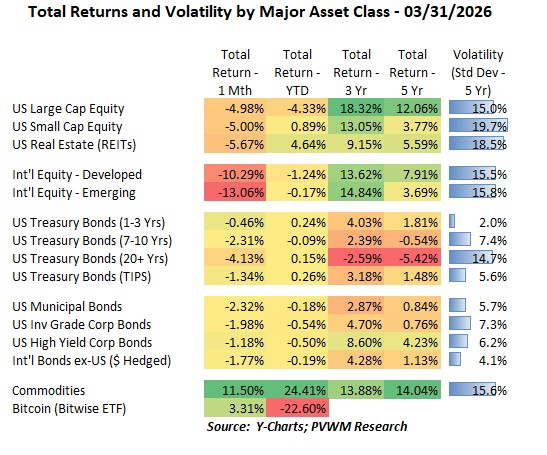
The typical monthly summary of “equities mostly higher, international outperforming, yields lower and credit spreads tighter” ended abruptly in March with the war in Iran. There were two asset classes that were higher for the month – Commodities (not surprising given oil) and Bitcoin (surprising given the general risk-off mood in markets).
Looking at the table above, you will see something we haven’t seen in a while – all negatives except for Commodities and Bitcoin. Even Treasury bonds, which typically would see gains on a “flight to safety” trade were negative as inflation concerns of higher energy prices outweighed the credit risk-free nature of Treasuries. The biggest red in the table is coming from international equities – which has enjoyed the highest gains over the past fifteen months or so. These markets are more vulnerable to higher energy prices and a pullback due to the strengthening dollar. A quick aside on US $ impacts - investments in foreign markets must be converted back to US dollars to show returns. If foreign markets don’t move but US $ strengthened, it will take more foreign dollars to generate same US $ so the return must be negative if the dollar is stronger. Here are a few things to highlight for the month.
- US Large and Small Caps were down about -5.0% but Small Caps held on to + YTD returns
- US REITs were also down by similar amounts though the strong February left them +4.6% YTD
- Int’l equities got clocked and both Developed and Emerging turned negative YTD despite the very strong start to the year
- There was nowhere to hide in bonds either, despite the typical flight-to-safety in Treasuries
- As a public service reminder, the longer the bond maturity the more you lose when rates rise
- Commodities are on fire, with Energy picking up where Precious Metals left off; Gold also did not receive the flight-to-safety bid after having a monster run higher in ‘25 and early ‘26
- Wait a minute… Bitcoin is up? What the hell?
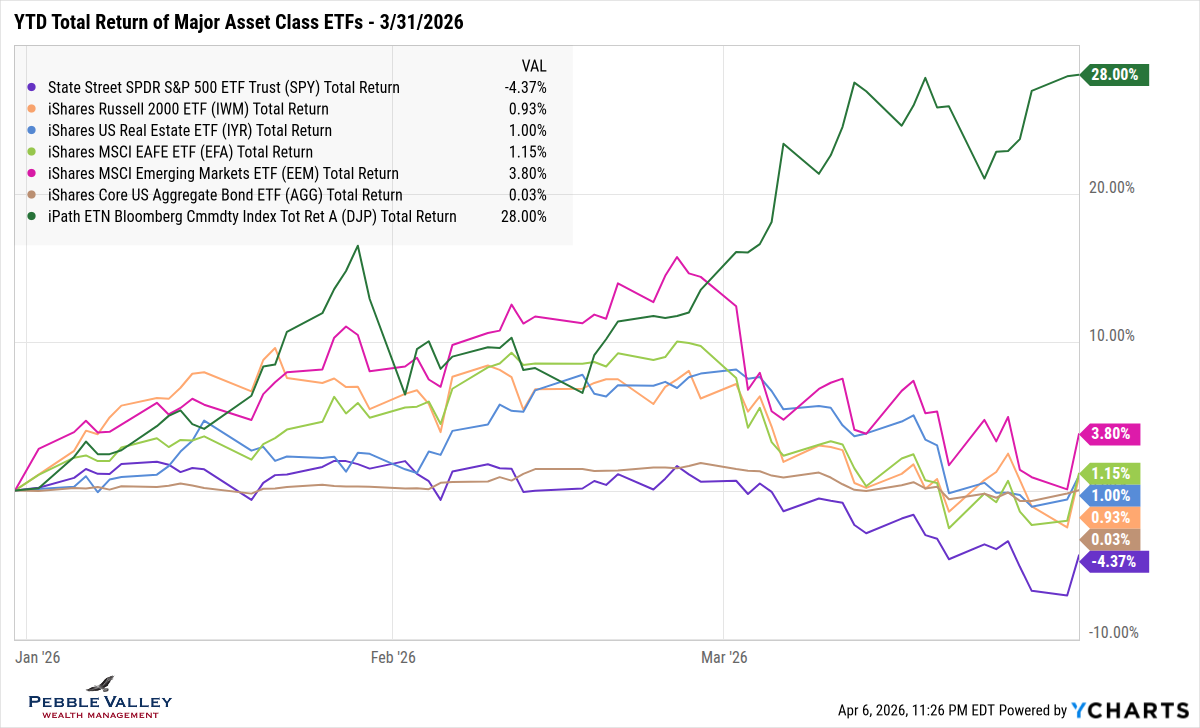
The first graph below shows total returns of the major asset class ETFs. This month I switched back to YTD – not only because we have enough months but also to highlight the swings in March. Before I comment on specific asset classes, note the large rally in equities on the last day of March. The main driver that day was the market reacting to a potential sooner end to Iran war after comments about Strait of Hormuz not necessarily needing to be opened before ending the war – likely stated for negotiating strategy rather than current plan. This was reversed after President Trump’s address on Wednesday, April 1. On a technical level, the large rally the last day is why the YTD returns for some ETFs – namely international – is quite different from the index returns in table above. ETF prices can react while US markets are open while index returns for international markets end the prior day from US trading perspective. … just in case any readers were wondering. Other things to note:
- Commodities (dark green) have run ahead of the pack, with Energy being key driver
- Emerging Markets (magenta) reversed the strong early year rally and even touched negative YTD before bouncing back on last day of the month
- US Large Caps are finding themselves in a position they have not been in a while – last
- The first three months of bond income was almost offset by drop in price as rates rose; recall this graph shows total return – income + price change
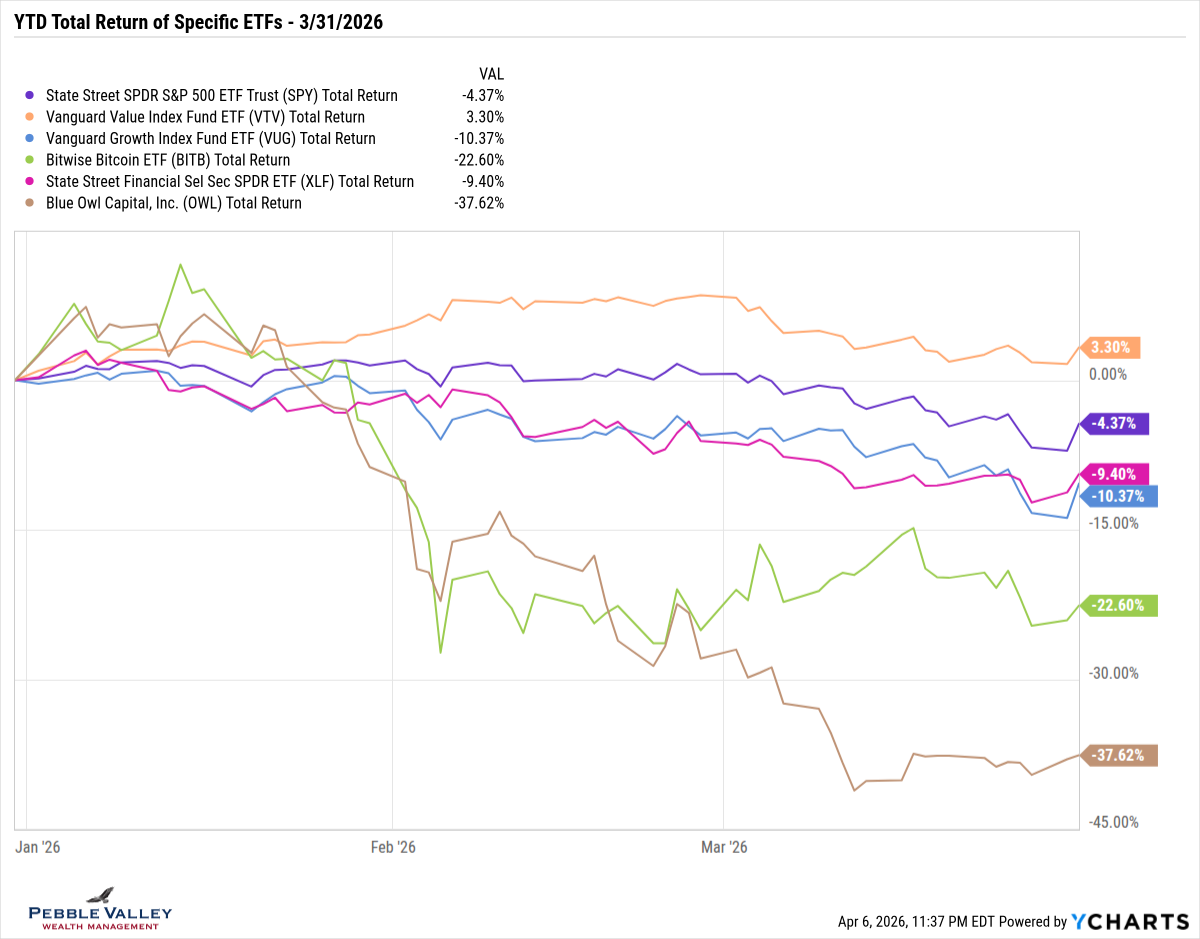
This month I again show a “focused graph” of a few different ETFs, using the same YTD timeframe. There are strong positive ETFs also – like the Commodity ETF from above or the SPDR Energy sector ETF (ticker XLE) which is up over 35% YTD. This graph focuses on moves to the downside, some of which started earlier in year before the war.
- Frame of reference is purple line – market cap weighted S&P 500 index
- Growth vs. Value – Growth (light blue) has been lagging since beginning of year; Value (orange) has outperformed and remains positive YTD
- Financial sector – Financials were the worst performing sector YTD (Industrials were worst for March); while they received favorable regulatory news, higher rates and potential Private Credit fallout are weighing on some companies
- Private Credit – I show a publicly traded Business Development Company (ticker OWL - brown); I also showed last month but woes continue as more investors want out but are typically limited to 5% per quarter based on the defined rules available when purchased
- Bitcoin is stable – yes Bitcoin (ticker BITB – green) is down -22% YTD but most of that pain occurred in late Jan / early Feb after what appears to be levered unwinding; it has been relatively stable since then, including this volatile, risk-off month; CLARITY Act is still delayed but SEC/CFTC provided “clarity” on security status
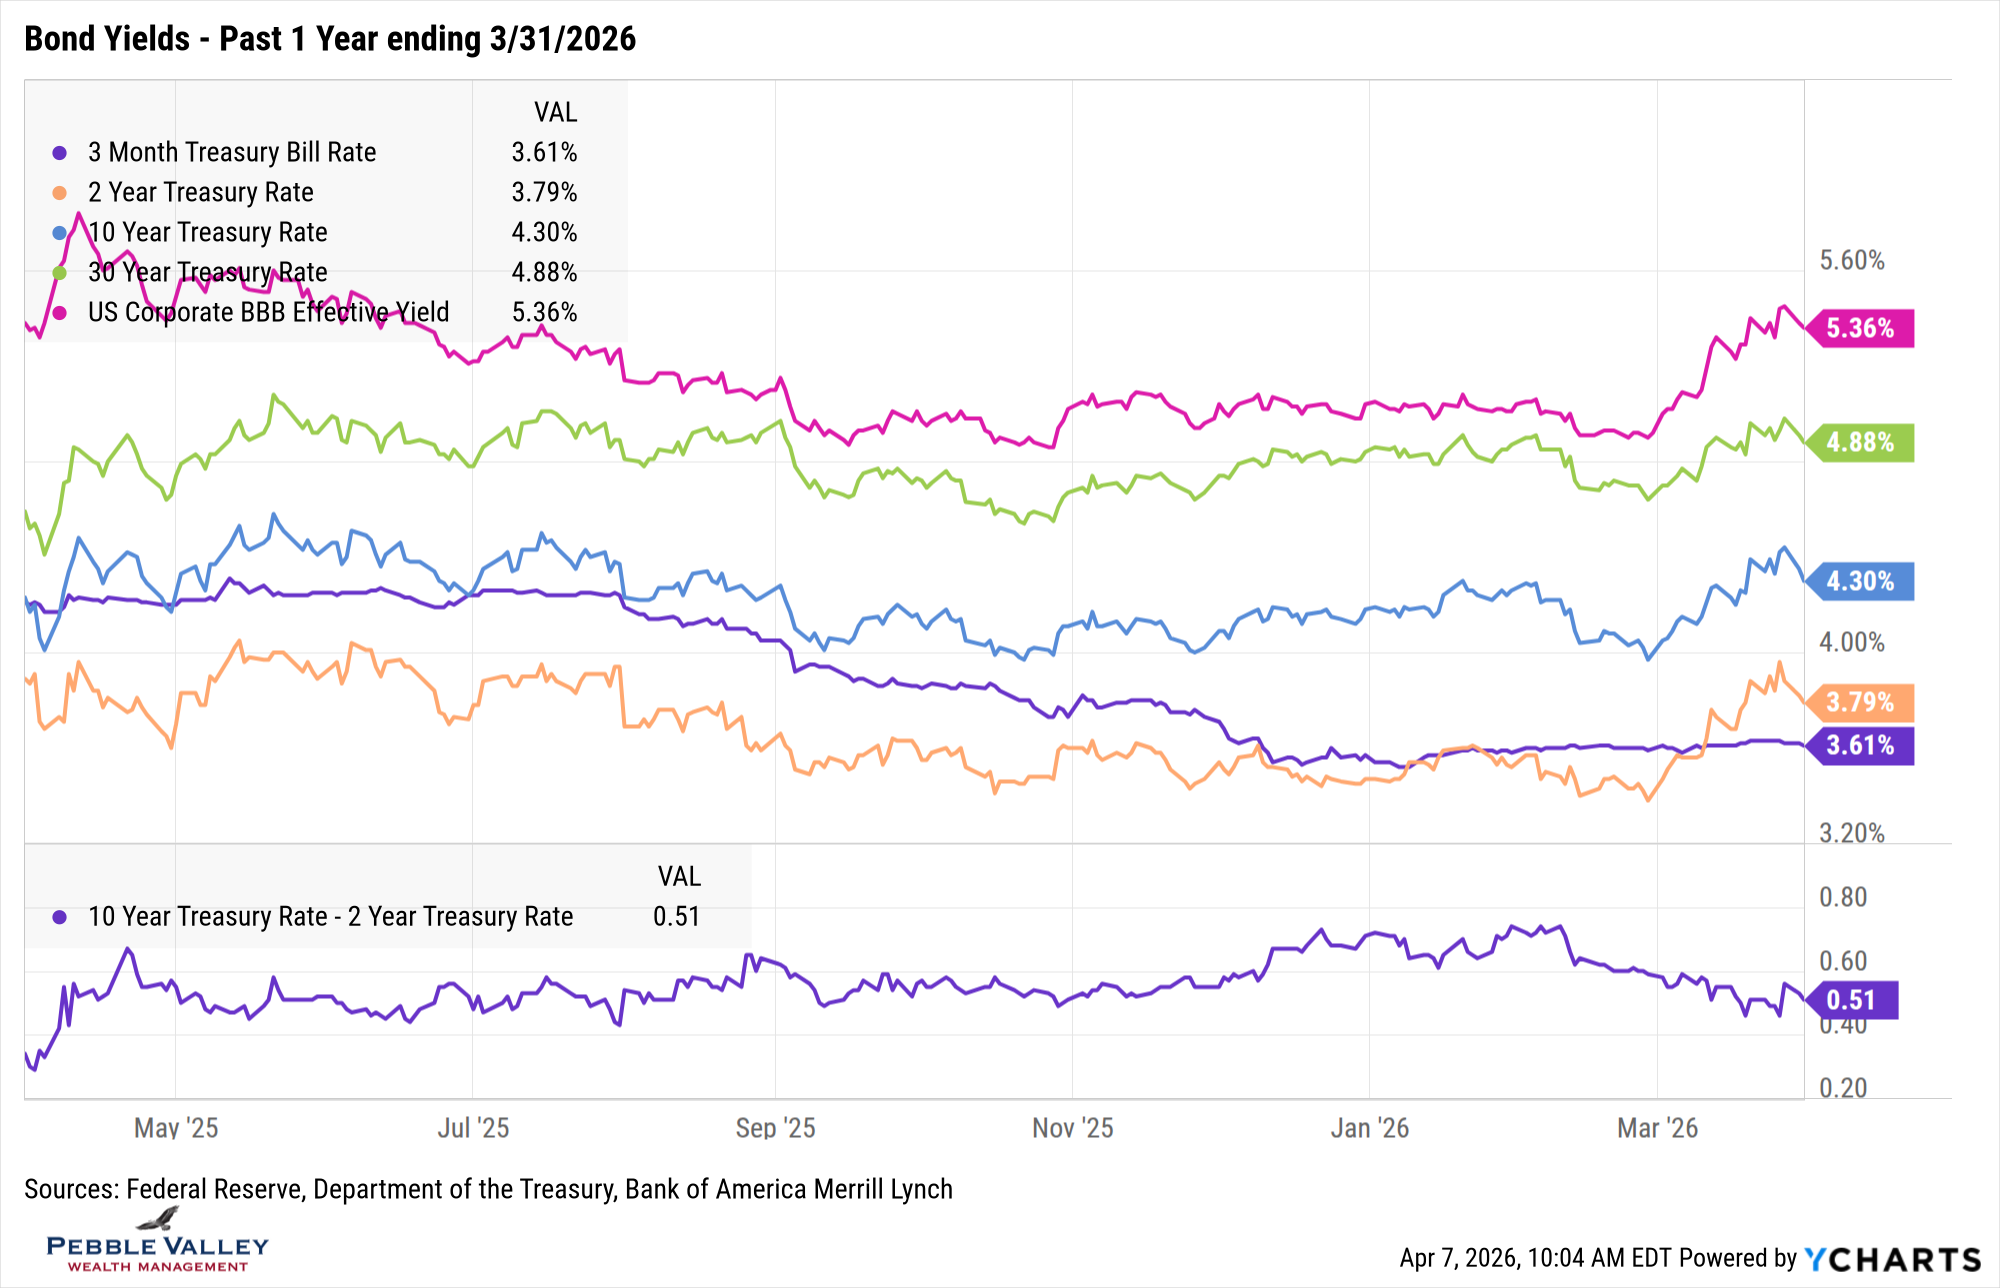
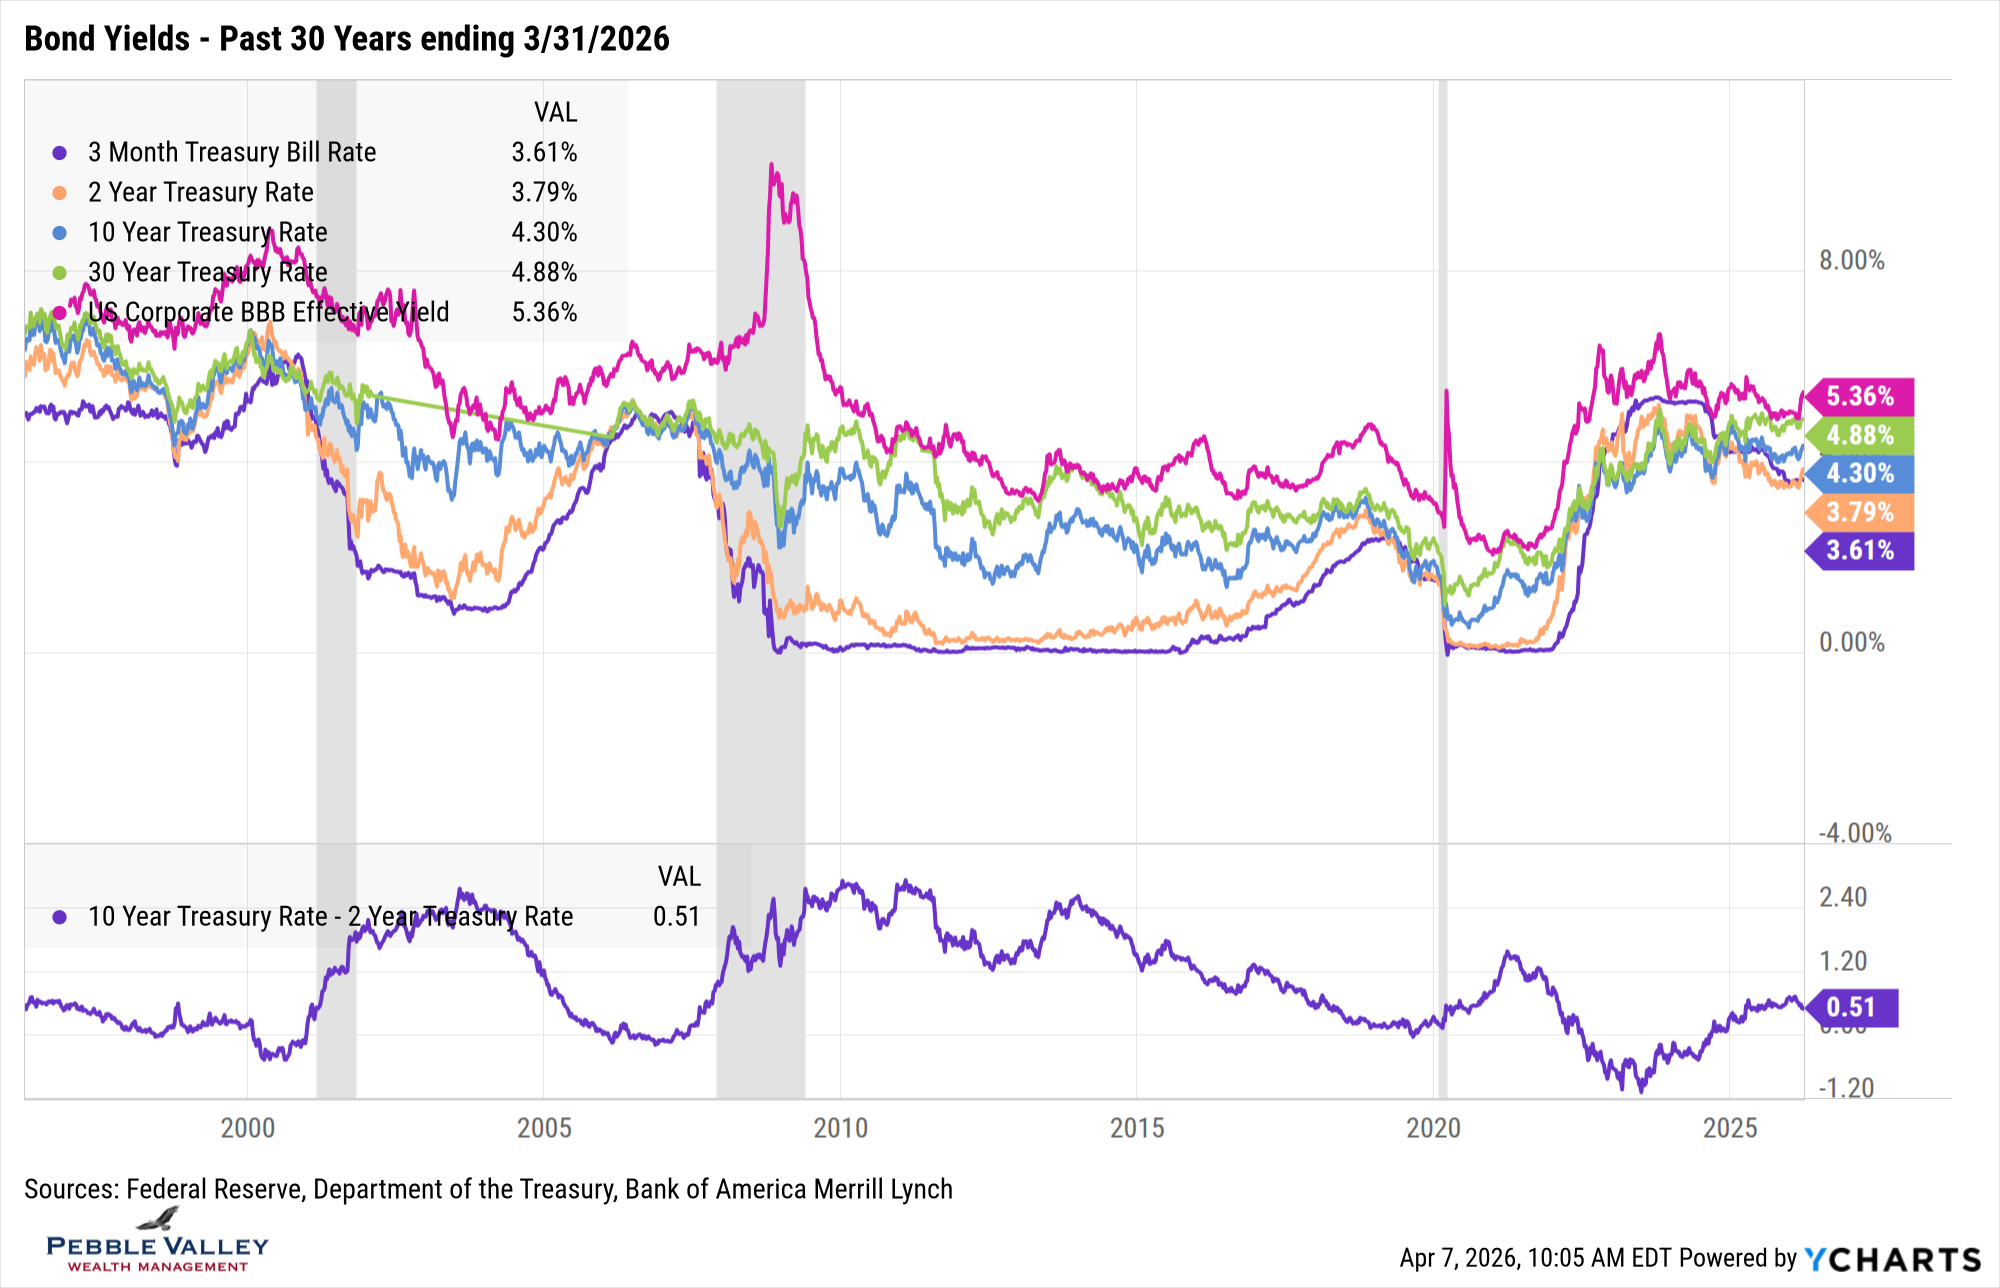
Next are the bond yield graphs over the past one- and thirty-year time frame. Here is what caught my attention this month:
- Again this month, pretty big moves in rates – but this time rates went higher
- First note how much rates fell in February, so our monthly starting point was quite low
- With energy prices shooting higher, inflation concerns outweighed any ‘flight-to-safety’ trade and yields rose; the 10-year rose by +0.33%
- 2-year rates rose even more – by +0.41% - as the market priced out any Fed rate cuts in 2026; the combo moves of 2s and 10s caused the curve to flatten by 8 bps
- Credit spreads continued to widen, but not as much as I expected; recall spread widening started in mid-January on back of Private Credit concerns
- From the tights in mid-January, BBB spreads (Investment Grade) are wider by 19bps while B spreads (High Yield) wider by 66bps.
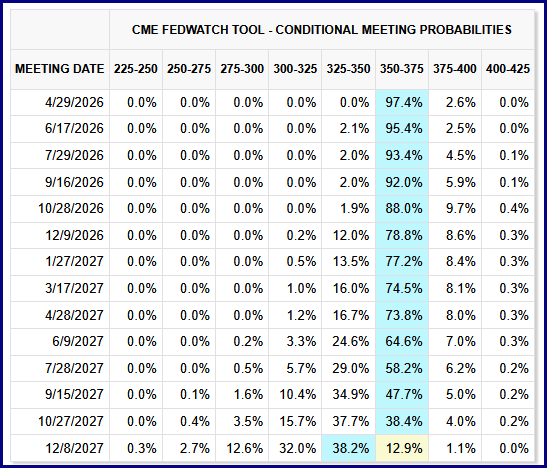
The FOMC meeting concluded on March 18th. The Fed held rates steady at current 3.50-3.75%. The Summary of Economic Projections (released four times per year) had a noticeable rise in PCE inflation expectations by year-end 2026, rising to 2.7% from the last estimate at 2.4%. Recall the Fed’s target is 2%. There was only a slight change in the summary of Fed Funds rate expectations with the longer run ticking up from 3.0% to 3.1%. The range for 2026 did tighten by a rate cut and there was only one dissenting vote who wanted to see a 25bps cut. Fed Chair Powell also offered up, without being asked, that he hasn’t decided if he will remain on as Fed Governor after his Chair role ends this spring. Fed Funds futures are no longer pricing in a couple more cuts in 2026 and has pushed out the next expected move well into 2027 (Source: CME FedWatch, April 7, 2026).
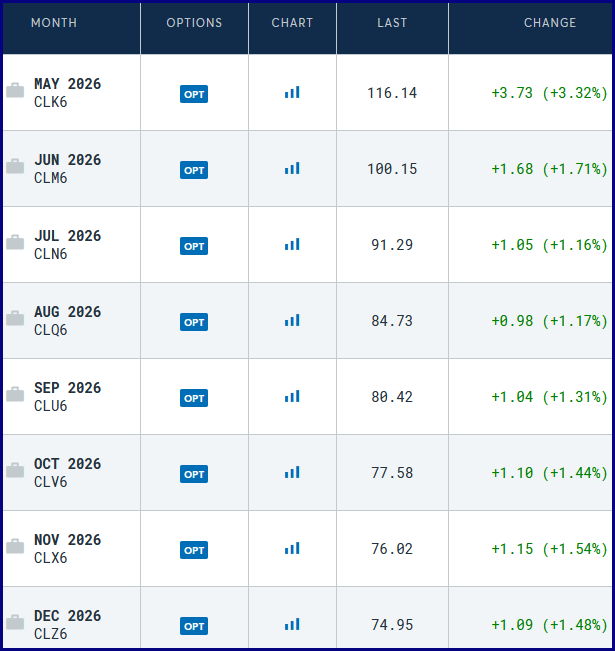
My special topic this month is the oil market and what the futures market in oil can indicate. I am not an expert in the oil market but is important to monitor due to the inflationary impact and if price remains elevated longer term, the potential slowdown in the economy. It is also important to note the two different oil markets. Brent Crude is the global seaborne benchmark, so very directly impacted by Strait of Hormuz. West Texas Intermediate (WTI) is inland US benchmark centered in Cushing, OK. I’m not going to get into the details of each and the unique spreads between the two right now, but it is important to know which benchmark is quoted when you hear cost per barrel in the news.
I am going to use WTI for my next point, which is how the market is pricing a barrel of oil you need now vs. months down the road. The futures market is a great source for this. The table below show WTI oil delivered over different months – from May through December. You can see the near-month of May is pricing $116 but then drops over time, down to $75 by December (Source: CME Group – 4/7/2026, 9:45am CT). If the market begins to price in a drawn out impact of the war, longer-dated months’ futures price will rise more, highlighting concerns of stickier inflation, higher Fed Funds rates and higher costs for businesses.
The good news is evening sunshine continues to extend in April, but darn that rain. A good time to keep in mind the May flowers.
Have questions? Reach out! We're happy to help.
Posted by Kirk, a fee-only financial advisor who looks at your complete financial picture through the lens of a multi-disciplined, credentialed professional. www.pvwealthmgt.com