

Asset Class Returns - 12/31/2025
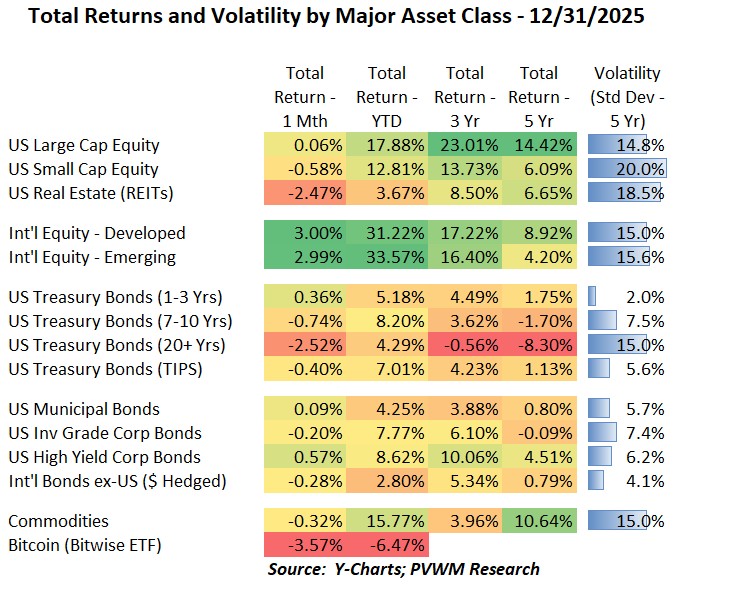
The last month of the year was flat to down across most asset classes. The exception was International equities, which were up 3% for the month and over 31% for the full year! About a third of those returns were from a weaker US Dollar (returns without effect of converting back to US Dollar returns closer to 21%). The full year returns for most other asset classes are also very impressive. A few things to note:
- US Small Caps lagged Large Caps YTD by 5% but still had impressive 12.8% return
- Even more impressive was the 15.8% YTD return for commodities, helped along by the eye-popping precious metals returns
- There were three exceptions to strong YTD returns - US REITs, currency-hedged International bonds and Bitcoin – though the first two were still positive.
- The Treasury curve steepened - difference in 10-yr minus 2-yr rate rose - by 0.38% in 2025 (10-year rate fell 0.40% but the 2-year fell by 0.78%)
- US Credit Bonds had very solid 2025 returns – dare I say close to equity-like returns for those who remember more normal equity markets!
- Bitcoin was down again in December but saw stability relative to the drop the prior two months.
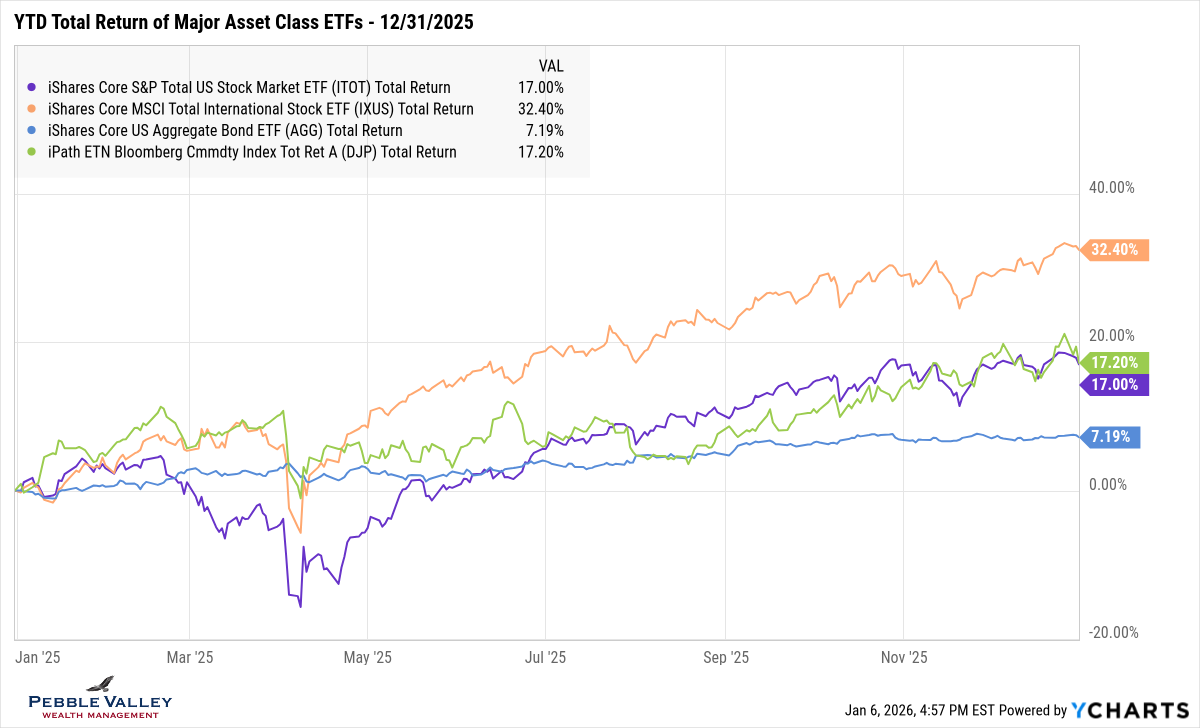
The first graph below shows YTD total returns of high-level major asset class ETFs. For the third month in a row, there was a mid-month drop in equity markets but rebounded by month-end. This month’s reversal was triggered by a more favorable CPI print (Nov CPI delayed until 12/18) and a higher Nov unemployment rate released the next day. The market priced in the possibility the Fed could continue cutting rates to support the jobs market while inflation remains on a downward trajectory. The last week of the year saw the US equity market end on a weak note, though the international markets were immune. The US Aggregate bond line did what bonds are supposed to do in a normal market – move steadily higher without much volatility – though the total return is a bit higher than a normal market.
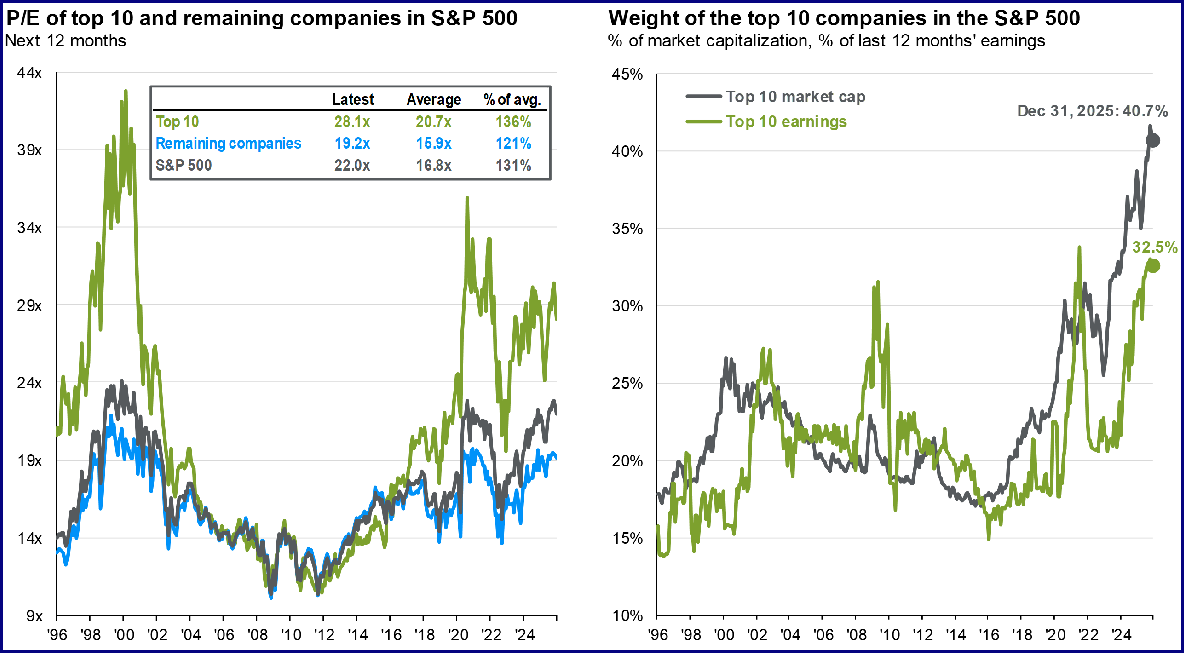
The next two graphs capture the current composition of the S&P 500 – a US Large Cap index: (Source: JPM Guide to Markets as of Dec 31, 2025):
- concentration of top 10 names and related forward PE
- 40.7% of market cap weighting is extremely high over past 30 years
- Yes, higher earnings to support but is magnified by higher forward PE of 28.1x
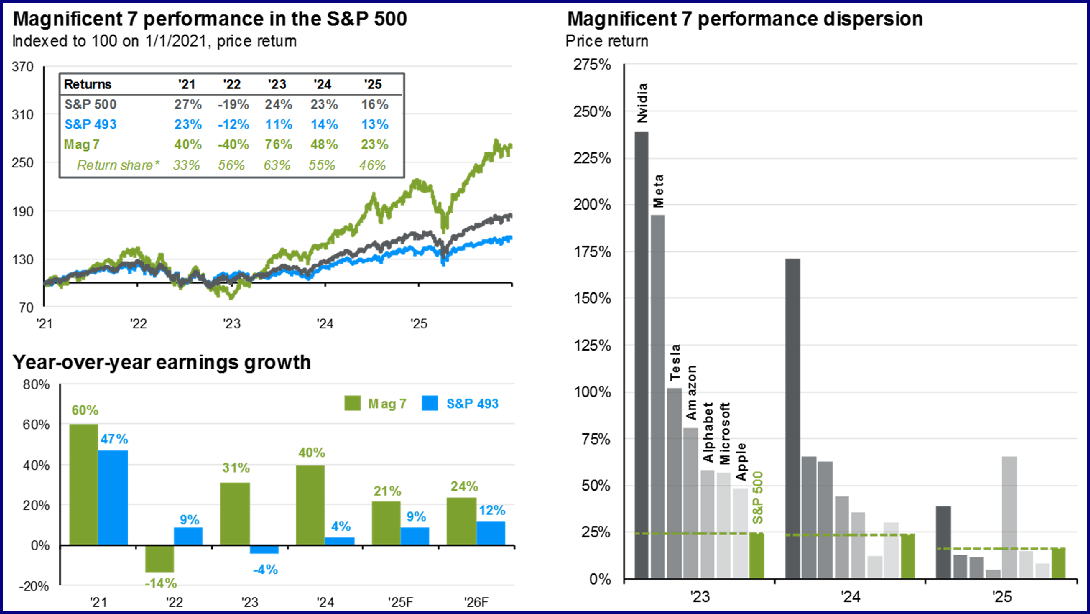
- still present but diminishing impact of the “Magnificent 7”
- “Mag 7” provided 63% of S&P500 price returns in ’23; “only” 46% in ‘25
- Only two "Mag 7" stocks had returns above overall market in 2025; the S&P493 is alive
- “Mag 7” stocks: AAPL, MSFT, AMZN, GOOG/L, META, NVDA, TSLA
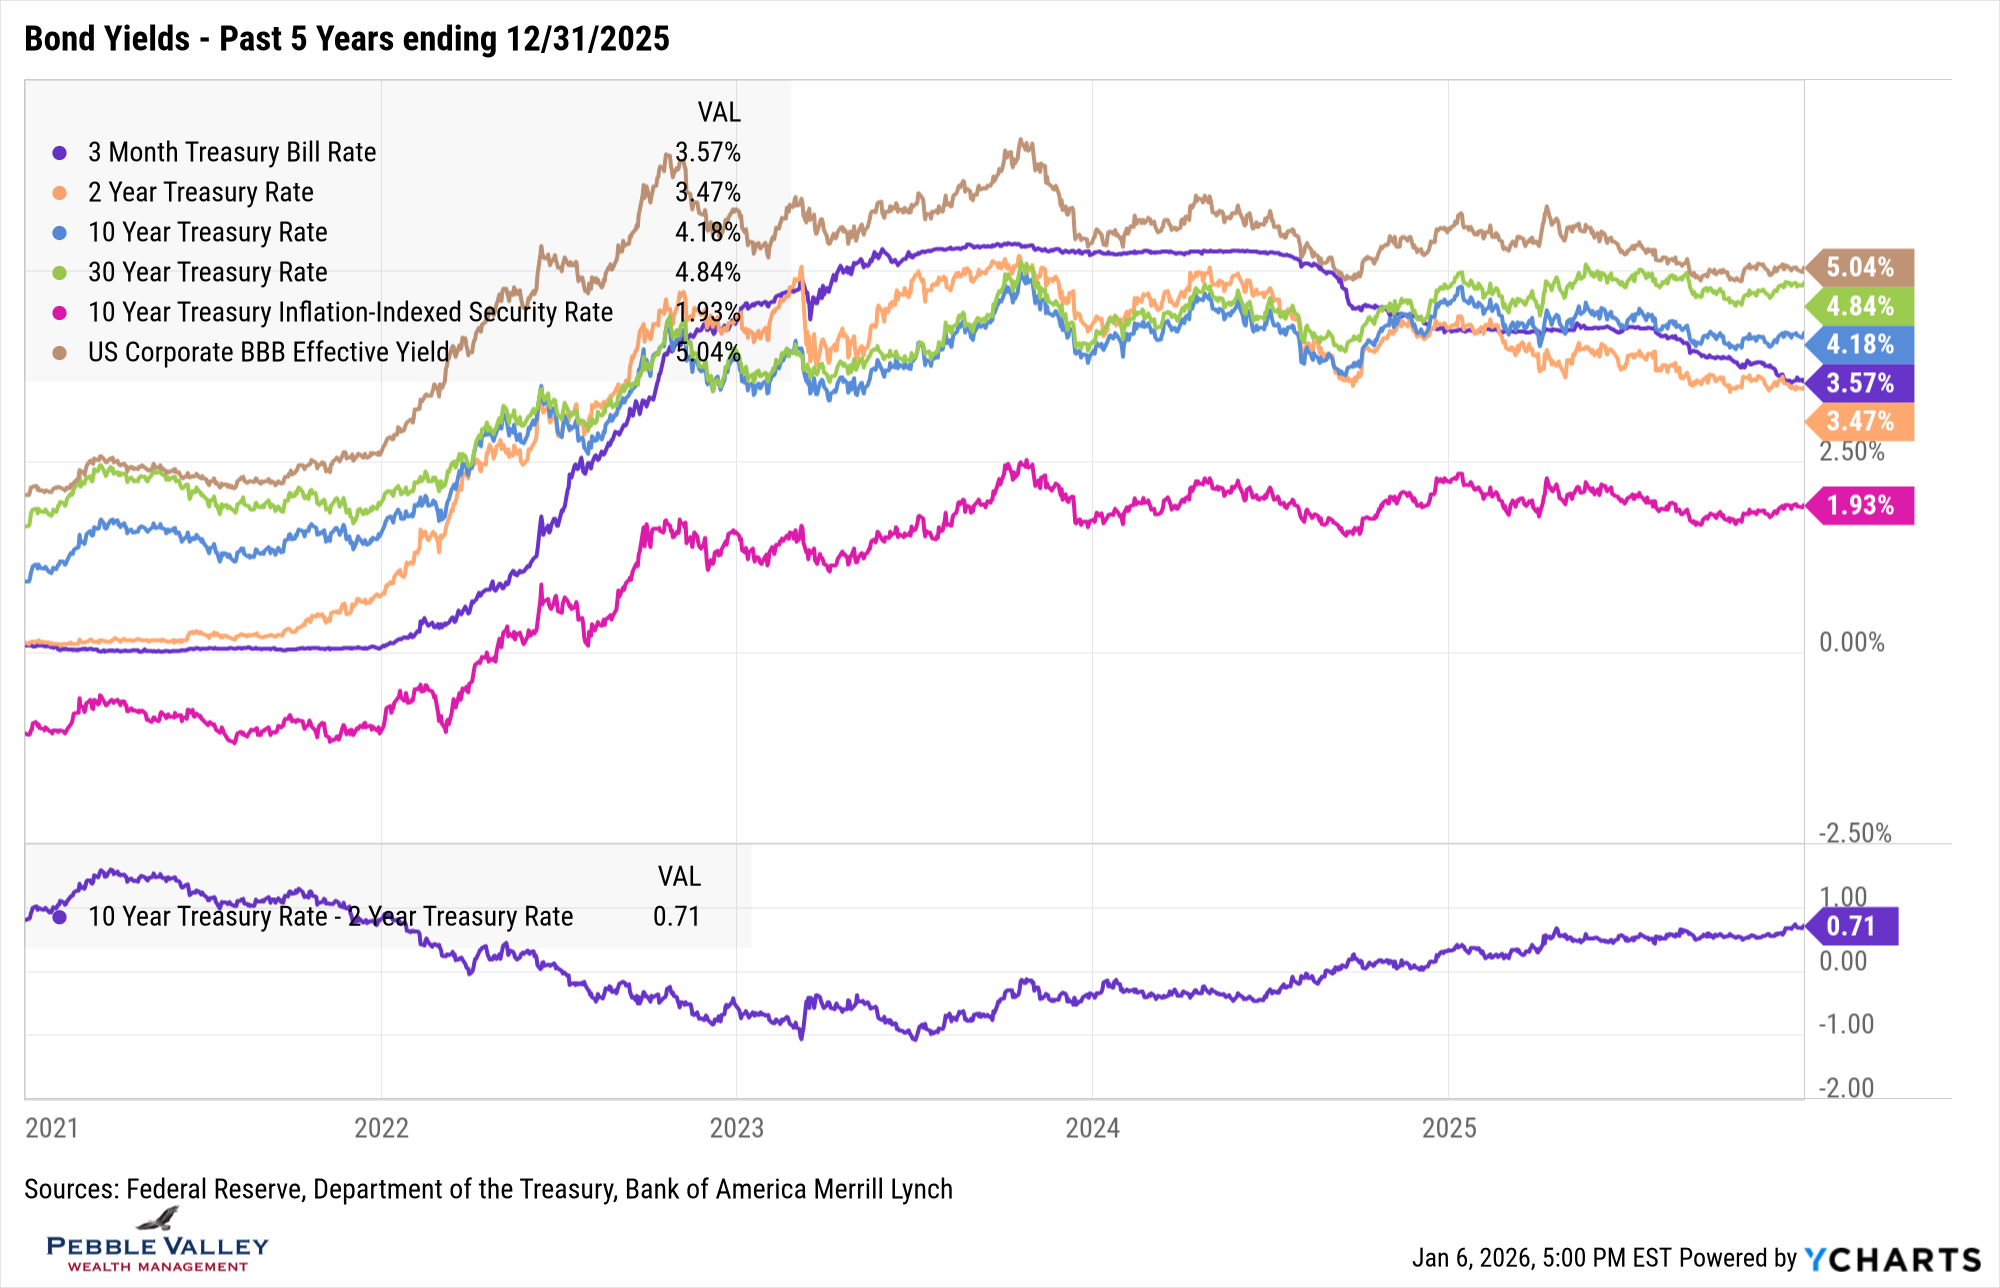
The usual bond yield graph for the past five years is shown below, along with the 2s/10s curve at the bottom. I would prefer to show even longer history for context but would lose the granularity from recent past to comment on developments (maybe two graphs next month!). The recent developments that caught my attention this month:
- Short maturities of 3-month TBills and 2-year shows the continued grind lower in rates
- 2-year rate lower than 3-month indicates more Fed cuts, but pace and amount unknown
- Long maturities (all the other lines) shows flat to slightly rising rates – most pronounced at 30-year (green line)
- 10-year real yield from TIPS also grinding closer to 2% again; recall TIPS holders receive this fixed coupon (yes has duration; lose if real rates rise) plus actual inflation rate in the form of increasing principal
- Difficult to see in graph but comparing BBB vs. 10-year, credit spreads tightened about 0.10% for the month and YTD
- 2s/10s curve at 0.71% (aka 71 basis points or bps), back to early ’22 levels before rates took off.
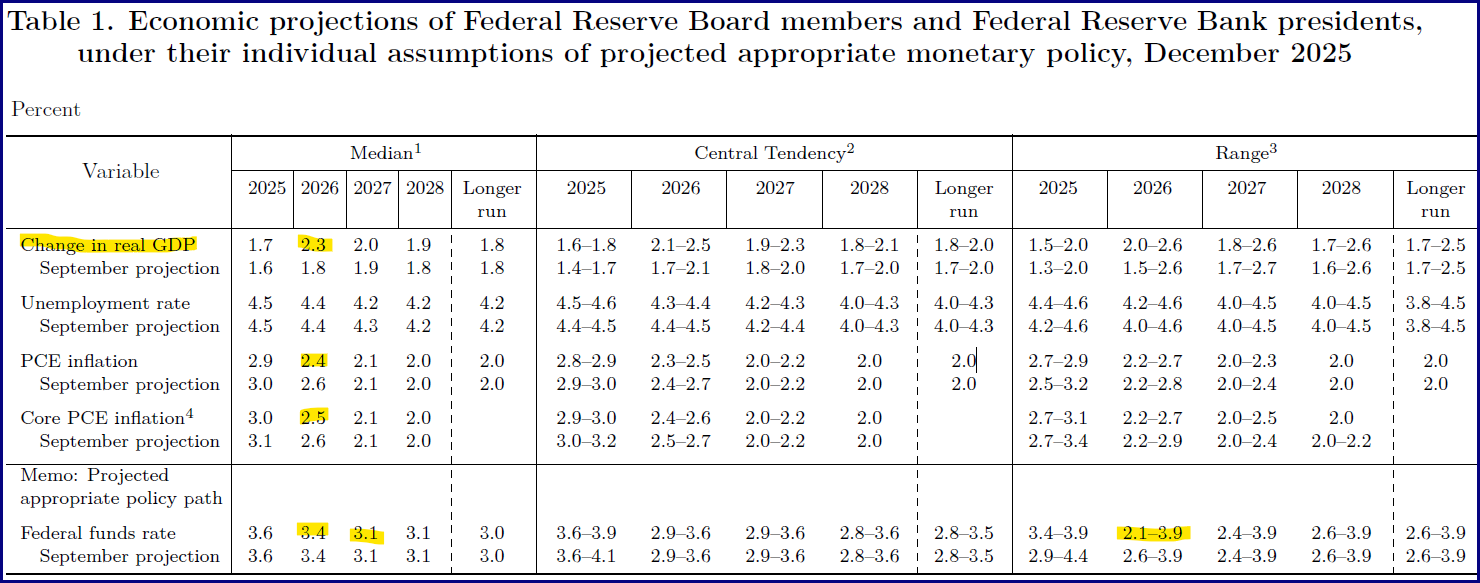
The last FOMC meeting of 2025 concluded on December 10th. The Fed cut by another 0.25% bringing Fed Funds rate to 3.50-3.75%. This is 0.75% lower than the beginning of 2025. The Fed also announced a program to begin purchasing $40bb of TBills over the next few months, citing ample reserves. This meeting also included the quarterly update to Summary of Economic Projections (SEP - see table below). A few things to note about the SEP:
- Large jump in projected real GDP for 2026, but Fed Chair Powell noted about 0.2% would have been in ’25 if not for the government shutdown
- PCE inflation is projected to remain well above 2% Fed target by end of 2026
- Fed Funds projections indicate only one rate cut in 2026 and one more in 2027; there is a range of views however – from 1.25% more cuts to 0.50% increase for 2026 alone
The market disagrees with the Fed’s projections. Using Fed Funds futures and the CME FedWatch tool, there is a 73% chance there will be two or more rate cuts by the end of 2026 (as of 1/6/2026). During the press conference following the FOMC meeting, Fed Chair Powell indicated the Fed Funds rate was at the high end of neutral, indicating the Fed is well positioned to wait and see how the economy unfolds. Powell mentioned jobs may be overcounted by about 60k jobs per month and watching if any tariff related inflation remains persistent. The November CPI report released Dec 18 showed CPI fell to 2.7% from 3.0% in September; November jobs report released a day later saw the unemployment rate ticked up to 4.6% from 4.4% in September – both moves more than expected. These readings support continued Fed cuts. The December data releases are back on their normal schedule in January.
My special topic this month is a brief update on 2026 changes due to annual IRS updates, Secure Act 2.0 and OBBBA.
New contribution limits on some key accounts; here is IRS for details
401k/3b contributions – $24,500 ($23.5k in ’25)
401k/3b catch-up (age 50+) – $8,000 ($7.5k in ’25)
401k/3b super catch-up (age 60-63) – replaces $8,000 with $11,250 (same as ’25)
Roth, Trad IRA contributions – $7,500 ($7.0k in ’25); income limits for eligibility and deductibility
IRA catch-up (age 50+, no super) – $1,100 ($1.0k in ’25)
HSA contributions – $4,400 / $8,750 for single/family
HSA catch up (age 55+ - NOT 50!, no super) – $1,000 (same as ’25)
Other stuff but I’ll stop here… refer to link above; call with questions
401k/3b Catch-up contributions for high earners must go to Roth
From Secure Act 2.0 ; was originally schedule to go in effect in 2024
If wages from same employer in 2025 was greater than $150,000, then catch-up contributions (up to $8,000 in 2026) must go to a Roth 401k bucket
Your 401k/3b sponsor/administrator will (or should) have accounts ready
More OBBBA provisions take effect in 2026
See my blog post from July 2025 for overview
Some provisions were effective for 2025 tax year (consider filing tax return early as you may be getting refund!)
A few key changes for 2026
Charitable – if don’t itemize can deduct up to $1k / $2k Single/MFJ
Charitable – if do itemize, must exclude first 0.50% x MAGI of deduction
Alternative Minimum Tax (AMT) – reduce phaseout triggers back to 2018 levels but keep initial exemption amount; “it’s complicated”
Federal Estate Tax exemption – increased from $13.99mm to $15.00mm; be aware of separate State Estate Tax exemptions where live – or want to!
Trump Accounts – will be opened and clarified this year; applies to children born between 1/1/2025 – 12/31/2028; outside donors are increasing
Educational assistance from employers, including student loan payments
Certain Farmland sales eligible to pay capital gains over 4 years; check rules and document at time of sale.
Happy 2026 to all! The sun sets a bit later each day but the same 24 hours need to be enjoyed and accounted for. Bring it on!
Have questions? Reach out! We're happy to help.
Posted by Kirk, a fee-only financial advisor who looks at your complete financial picture through the lens of a multi-disciplined, credentialed professional. www.pvwealthmgt.com