

Update on Covid-19 Data
Last month I summarized the COVID-19 projected deaths data on a normalized per 100,000 of population. I used projected deaths from the IHME Model since countries and states experienced the wave at different starting points. I normalized to total population since the true number of cases wasn’t known given the focus of testing only on those with symptoms. Since then some countries and states are over the peak hospitalization utilization and deaths. Other states haven’t hit their peak yet but resources are in place and more is known.
Another thing that has changed is the large number of tests being done. This is increasing the number of reported cases but deaths are not increasing in the same proportion as the expanded testing is picking up more cases that also existed in the past but were unknown.
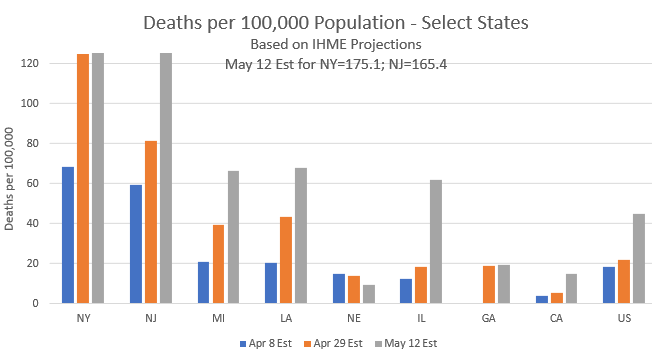
This blog post will update the same projected deaths per 100,000 population using updated IHME Model values. Note there were major modeling changes in early May attempting to incorporate among other things the transmission based on mobility of population as we slowly begin to re-open some areas in phases. Click here for summary. This resulted in higher projected deaths based on current state of the models. Model adjustments introduce additional noise initially but actual data will fine tune the model over time. It is also a consistent source that can be monitored. Actual number of deaths to date has already exceeded some earlier long-run estimates.
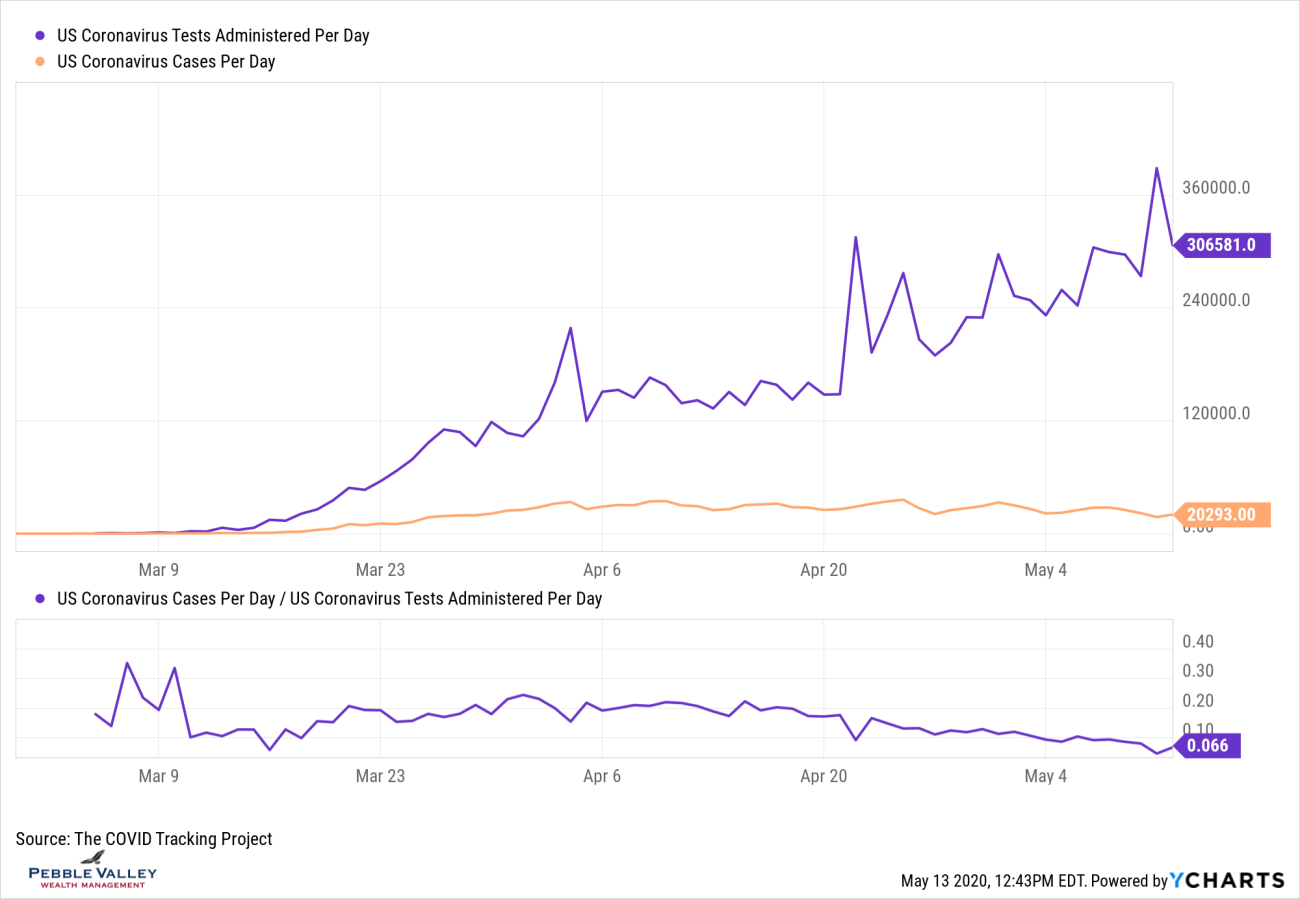
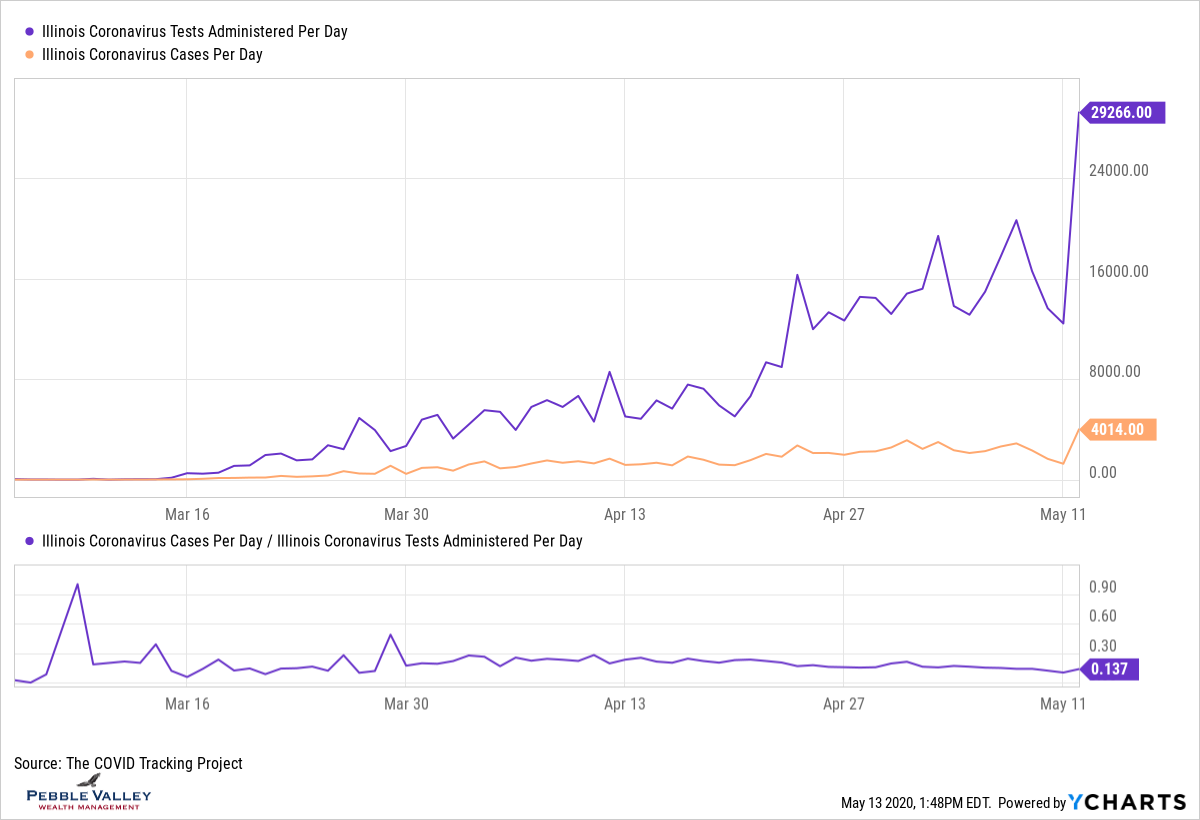
I will also summarize some testing data given the large increase in the number conducted. One important metric is the (# positive cases) / (total tests conducted) – called the positivity rate. Seeing a decreasing rate is a positive trend. Getting below 10% has been a favorable level cited by the experts.
To be clear there will be additional cases and deaths and attention must remain on providing medical resources and protecting the vulnerable. But it also possible to begin activity in areas over the hump or that never had large cases. With the additional testing and contact tracing, new flare-ups that will happen can be quickly identified and contact tracing occur. This will limit the amount of people that need to stop activity. Progress has also been made on therapeutics to reduce the time – but not eliminate – one suffers from COVID-19. Work continues in this area. See the article from the Morningstar healthcare strategist in my May 2020 newsletter for a great overview.
Continue to be safe and smart as you begin to resume some activity. Here are the graphs.
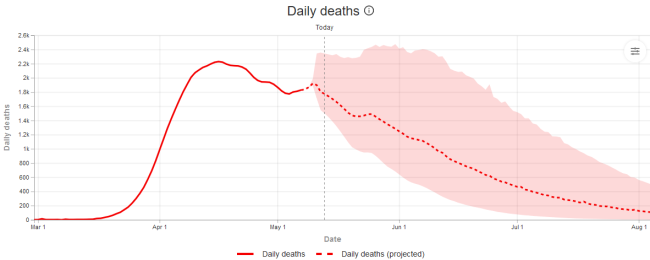
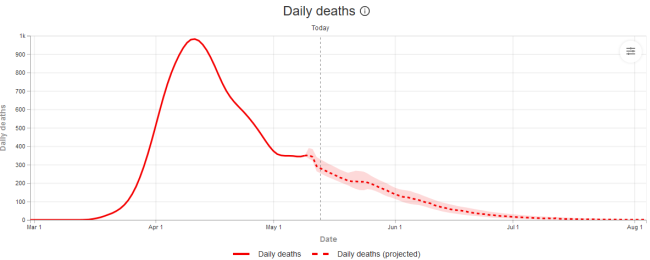
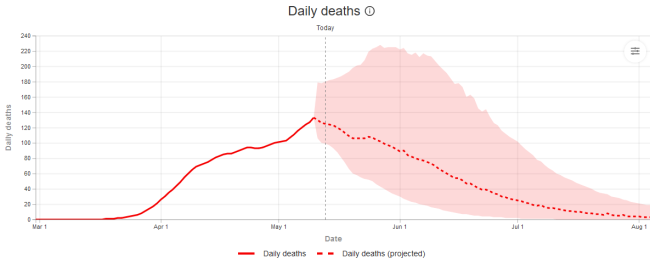
Projected daily deaths for the US in total; New York (past peak with tight range); Illinois and California (at peak with wide range). See other states by clicking here and select state in drop down box at top.
US
New York
Illinois (California looks very similar including recent blip which could be driven by expanded reporting)
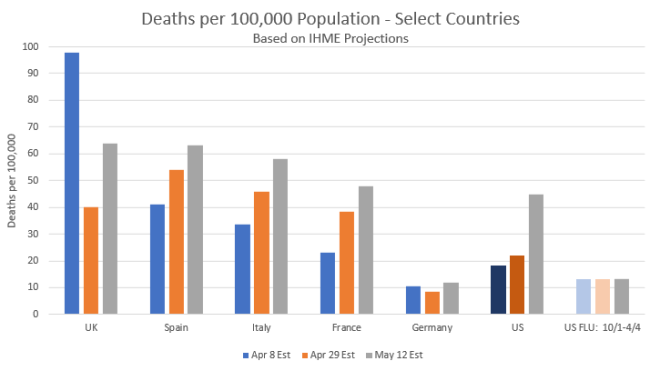
Here are the updated charts of projected deaths per 100,000 population, first by country then by state. The most recent estimates (grey bars) show a significant jump but recall the change in model assumptions and the added noise with the attempt to incorporate future mobility. Actual over time should be monitored.
Testing has expanded greatly as the government and healthcare industry worked closely to fast-track approvals and modify production capacity as needed. The top portion of graph shows total DAILY tests conducted and positive cases; bottom portion is % of those daily tests that result in positive COVID-19. Stats shown for US and Illinois. Down ratio is good and helps scientists begin to get a handle on true cases out there. A large number of cases reported for a day can get headlines, but always check relative to tests conducted. Note these tests only show if have COVID-19 that day. These are not the antibody tests to see if HAD COVID-19 in past.
Sources:
Johns Hopkins - https://coronavirus.jhu.edu/map.html
IHME - https://covid19.healthdata.org/united-states-of-america
Worldometer - https://www.worldometers.info/population/
CDC - https://www.cdc.gov/flu/about/burden/preliminary-in-season-estimates.htm
Posted by Kirk, a fee-only financial advisor who looks at your complete financial picture through the lens of a multi-disciplined, credentialed professional. www.pvwealthmgt.com