

“The Fed raises rates by …” What does that mean?
“The Federal Reserve, the central bank of the United States, provides the nation with a safe, flexible, and stable monetary and financial system.” – www.federalreserve.gov
Those are the words found on the website of the Federal Reserve. This blog post will briefly explain the Federal Reserve, focusing on interest rates and the impact on borrowing costs and investments. In summary, the Federal Reserve directly controls short-term interest rates (3-month treasury bills, bank savings rates, credit cards) which indirectly - along with many other factors - impact long-term rates (mortgage rates, bond funds… and inflation!). Short-term rates are going up leading to higher borrowing costs and making risky investments less attractive.
Brief Overview of the Federal Reserve
The Federal Reserve was established by Congress in 1913 with the main intent of making the banking system more stable. This followed various bank runs in the previous century and the most recent – The Panic of 1907 where J. Pierpont Morgan the banker stepped in – finally forcing action. The graphic below shows the structure with key entities and functions (Source: federalreserve.gov). The Board of Governors is an independent agency of the federal government overseen by Congress.
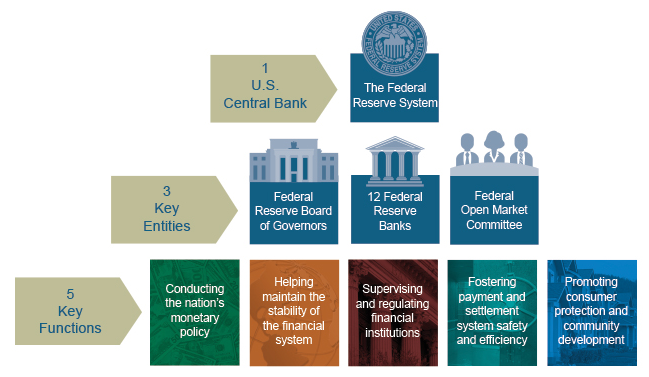
We will focus on the Federal Open Market Committee (FOMC) entity and the key function of conducting the nation’s monetary policy. Monetary policy refers to interest rate levels and reserves required for the banking system. This differs from fiscal policy which involves government spending, budgeting and debt issuance which is the domain of Congress. The FOMC was created from legislation in 1933 and 1935. The voting members of the Committee is made up of the Board of Governors, the president of New York Fed and 4 other presidents of regional bank on rotating basis, but all regional presidents attend the FOMC meetings and provide input on their respective regions. Oftentimes the term “The Fed” and FOMC are used interchangeably, but technically the FOMC is a subset of the Fed.
FOMC Meetings
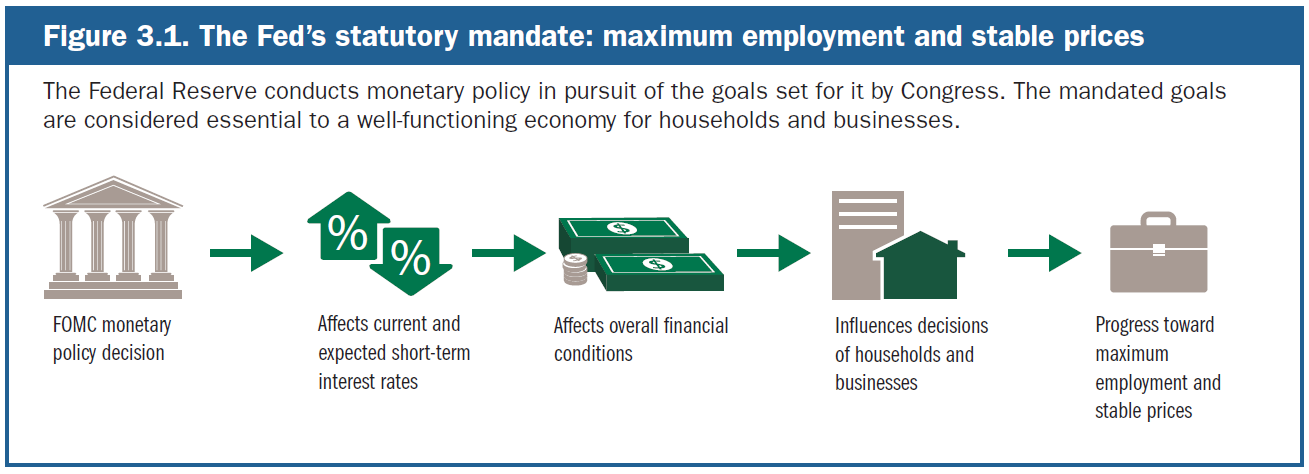
FOMC meetings are scheduled eight times a year. The economy is discussed and monetary policy decided. Each meeting concludes with a typical two-page statement succinctly describing the state of the economy and FOMC decision followed by a press conference by the Federal Reserve Chairman (currently Jerome Powell). At four of these meetings the FOMC also releases its “Summary of Economic Projections”. This captures the views of all FOMC attendees – voting and non-voting – on GDP growth, unemployment rate, PCE inflation and level of Federal funds interest rate (short-term rates the Fed controls directly). This last item – projected interest rate levels – is what is commonly referred to as “the dot plot” since each member’s projection is graphed on a plot by year and rate level. Meetings can also be held as needed, typically during times of financial upheaval, when the FOMC may act between meetings. The Federal Reserve has a dual mandate – to promote maximum employment and stable prices (see graphic below – Source: The Fed Explained: What the Central Bank Does). During normal economic times the FOMC meetings may not get much attention, but that is not the case during times of easing (lowering rates to help employment) or tightening (raising rates to support stable prices, i.e. fight inflation). It has been stated as the FOMC’s job is to “take away the punchbowl” just as the party is about to get out of hand.
Tools of the Federal Reserve
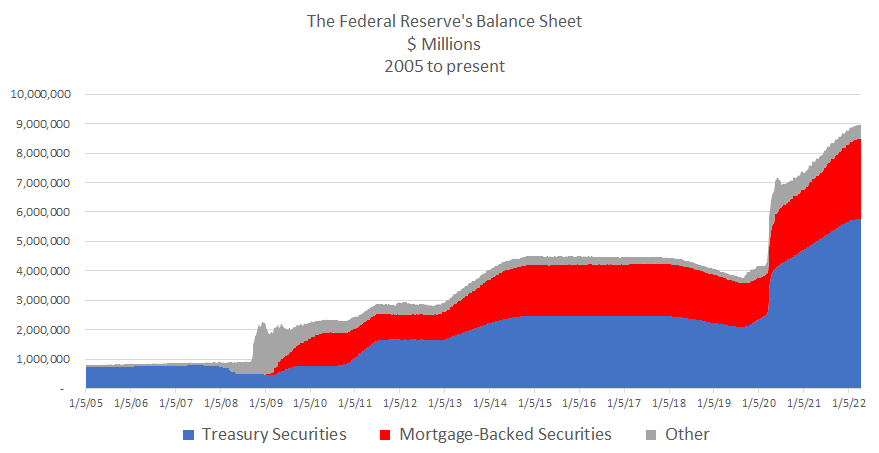
There are many Fed tools available as listed in this link. The primary tool used by FOMC is the “open market operations”. In general terms, the FOMC directs the NY Federal Reserve to buy or sell different securities to impact the federal funds rate – which is the interest rate banks lend reserve balances to each other overnight. This is very closely tied to treasury bills rates. Before 2008 the open market operations (OMOs) were mostly limited to adjusting reserve balances. Since the 2008 financial crisis the type of securities traded and the interest rate impacted has expanded significantly, ranging from longer-dated treasury bonds and mortgage-backed securities (which impact long-term interest rates) to repurchase agreements and even currency swaps with other central banks. The graph below shows the expanded use of the Fed’s balance sheet – growing from $1 trillion before 2008 to just under $9 trillion today – and the different assets now held (Source: American Action Forum).
Quantitative Easing and Tightening
The expanded use of OMOs to include purchases of longer-dated bonds is referred to as quantitative easing (QE). Quantitative easing was used after the federal funds rate got down to zero but additional stimulus to the economy was needed. By purchasing longer-dated bonds, the Fed drove up the price which lowered the yield. This made borrowing costs cheaper since loans are tied to treasury rates plus extra yield for credit risk (called the credit spread). The Fed even purchased mortgage-backed-securities to directly help keep mortgage rates low also by controlling the mortgage spread to treasuries.
… but all good things must come to an end… especially if inflation is heating up…
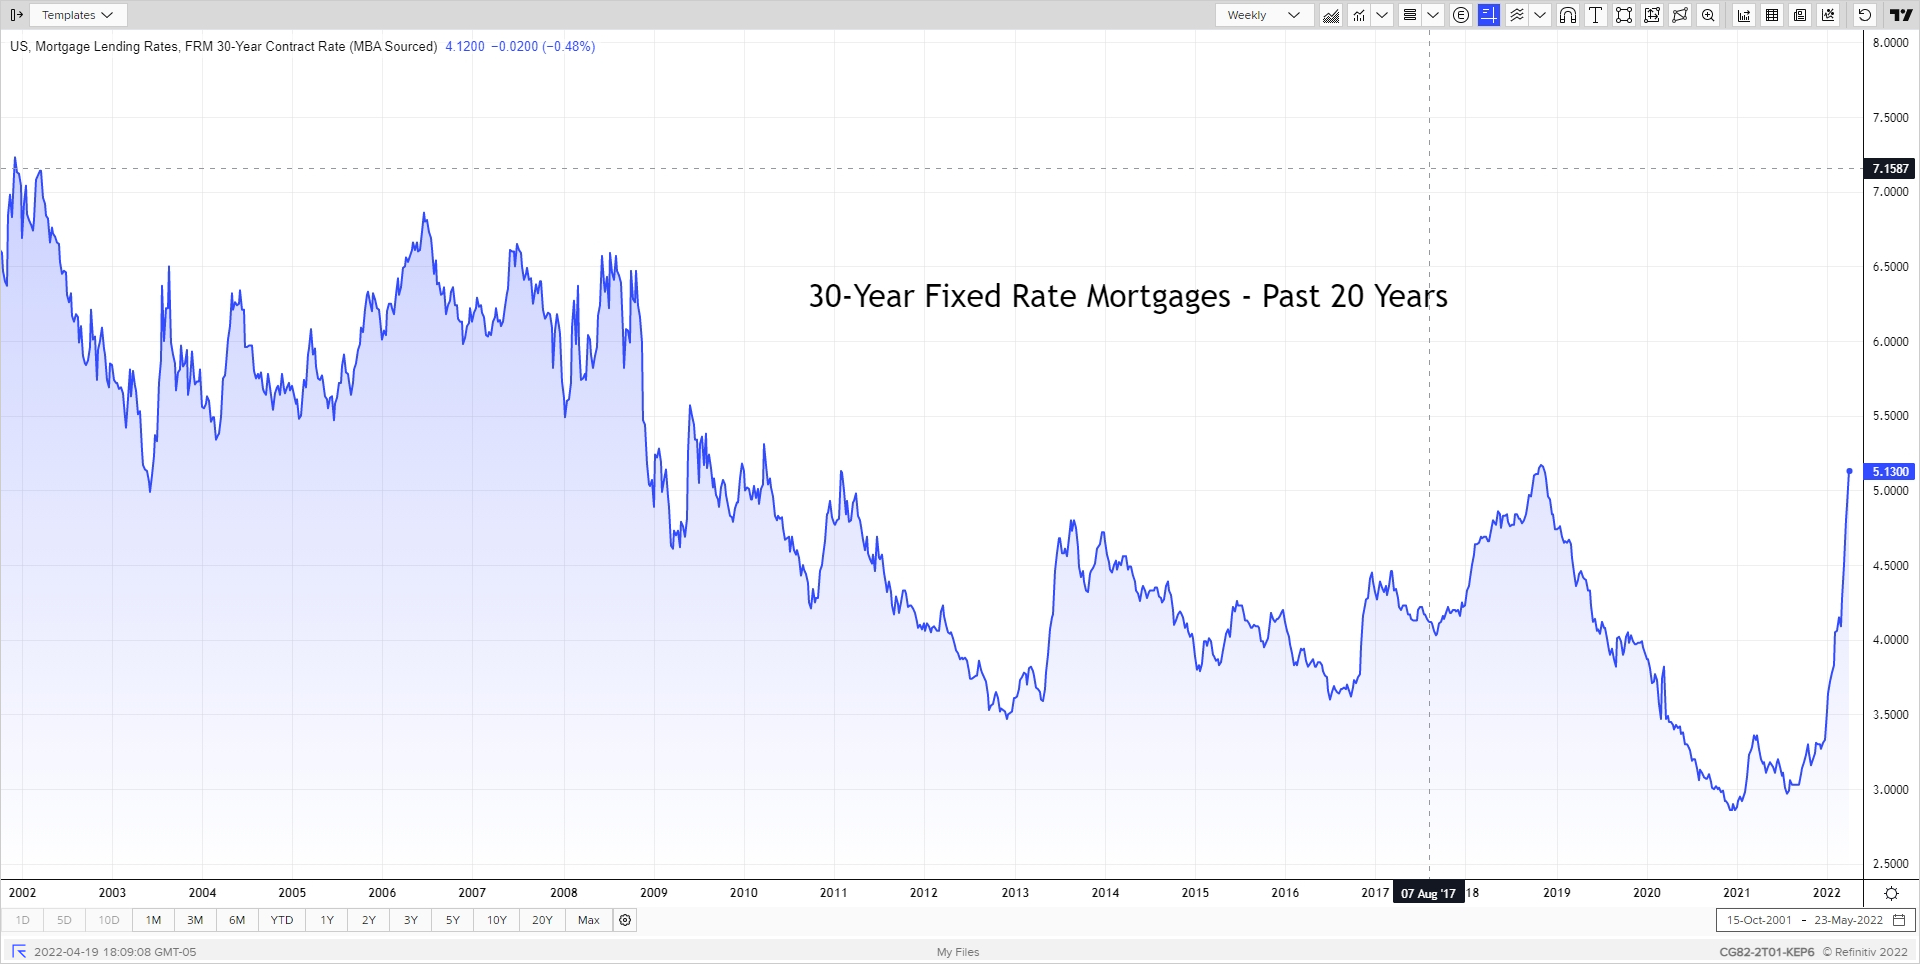
The reversing of the balance sheet is referred to as quantitative tightening (QT). Bonds are sold driving prices down and yields up on the longer maturities. Higher rates means higher borrowing costs and projects look less attractive on the margin. Initially QT will likely take the form of not reinvesting maturing proceeds which will reduce demand and prices, raising the rate. Later if the Fed needs to tighten further (i.e. raise rates), outright selling could occur, likely starting with mortgage-backed securities. The market doesn’t wait for an event to happen before it begins pricing in expected action. This can be seen by the very rapid rise of mortgage rates in 2022, rising even faster than 10-year treasuries.
Current Conditions – Rates are Going Up
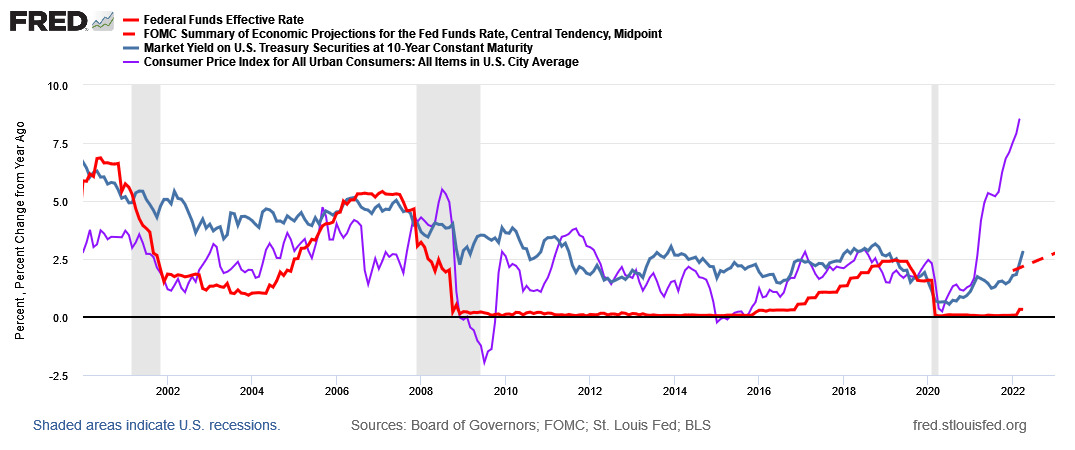
Since the great recession of 2008, the Fed has kept the federal funds rate quite low. It began slowly raising rates in 2016, then picking up the pace into 2018, but quickly reversed back to 0% when COVID hit in March 2020. The quantitative easing (QE) also increased substantially at that time. As an important backdrop, PCE inflation remained below the Fed’s 2% target. The stated strategy was to allow inflation to run above 2% for a while, so the average inflation rate was 2%. The economy recovered much quicker than expected after COVID (since it was a forced-shutdown recession) and inflation started rising. Initially the Fed thought inflation was ‘transitory’ but changed its view as inflation remained high. In the meantime, the Fed still engaged in QE despite growing price pressure. QE ended in early March 2022 and the Fed raised rates only ¼ point (0.25% or 25 basis points) at the March 16 meeting. Then a short five days later Chair Powell indicated the Fed may raise rates faster in the future as strong data continued to come in. Additional FOMC members also indicated a potential 0.50% move and since the current Fed doesn’t like to surprise the markets, it is a very likely move. The market has now priced in a likely Fed funds rate of 2.50 – 3.00% by the end of 2022 (Source: CME FedWatch – 4/19/22). In addition, the Fed will very likely announce the start of quantitative tightening (QT) in May, but perhaps the light variety of not reinvesting instead of outright selling bonds.
Inverted yield curve – “What does it mean Jimmy?” (The Commitments anyone?!)
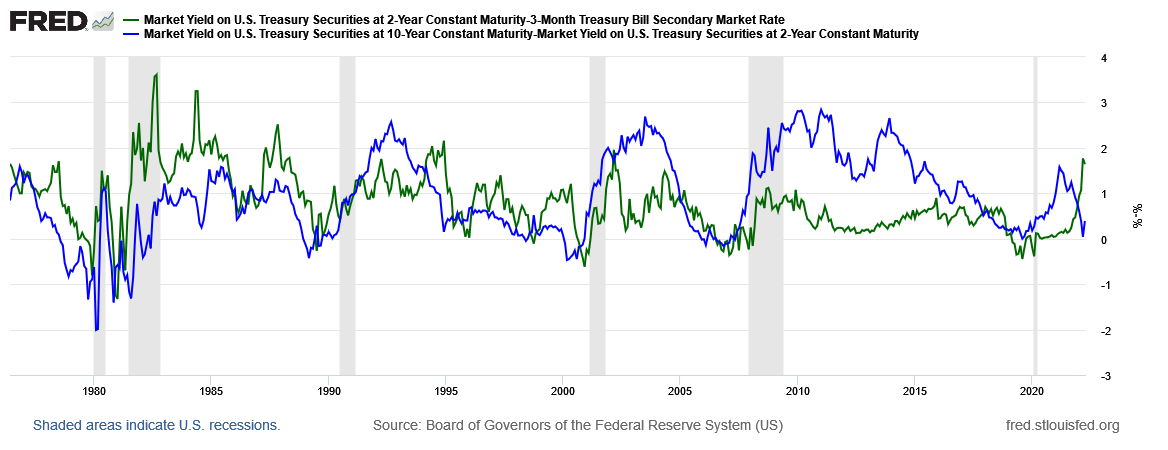
There is a large distance between current Fed funds rate and inflation rate as shown by the chart above. Can the Fed tame inflation – the stable price mandate – without pushing the economy into a recession? The Fed thinks they can but the market is less sure. One popular metric that received much media attention recently was the inverted yield curve. Inverted yield curve means rates on short-term bonds are higher than long-term bonds. Historically if the yield curve inverts a recession follows, but not immediately. The logic is high short-term rates reflect the Fed raising rates significantly but lower longer term rates implies the Fed has to lower rates in the not too distant future, bringing long term rates down. Some market participants use the 2s/10s curve (10 year minus 2 year rate) but the Fed prefers shorter maturities (I show 2 year minus 3 month treasury bills but the Fed prefers a more accurate implied 3 month rate 18 months from now). The 2s/10s briefly touched inversion but has since backed off while the shorter curve shape is far away from inversion. You can also see in the graph below historically the curve inversion occurs well before a recession (grey bars).
Thanks for the history lesson, but what does it mean for me?
Many things. And whether it is good or bad depends on your situation. In general, near-term bad but over the longer-term, it is favorable to normalize rates.
- Savings accounts will begin paying a noticeable interest rate again. Good news for retirees with safe investments.
- For those who avoided long-term bond investments, you will find reasonable yields as you wade back into the water, especially on the short- to mid-term maturities.
- Economic conditions will tighten and inflation may cool – not back to sub 2% but maybe to long-run 3-4% levels. Good news for all – but retirees hope it occurs after the September CPI reading to get a nice SS COLA adjustment!
- Those with adjustable loans – think credit cards, Home Equity Lines of Credit or adjustable mortgages - will see those rates rise in lockstep with Fed moves unless contractually capped.
- You have already seen it - mortgage rates have risen substantially, both from higher treasury rates but also the Fed taking the foot off the gas pedal of QE with mortgage bonds.
- You have already seen it – riskier assets like growth stocks including technology and crypto assets have pulled back as there is now an alternative – reasonable yields on much lower risk assets – and the present value of discounted cash flows (the price) is lower with higher rates. Goodbye TINA (There Is No Alternative).
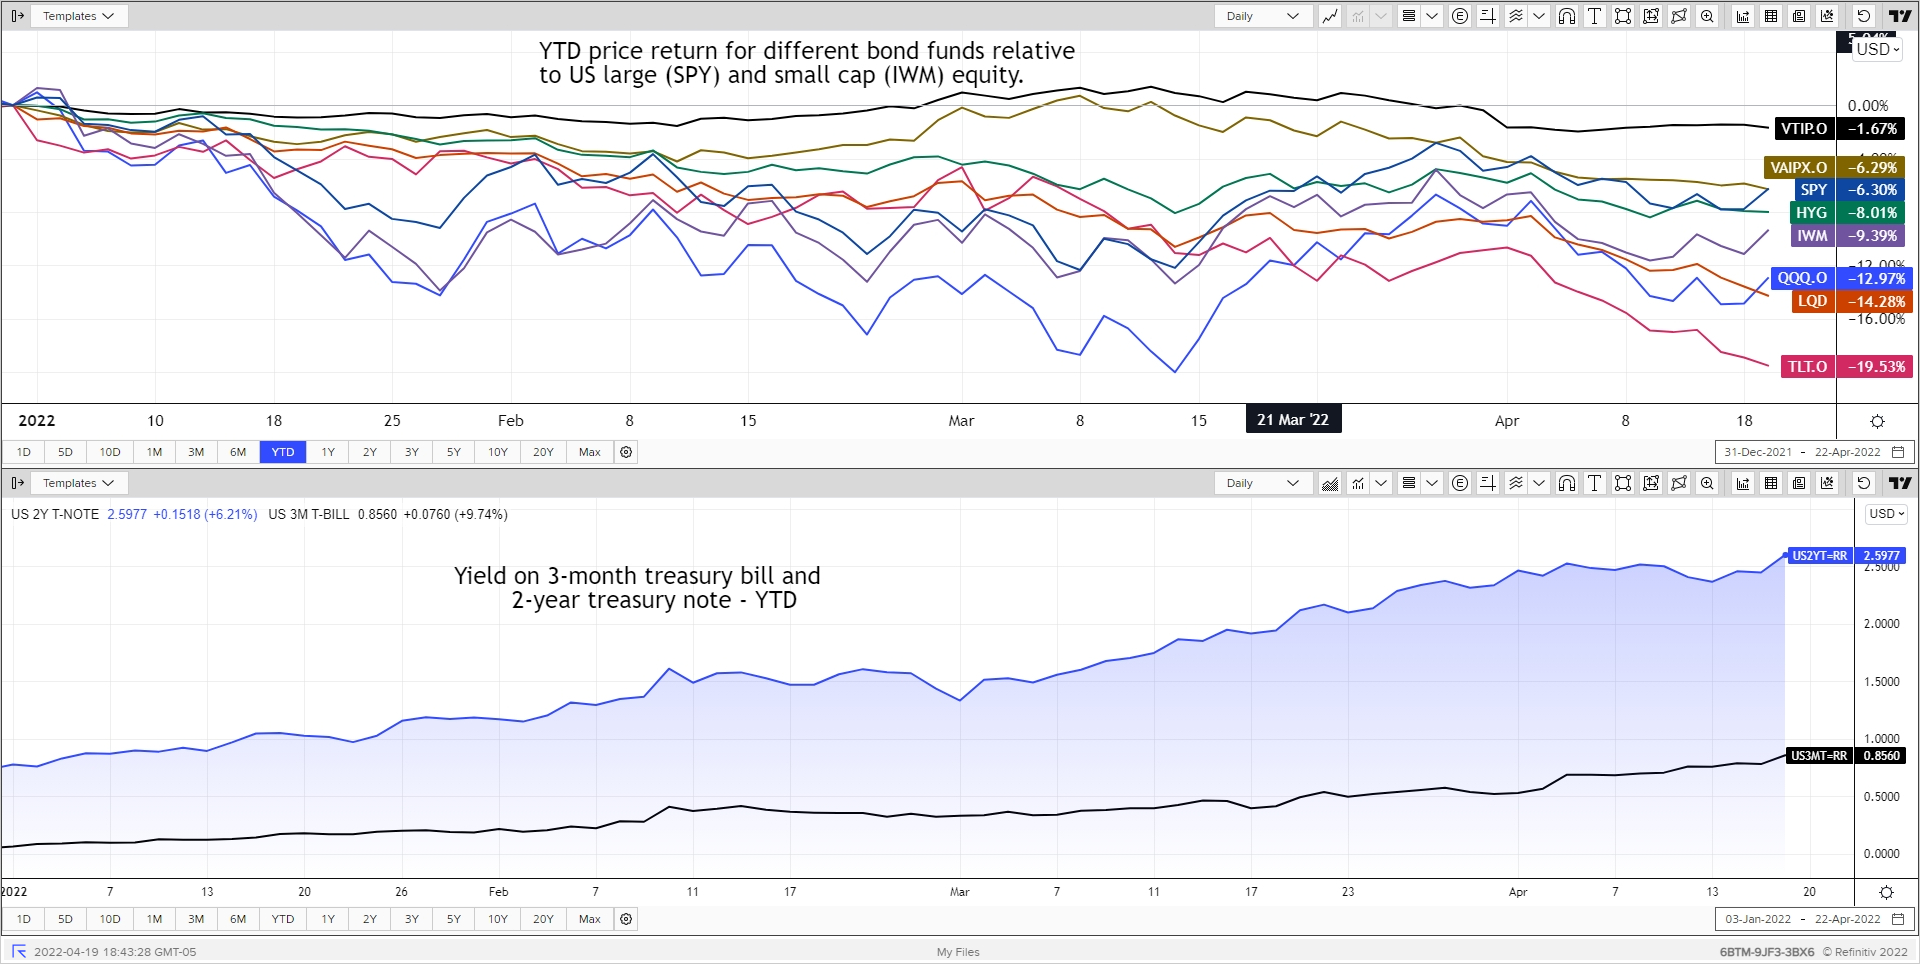
The graph below show YTD price returns for different bond funds along with equity indices. The two worst performers are longer duration bond funds with Nasdaq QQQ coming in third worst. This is an example of the market pricing in expectations.
So that is the story of the Federal Reserve. Yes Virginia, interest rates are going up. And hopefully the Fed can raise rates at the correct pace to slow inflation without pushing us into a recession. But hope isn’t a strategy - so be prepared.
Posted by Kirk, a fee-only financial advisor who looks at your complete financial picture through the lens of a multi-disciplined, credentialed professional. www.pvwealthmgt.com