

Asset Class Returns - 8/31/2025
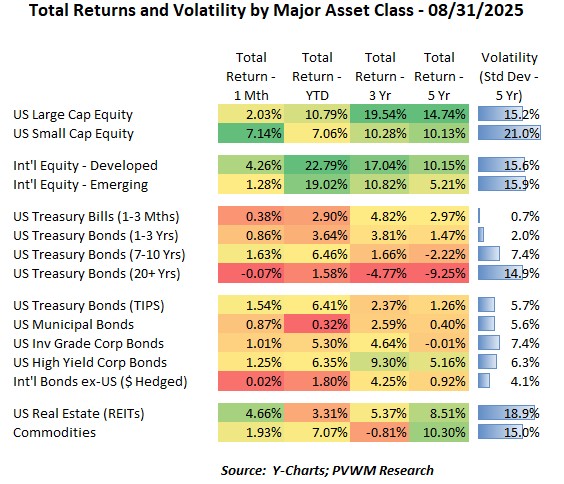
It was an overall solid month of returns for August – except for long Treasuries again. However, looking at the asset class details relative to July, it was mostly in “opposite land”:
- US Small Caps were the solid leader in US equities for August, closing the YTD gap between Large Caps substantially
- The sectors that led last month - Info Tech and Utilities - were flat to down in August while Health Care and Energy were in the top 3 at +5.4% and 3.6% respectively
- After being down last month, Int’l Developed markets once again beat Emerging, though YTD they both continue to crush it in the +20% territory (thanks weaker US $!)
- REITs had a strong return from lower rates, quickly shifting YTD returns to positive +3.3%
- Bond indices were up (rates down); the exception was long treasuries, though they continue to hold on to positive YTD returns helped by eight months of interest income in the total return calculation.
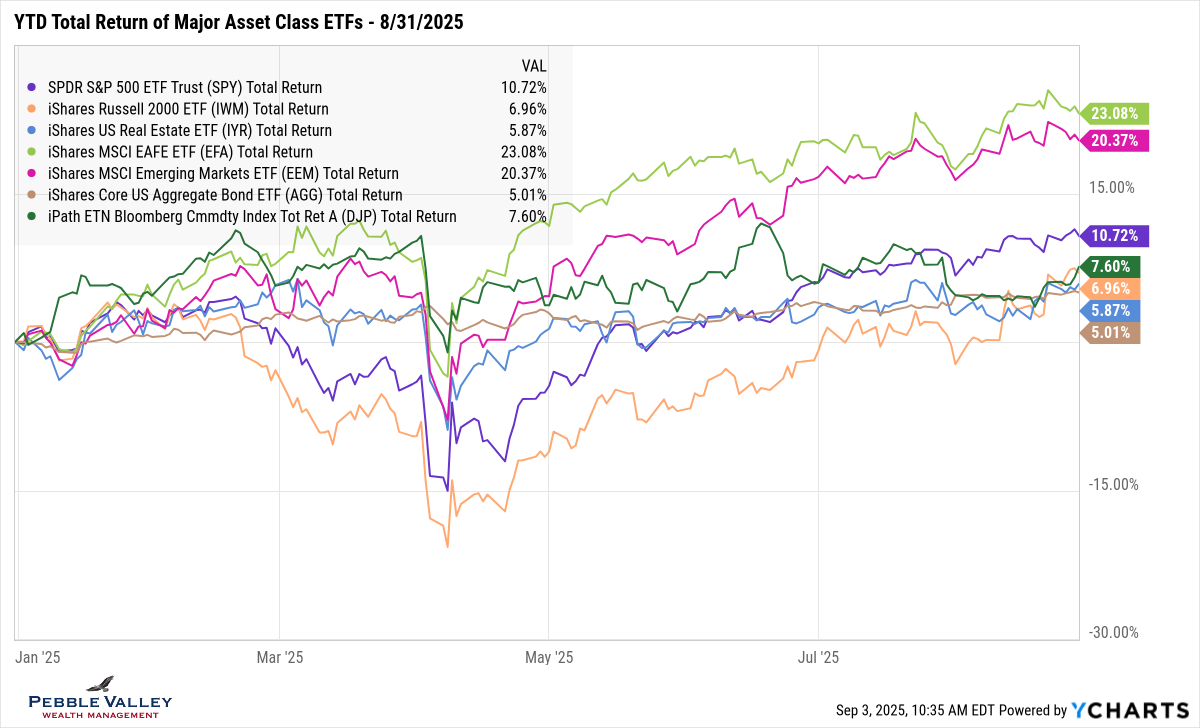
The graph below shows YTD total returns of major asset class ETFs. All lines in the graph continue to move up. One line that really moved up is the previously mentioned US Small Caps as it landed with the rest of indices on solid positive YTD territory. At the factor level (not shown), Value and Dividend payers outperformed Growth and Momentum in August – continuing with the “opposite land” theme.
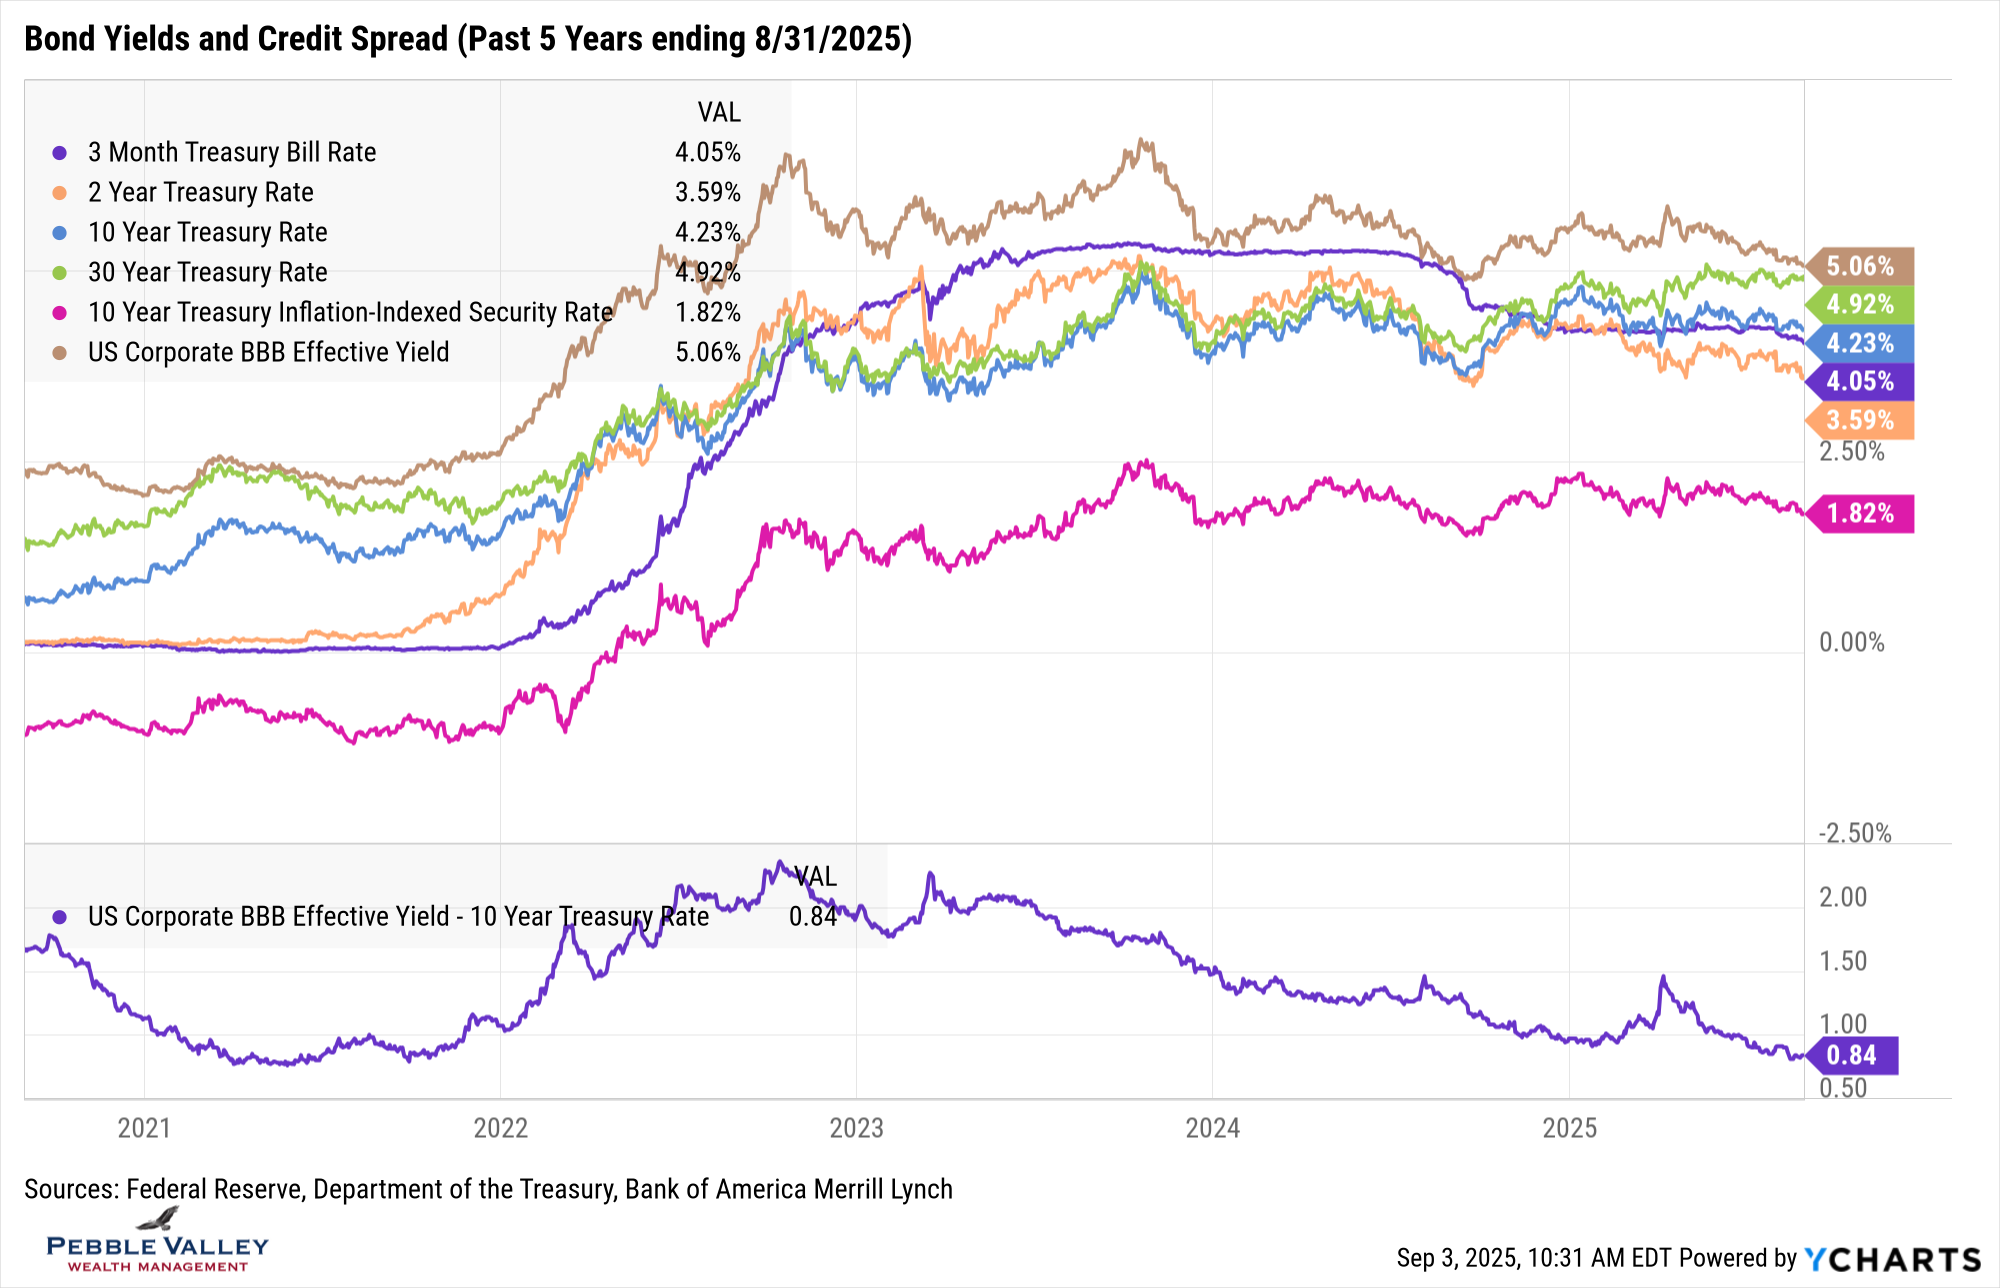
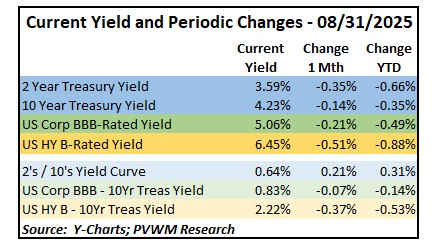
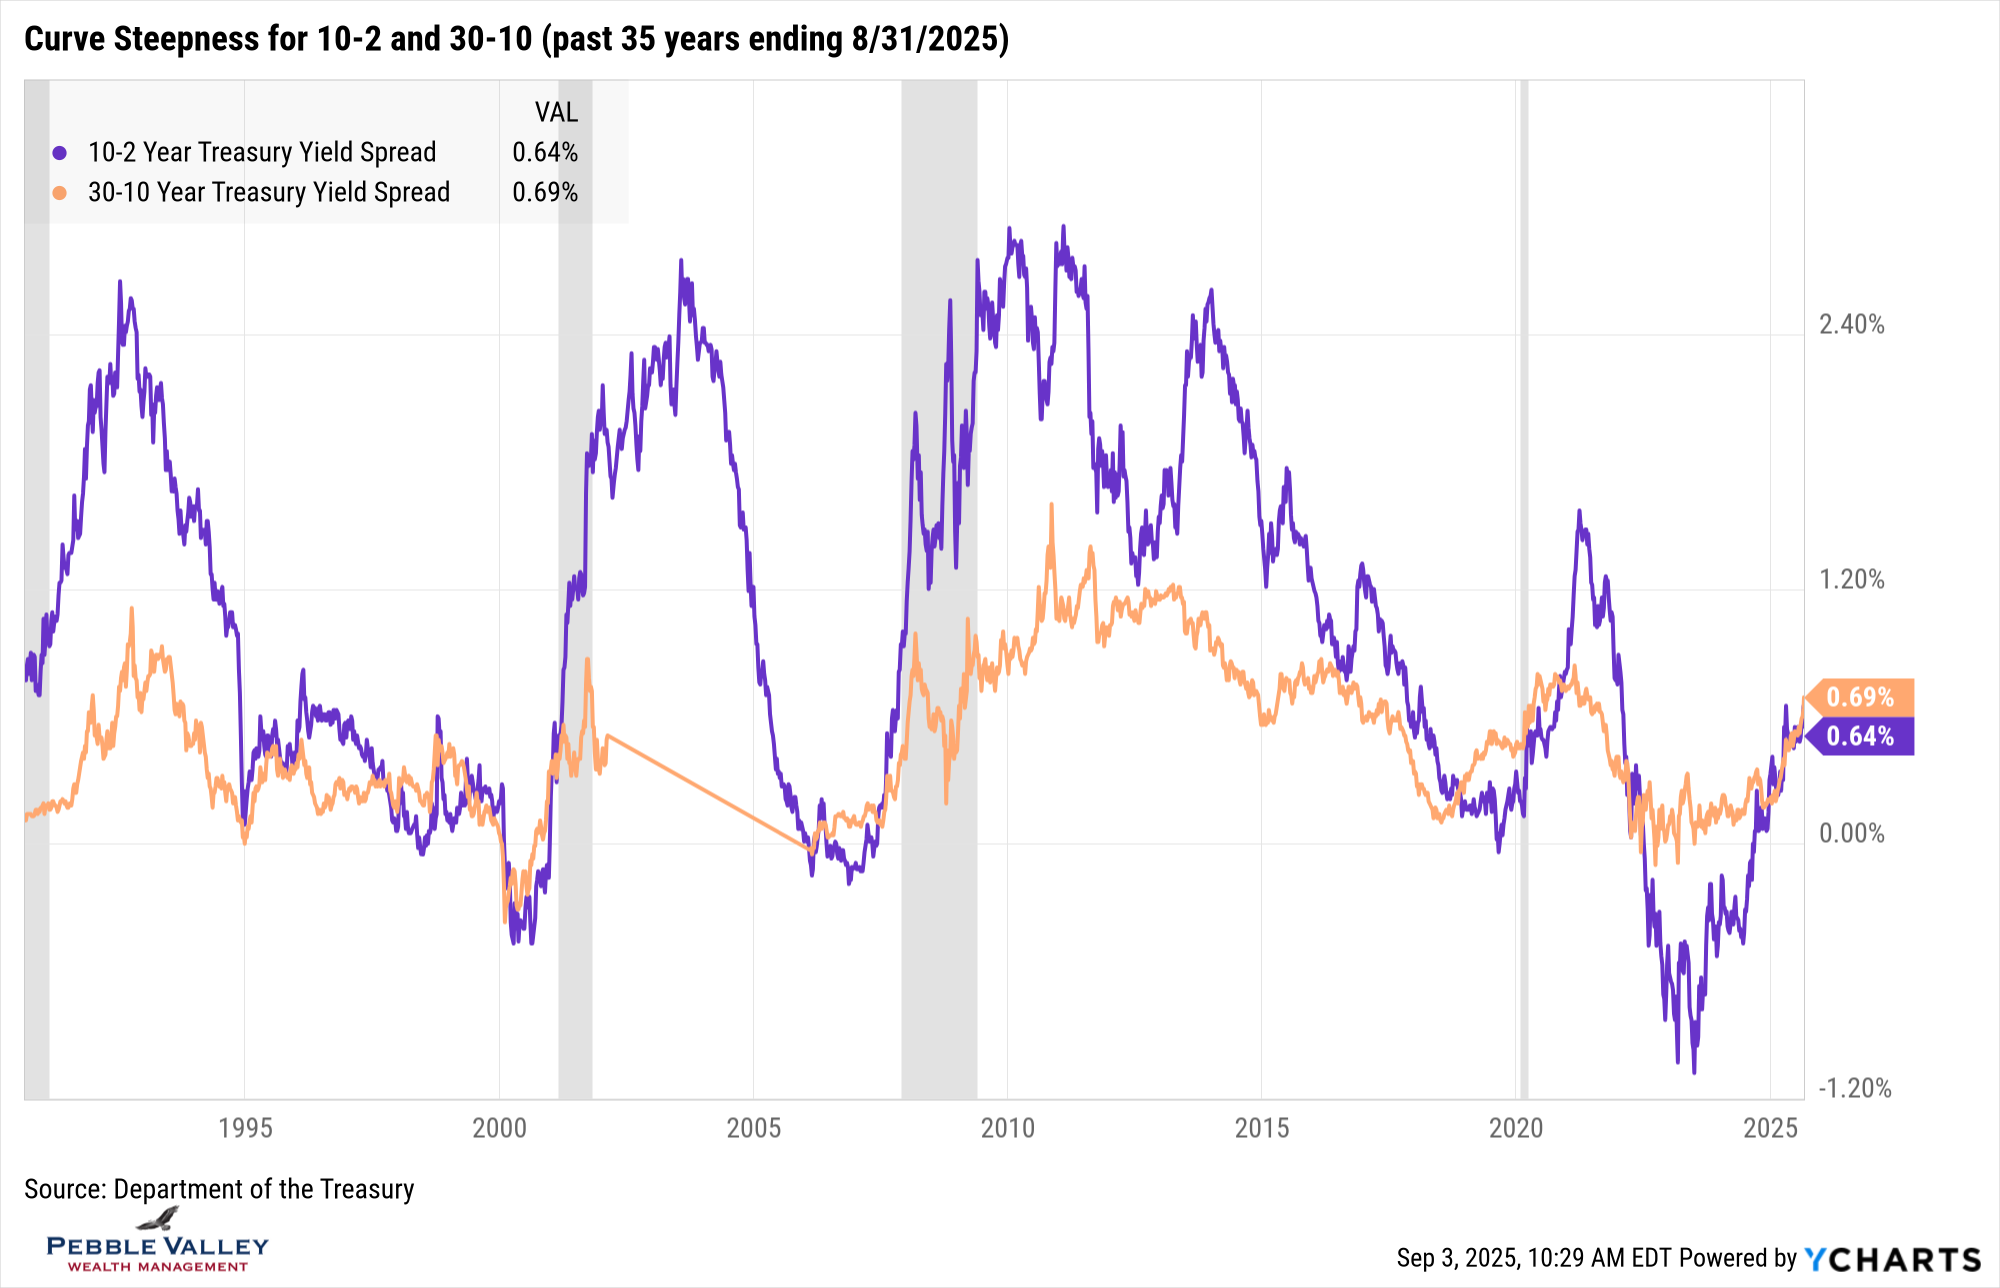
The usual yield graph for the past five years shows yields drifting lower (except the 30-yr), credits spreads getting tighter, and BBB corporate yield (just under 10yr avg maturity) getting very close to 30-year treasury yields as the market prices in credit risk and duration risk differently. Yields fell for the month – a lot for the 2-year, dropping 35bps (though recall was up 22bps in July). 10-year rates also fell, but only by 14bps, leading to what is called a steepening of the curve by 21bps. It is true the Fed will likely cut rates this month (see below) but note the Fed controls the very short-maturity rates. Longer-term rates like 10- and 30-year, while influenced by the short-term rates, also reflect inflation expectations, supply/demand dynamics and relative comparison to global rates. In addition to the usual rate graph, I include a curve steepness graph for 10-yr minus 2-yr and 30-yr minus 10-yr rates going back 35 years. A steeper curve (i.e. long rates noticeably higher than short rates) relative to what we’ve experienced the past few years is quite likely.
The main Fed news this month was the Jackson Hole Economic Symposium in late August. Fed Chair Powell gave a speech and opened the door for a rate hike at the Sep 17th FOMC meeting with the following line: “With policy in restrictive territory, the baseline outlook and the shifting balance of risks may warrant adjusting our policy stance”. Equity markets rallied and rates fell on back of the speech. However, there is the August jobs and CPI report, along with annual labor statistics revisions ahead of us before the meeting. However, in my view it would take pretty solid jobs data to lead the Fed not to cut rates in September given the “policy in restrictive territory” comment. Fed Funds futures agree, with the CME FedWatch tool showing the market is pricing in a 92% chance of a cut (as of 9/3 am).
My special topics this month are a conference and family vacation. I’m off to both and will stop here! Enjoy the blue skies and crisp nights of September.
Have questions? Reach out! We're happy to help.
Posted by Kirk, a fee-only financial advisor who looks at your complete financial picture through the lens of a multi-disciplined, credentialed professional. www.pvwealthmgt.com