

Asset Class Returns - 7/31/2021 plus a few COVID graphs
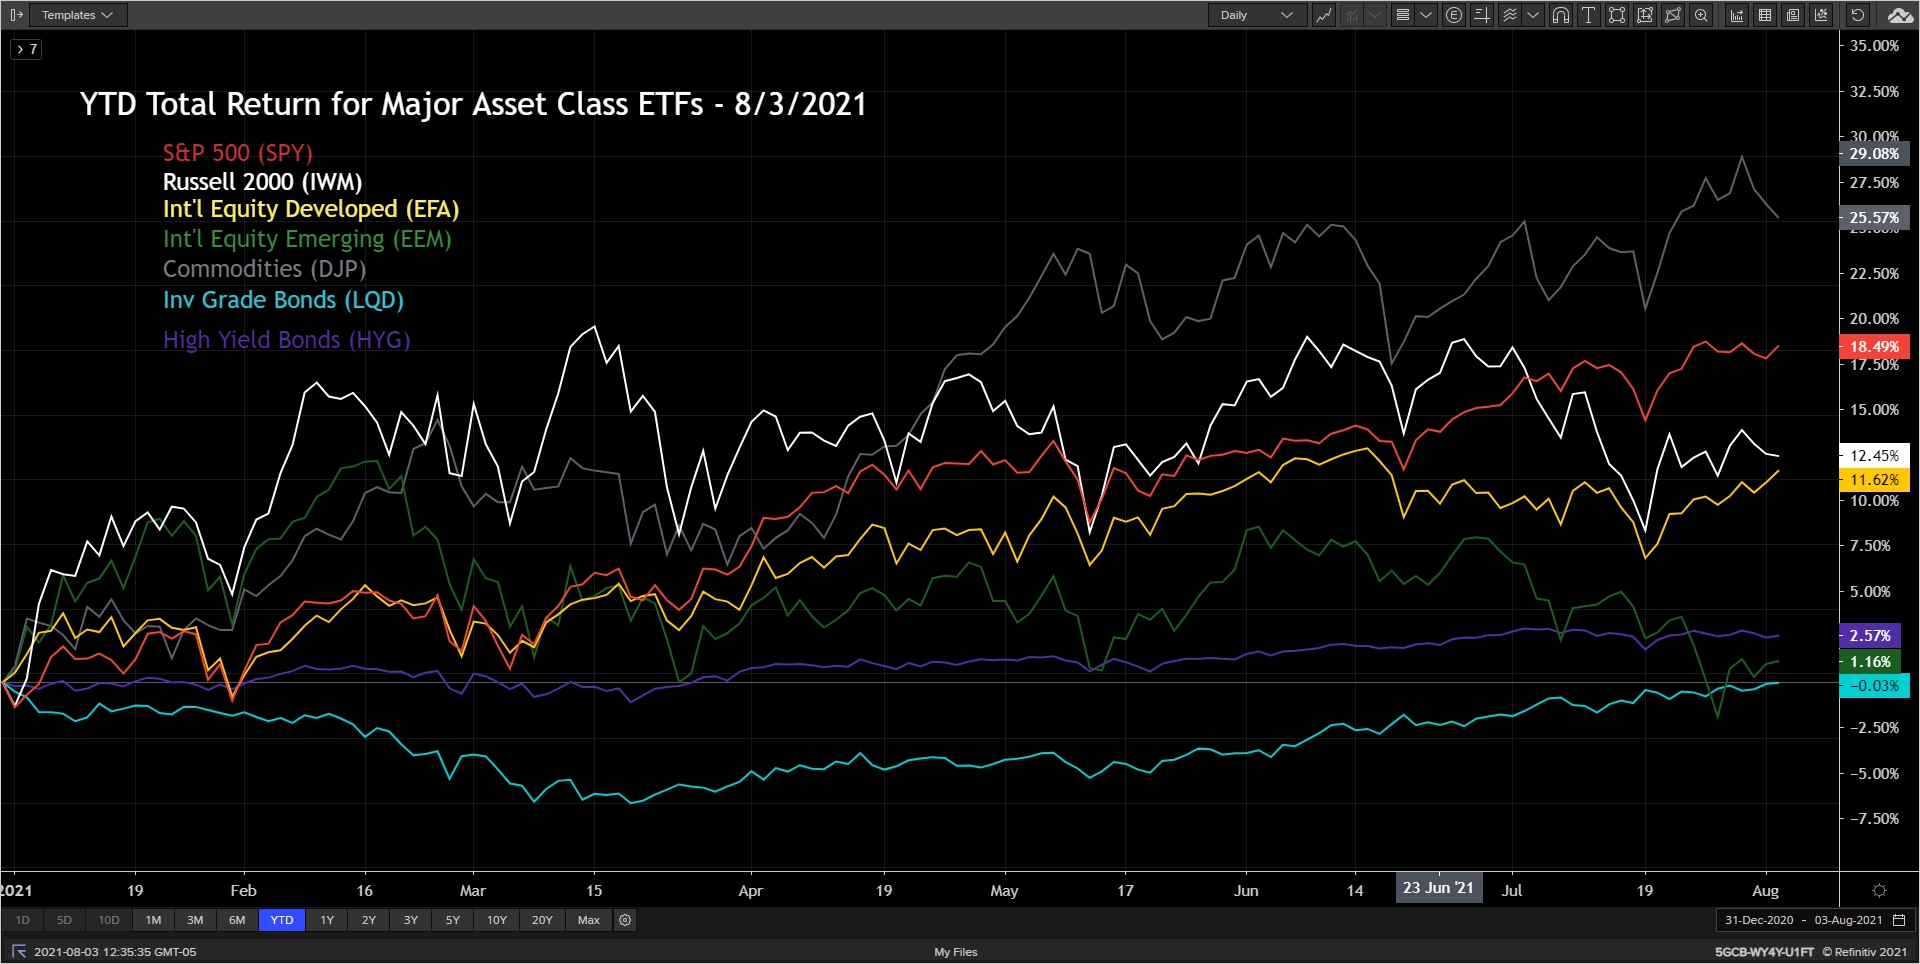
Here is this month’s market summary. Unless noted, the time frame is year-to-date ending 8/3/2021.
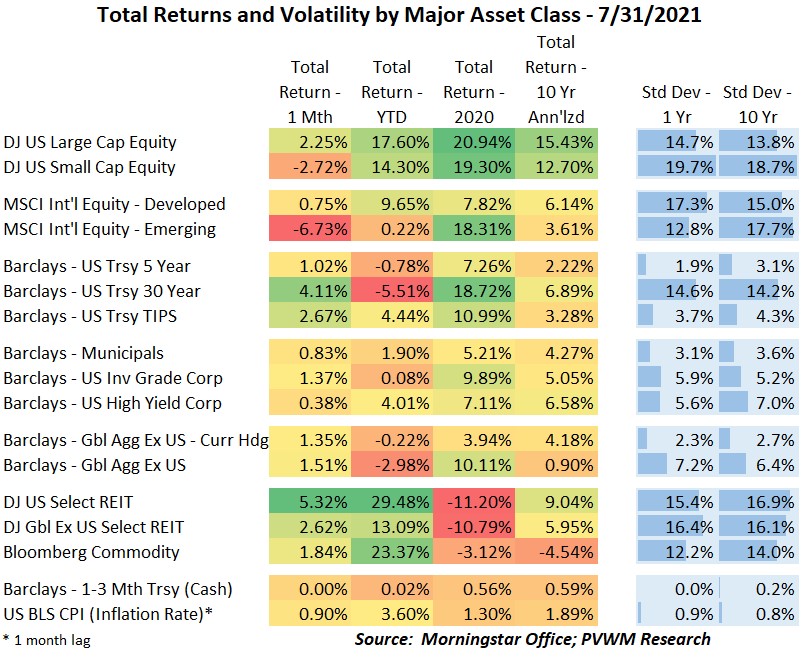
Beginning with the major asset classes, two notable moves are the negative returns during July for US small caps and emerging markets. A big driver of the pullback in emerging was the crackdown in China on how some of the companies in that country operate. Also note that investment-grade bonds are very close to recovering positive ground YTD but fell just short.
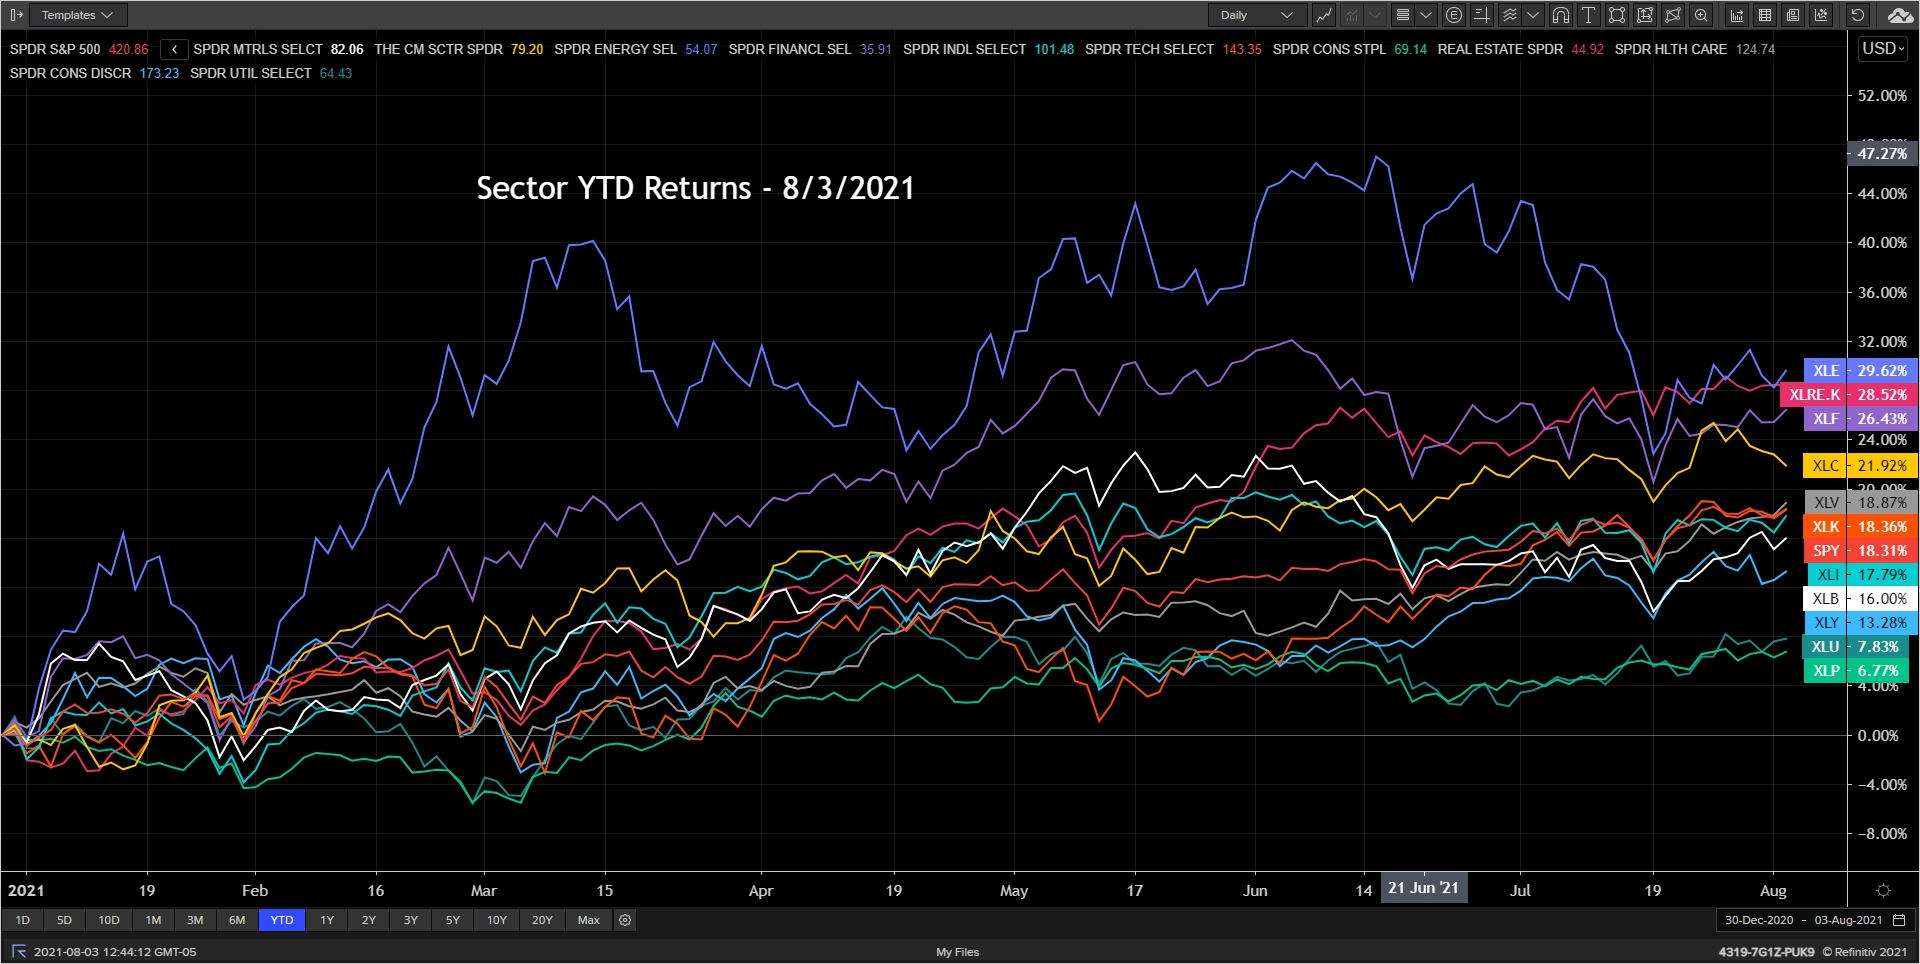
Instead of showing the Growth vs. Value chart (which remains relatively tight on YTD basis) I will show a very busy Sector chart. The Energy sector (XLE) continues to lead YTD but had a very rough July. Financials (XLF) also continue to hold their ground despite the falling rates since the end of March. At the other end of the returns are Utilities (XLU) and Consumer Staples (XLP) which were at the bottom at the end of March with higher rates and still lag the pack after lower rates.
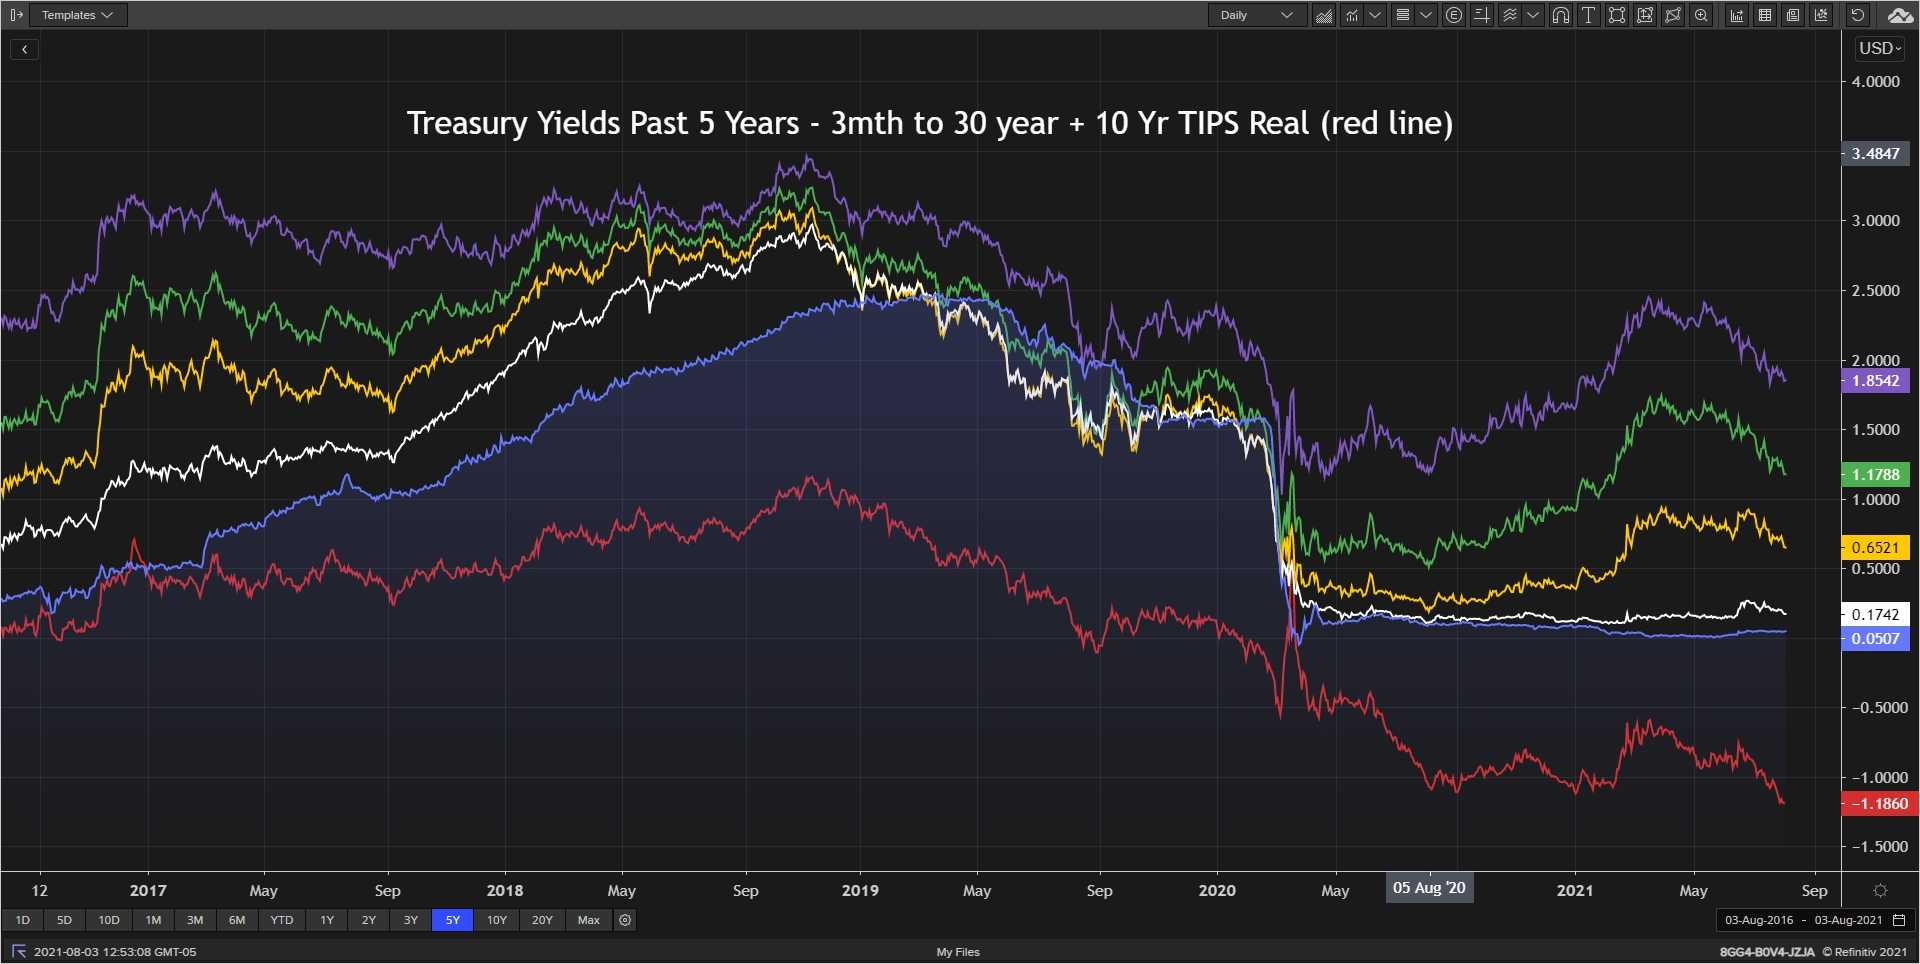
Interest rates continue to drift lower as the Fed continues the $120 billion (with a “b”) a month bond purchase program. The latest Fed meeting indicated they are talking about slowing down their purchases (called ‘tapering’) but many economists expect that to occur in December. However, the upcoming inflation readings and jobs reports may cause the Fed to taper sooner. The jobs report this Friday for the month of July will be the first report to capture the impact of those states that discontinued extended Federal unemployment benefits. The rest of the nation are scheduled to end in early September. And speaking of continued bond purchases by the Fed… note the Real yields from 10-year TIPS (red line in graph). This is the lowest it has been since TIPS being issued in 1997. Ironically the last time it was this low was in late 2012 / early 2013… just before the last time the Fed began to taper. Hmmm…
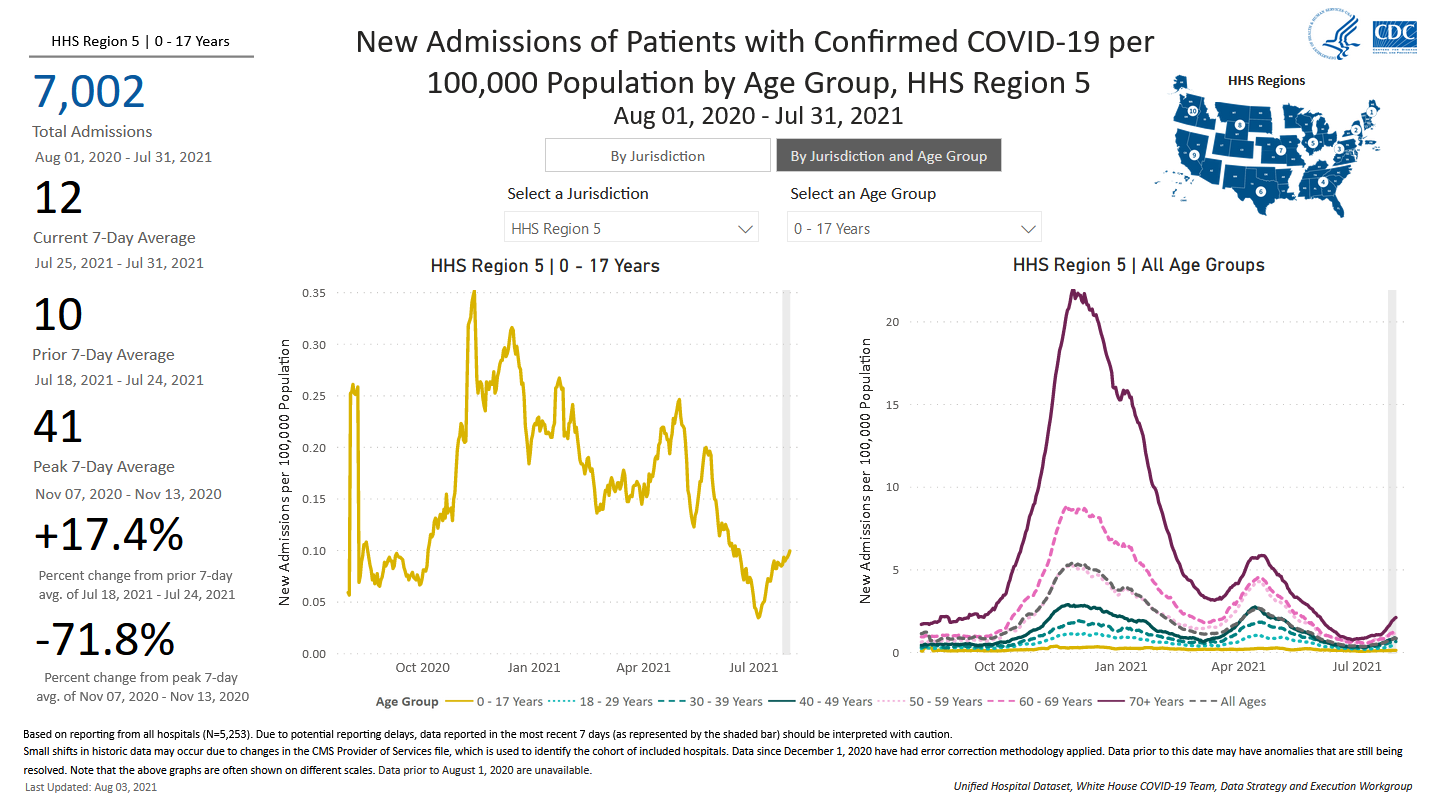
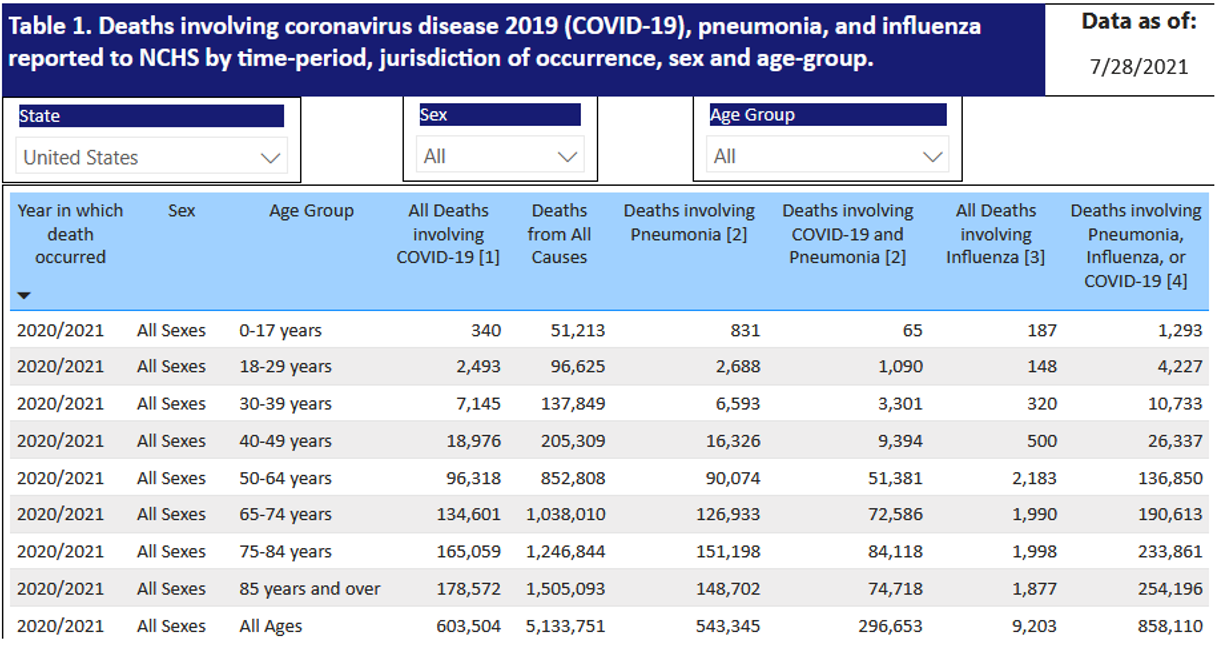
I will end with a brief comment on COVID data. The vaccines are performing very well in terms of reducing severe symptoms and as a result, fewer hospitalizations and deaths. Cases will continue but managing the impact of said cases is what is important. It is also important to keep the numbers in context, not simply the % change of numbers from recent very low levels. And with the rollout of vaccines, hospitalization rates should be the focus over number of cases. Not all regions are experiencing the same hospitalization rates, varying not only by state but by county within. Below is the hospitalization trend for the CDC Jurisdiction that includes Illinois. With school around the corner, I couldn’t help but to grab the 0-17 year-old age group for the left side graph. I had to squint my eyes to see that less than 0.10 per 100,000 (or said a different way, 1 in 1,000,000) is the hospitalization rate. Heck even last fall it was only 0.35 per 100,000 (or 1 in 285,000). The second table shows total deaths by age for different causes including both 2020 and 2021 (through 7/28/21). All deaths are tragic but some squinting is required again to see the number is extremely low for ages 0-17, and the main driver is certainly not COVID. Deaths involving COVID as a % of Deaths from All Causes is less than 0.7% for 0-17 year-olds and 2.6% for 18-29 year-old. The age 64+ bands are around 12-13%. Here is the link to the CDC.GOV website if you want to find your own jurisdiction or state and age-band of choice. Here is the link to the deaths by age table.
School is back – give the kids full freedoms to learn and enjoy. Let’s go!
Posted by Kirk, a fee-only financial advisor who looks at your complete financial picture through the lens of a multi-disciplined, credentialed professional. www.pvwealthmgt.com