

Asset Class Returns - 6/30/2026
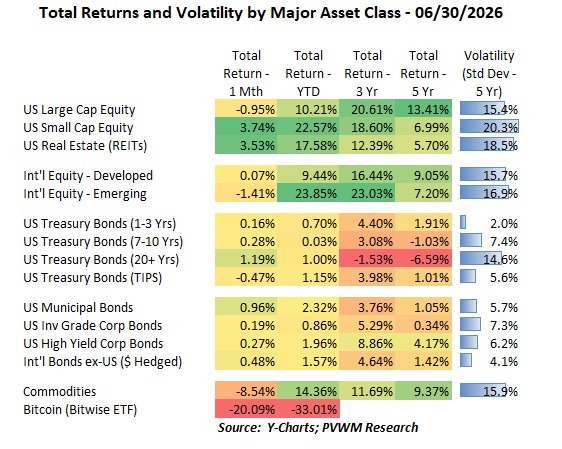
The equity market seemed flat for June but there was plenty of action underneath. The mega cap tech names making up the Mag 7 noticeably underperformed the other 493 broader S&P500 names by about -13% for the month alone! The table above hides the dispersion underneath as the overall US Large Caps were down slightly. Bonds had positive returns except for TIPS as most of the rate rise occurred on the short-end of the curve which has less price sensitivity (lower duration). News out of Iran continues to ebb and flow, with more flowing of oil bringing energy prices down and somewhat stabilizing the market. Other observations.
- US Small Caps had a very solid month despite likely higher rates hitting smaller companies
- Int’l equities were flat to down, partially on the back of a stronger dollar with higher rate expectations
- Only negative Treasury return was from TIPS as real yields moved higher on hotter inflation reading
- Commodities got hit again as lower Energy prices brought this red-hot sector back to earth; Precious Metals also cooled
- Bitcoin got clocked, down -20% for the month alone; stresses in Strategy and their product STRC and continued “crypto winter” overhangs the market; fundamentals remain favorable
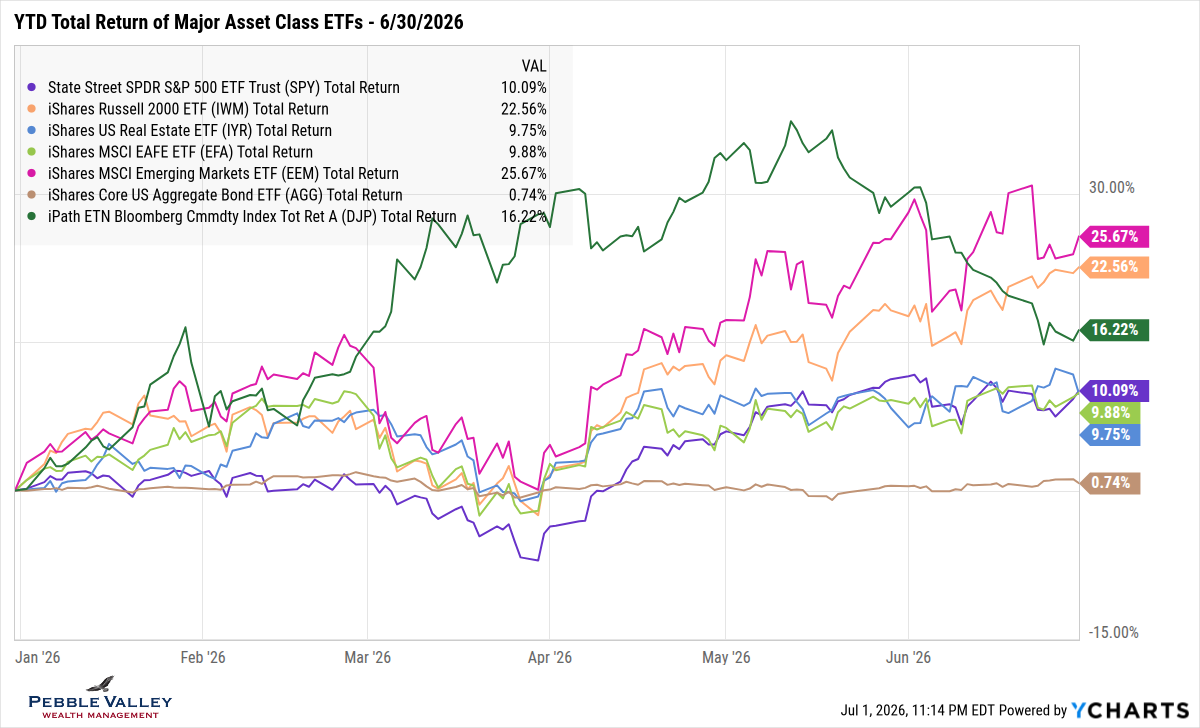
The graph below of YTD total returns of major asset class ETFs captures the shifting markets since late March.
- Commodities (dark green) are now at pre-Iran war levels
- Emerging Markets (magenta) continues to lead, though not without a fair amount of volatility
- US Small Caps (orange) are running away from US Large Caps, seemingly ignoring any headwinds from continued higher rates
- US Large Caps, REITs and Int’l Developed are still hanging out together in a tight range
- Bonds (brown line) keep holding the ship steady.
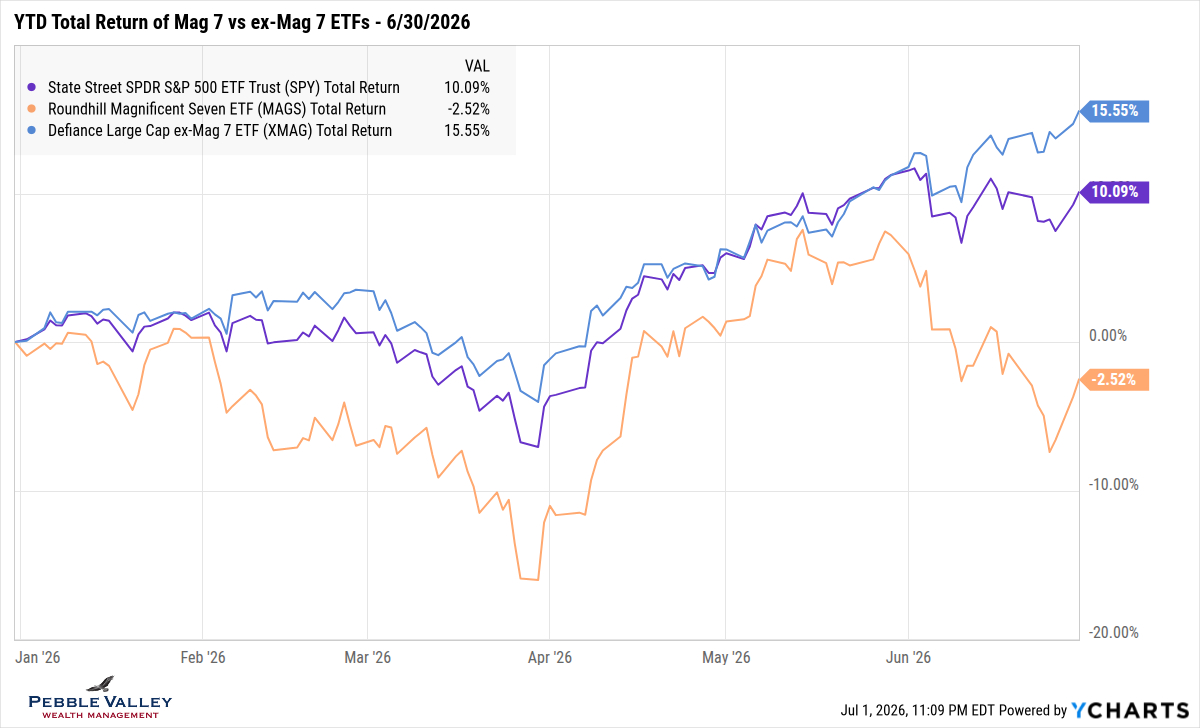
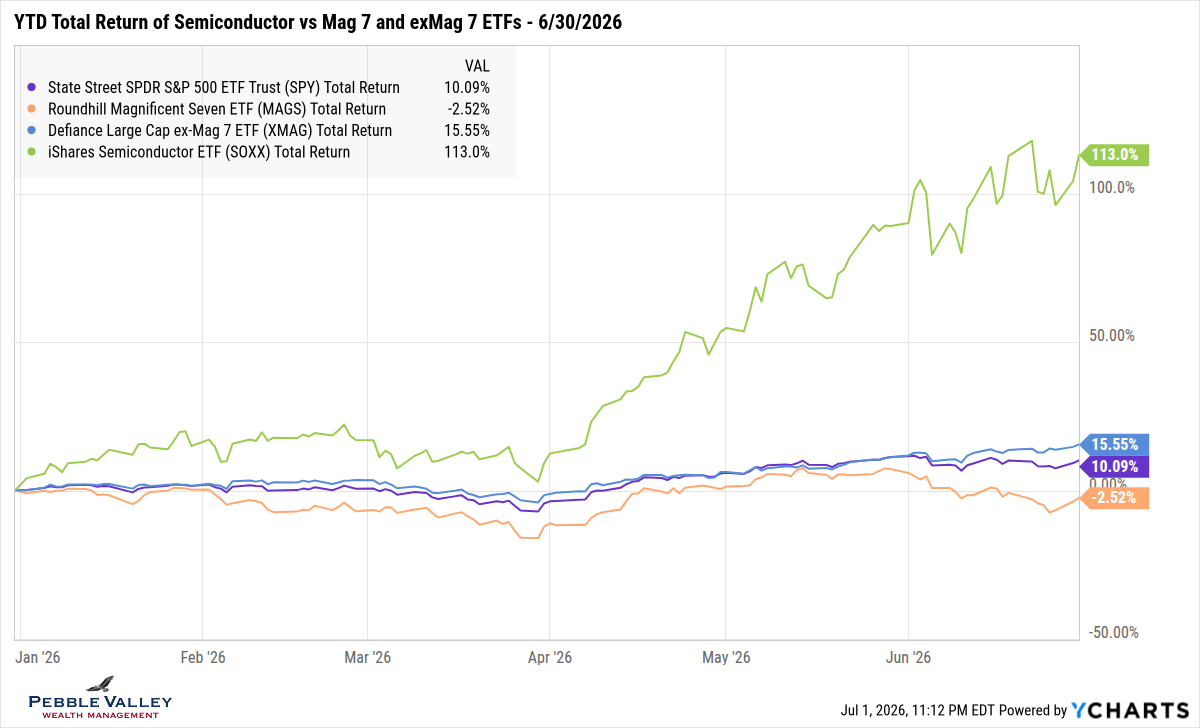
The “focused graph” this month is a reminder of how a once hot theme can cool and another one quickly take its place. The first graph shows the “Magnificent 7” ETF compared to “Ex-Mag 7” and the overall S&P 500. Part of the ex-Mag 7 are Industrial names picking up efficiencies from AI but there is also an explosive growth in semiconductors. The second graph adds a Semiconductor ETF which saw monster gains since early April as the “AI focused trade” shifts to the chips. Because after all - “…tech is… tech is for everything.” - Woody
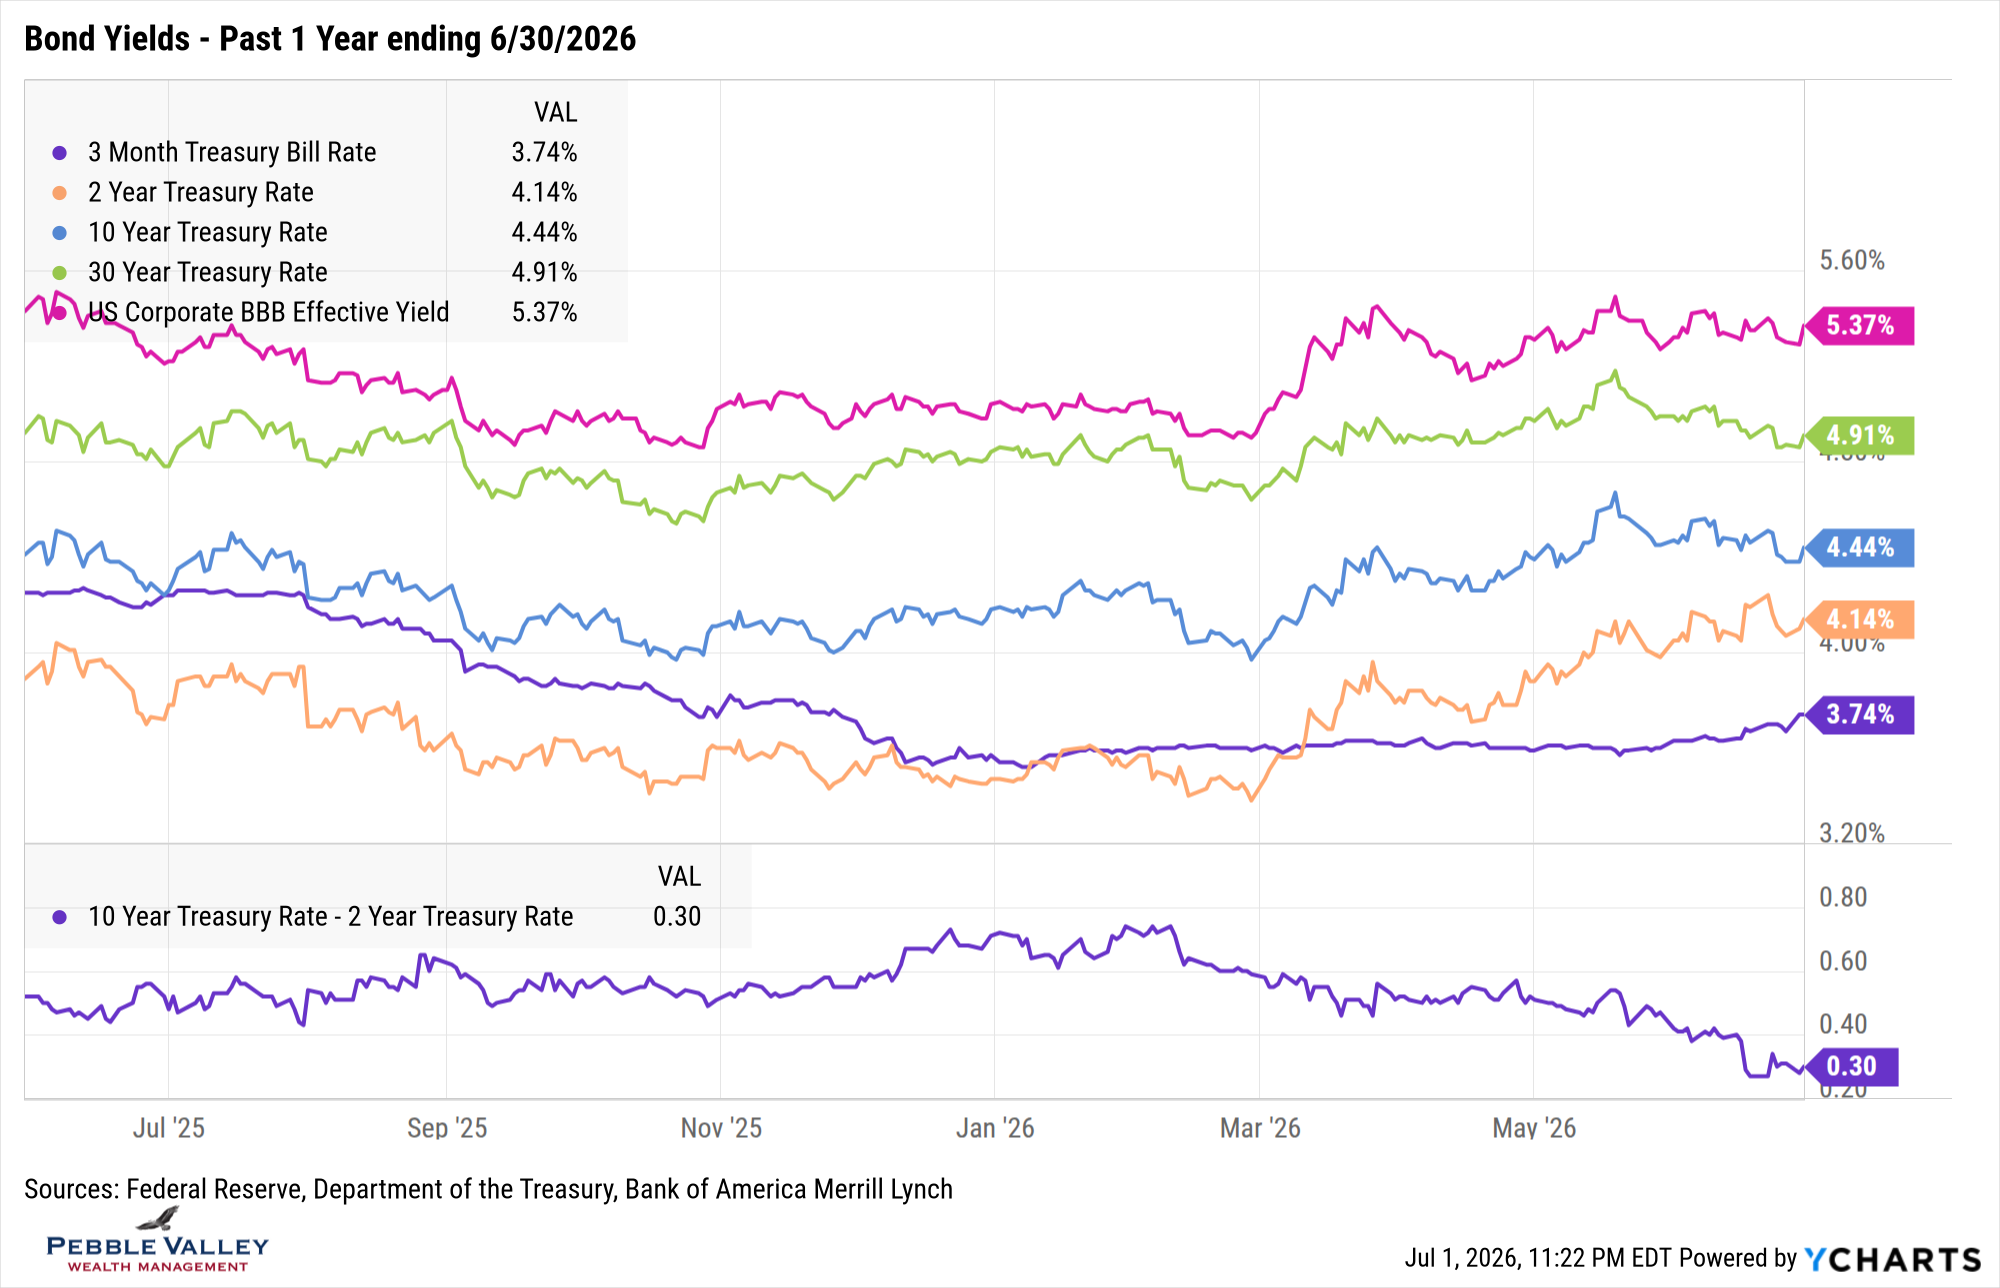
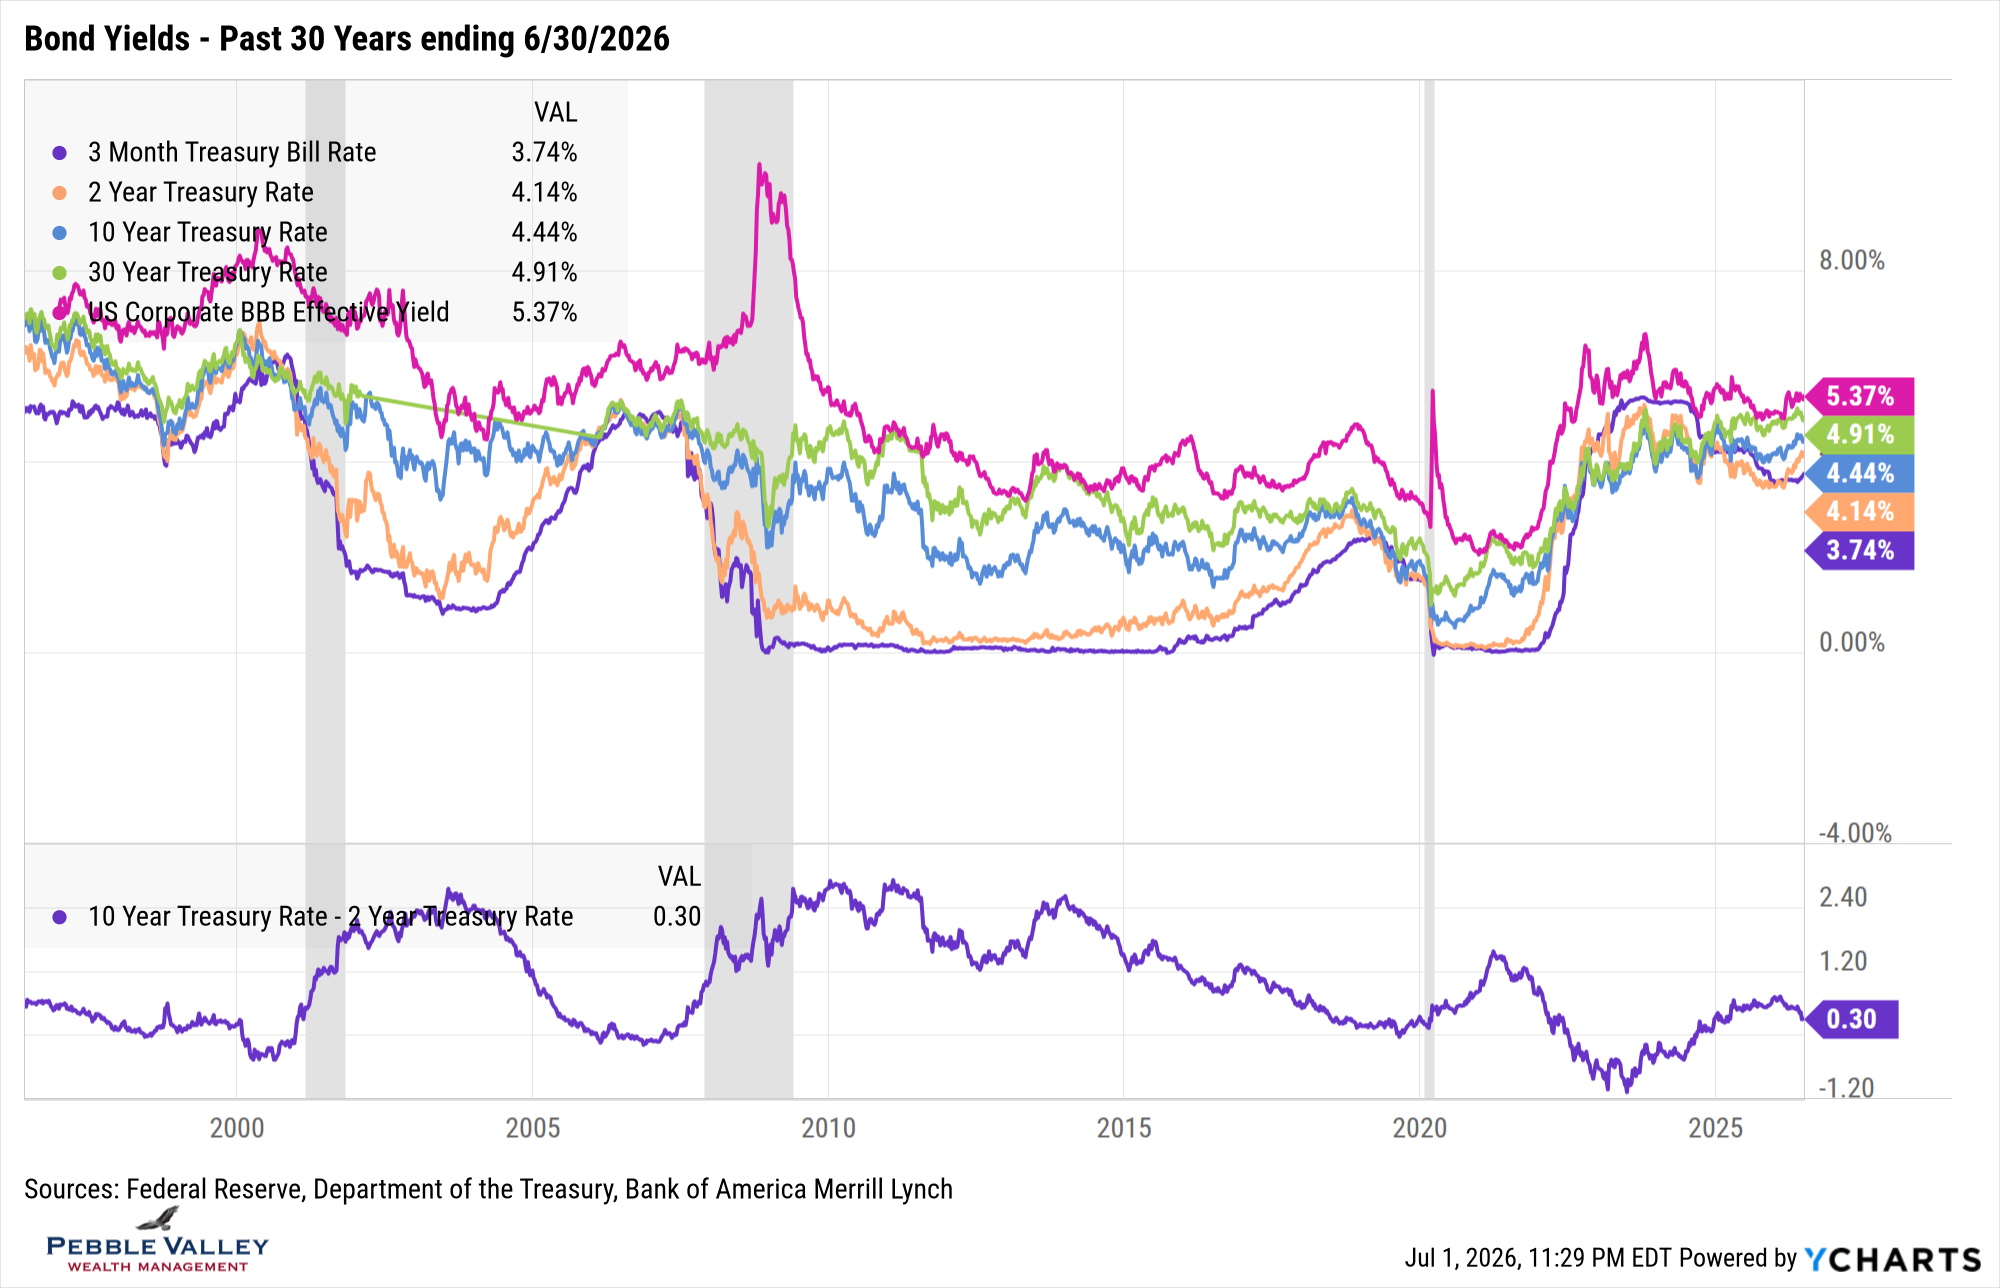
Next are the bond yield graphs over the past one- and thirty-year time frame. Here is what caught my attention this month:
- Jump down to the bottom and notice the 2s/10s curve flatten
- Now go back up and notice the 2-yr yield was close to 4.25% during June
- The 10- and 30yr rates are holding on to their 4.50% and 5.00% respectively
- 3-Mth T-Bill rates are starting to drift up as the market prices in potential rate hikes
- The 30-year time frame chart provides nice context for the 2s/10s curve shape.
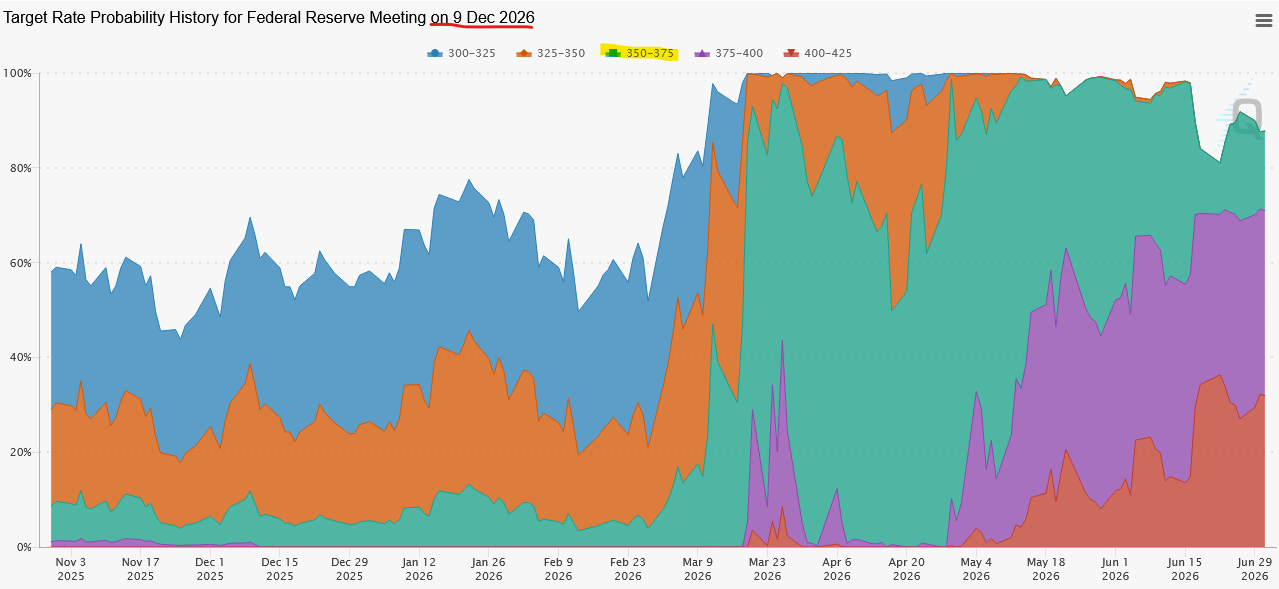
The first FOMC meeting with new Chair Kevin Warsh concluded June 17. In summary, the tone was more hawkish than the market expected (lean toward higher, not lower rates), the Fed statement was much shorter (“just the facts, ma’am”), forward guidance was removed (yes, dot plot remained but Warsh didn’t provide and I fully expect going away), and five areas of Fed activity will be reviewed with recommended changes by end of 2026 – communications, balance-sheet policy, data sources, productivity impact on jobs, and inflation framework. Oh yeah, the FOMC also released their Summary of Economic Projections which showed quite the jump in inflation expectations – PCE inflation by 12/31/2026 revised up from 2.7% in March to 3.6%! But Chair Warsh made it very clear in the press conference that bringing inflation down to the 2% target will be a priority. From my perspective, I believe this inflation fight will also be achieved using the Fed’s balance sheet and not exclusively by raising short-term rates. Short-term funding liquidity is managed closely by the Fed. There are plenty of newly issued TBills that can be purchased while longer maturity bonds roll off – and later maybe selling based on task force views. The market definitely is expecting the Fed to not only pause, but HIKE short-term rates before year-end. The graph below (Source: CME FedWatch, July 2, 2026 am) shows the changing probability of market expectations for Fed Funds by Dec 9, 2026 (currently 3.50 – 3.75%). In early ’26 the market priced in two rate cuts (blue range). After the Iran War started in late February and oil prices spiked, pricing for cuts was removed (green range). As inflation readings remained high, the possibility of one (purple) or two (red) rate hikes started to be priced in. The last blip higher in the red range occurred after the June 17 FOMC meeting.
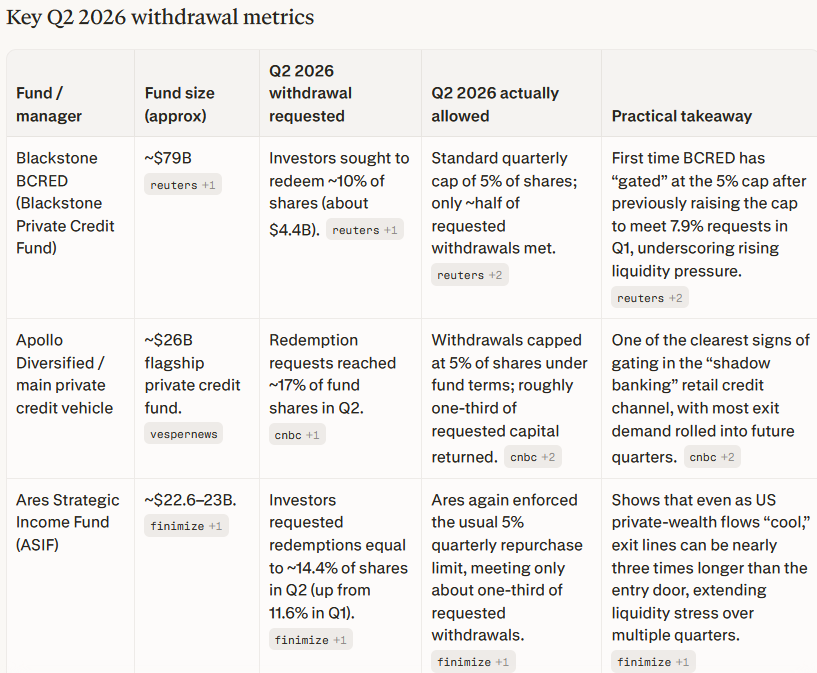
My special topics this month is the second quarter withdrawal requests for Private Credit. The market likes to focus on one major story at a time, and after Q1 withdrawals this story went silent. As Q2 requests started in June the similar pattern emerged – larger withdrawal request were being capped at typical 5% of total fund. Blackstone’s BCRED did allow more than 5% in Q1 but capped at 5% this time. Below is a summary of three major funds (Source: Perplexity Pro). Other notable funds were Cliffwater Lending Fund which received 17% withdrawal request and Morgan Stanley North Haven PIF received 11.6% request. Now go back up a paragraph and ask yourself if you think “higher rates for longer” will help or hurt this issue in Q3 and beyond – but not to infinity!
Happy Birthday USA! The year is only half over but our country is celebrating an impressive quarter of a millennium. Here’s to another 250 years – provided we continue to adhere to the founding principles.
Have questions? Reach out! We're happy to help.
Posted by Kirk, a fee-only financial advisor who looks at your complete financial picture through the lens of a multi-disciplined, credentialed professional. www.pvwealthmgt.com