Asset Class Returns - 6/30/2025
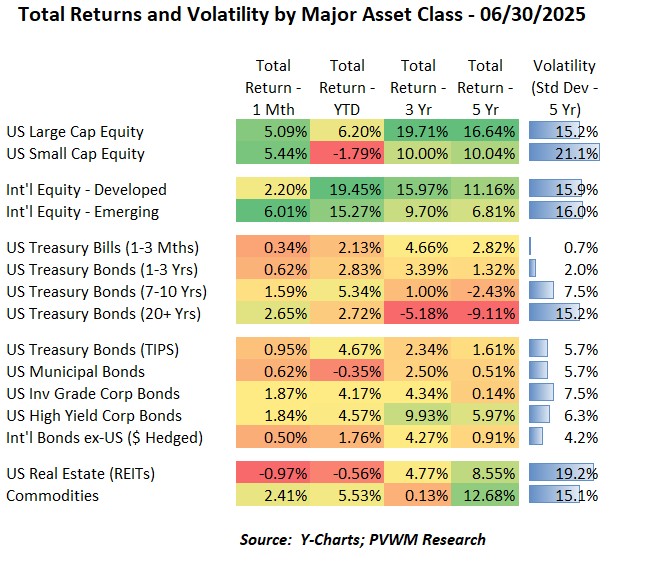
The 1 month returns on the table above looks very similar to last month, including magnitude. The main differences are the treasury returns were all positive this month due to falling rates and REITs were down this month while commodities were up. The bombing of Iran’s nuclear facilities had little impact on the markets by the following day, though tensions remain. There was a short-lived trading dispute with Canada announced on a Friday but resolved by that Sunday. Tariff negotiations continue but recall the last day of the 90-day tariff pause is end of day July 8th. This may be extended and negotiation details will likely remain, but something to keep in mind as the market continues to move strongly higher despite these issues. A few things to note in the table above:
- International equities are the monster performer so far in 2025, with YTD returns approaching 20% for only these first six months
- US Small Cap equities kept up with Large Caps this month, though the YTD returns remain negative
- Bonds had a strong month; most bond asset classes have solid YTD total returns - helped by six months of coupon
- Two laggards in bonds – Municipals and dollar-hedged international bonds; Muni’s remain negative total return on YTD basis, even with six months of coupons.
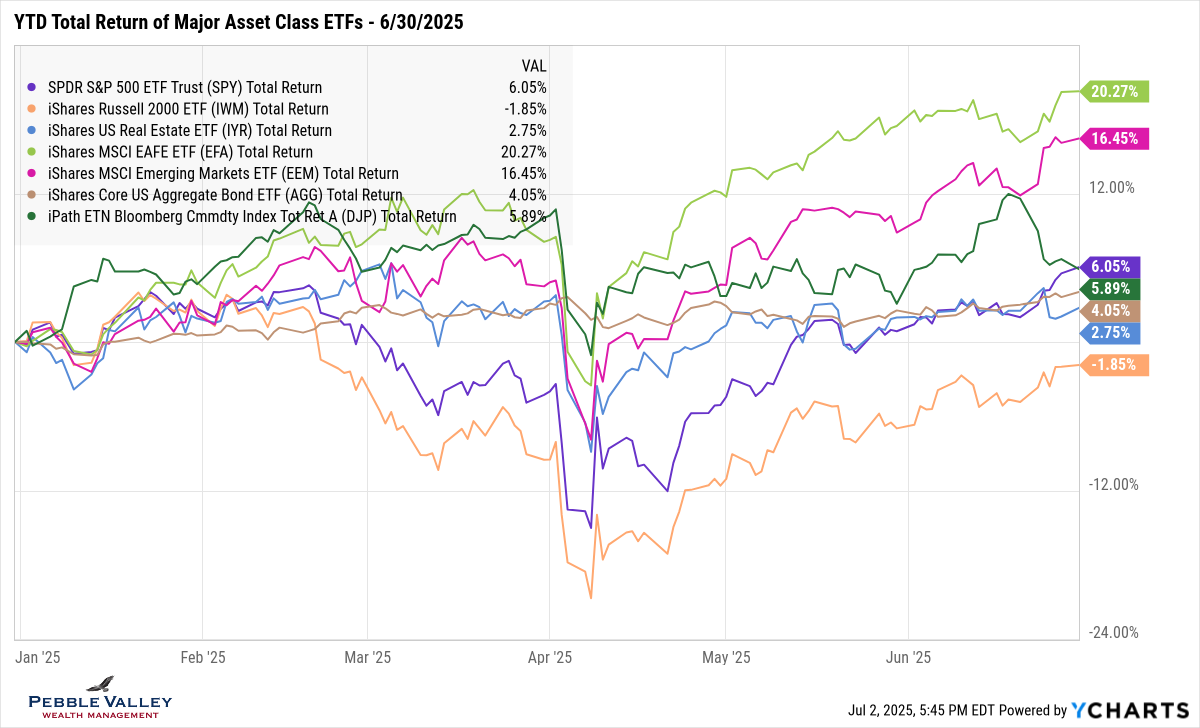
The graph below shows YTD total returns of major asset class ETFs. The top two performing asset classes - International Developed and Emerging – continue to run away from the other asset classes. Commodities (green line) started to make a run mid-month but reversed, though still up for the month. Small caps remain in negative territory YTD though showing signs of recent strength.
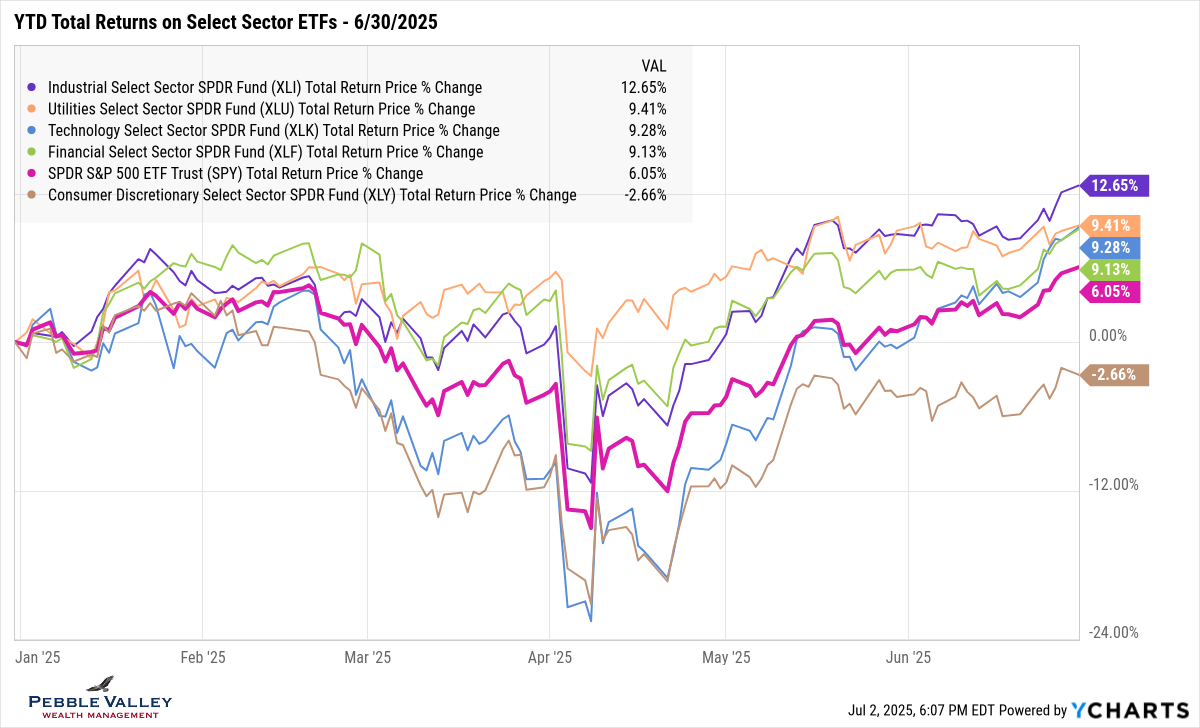
I added a sector chart this month. After the strong recovery in Technology since the April lows I was surprised Tech wasn’t the leader in YTD returns. Because the sector had such a large drawdown, it is taking longer to recover from the lows. I show the other sector that fell hard – Consumer Discretionary – though that has not faired as well. I also kept a few of the top YTD returns, coming from sectors not normally leading the pack – Industrials, Utilities and Financials.
This also serves as a good reminder that stocks must gain more than they lose on a percentage basis to get back to starting levels.
- If a security falls 10%, it must gain 11% to break-even
- … 25% fall needs 33% gain
- … 40% fall needs 67% gain
- … and yes, a 50% fall must recover by 100% to get back where started
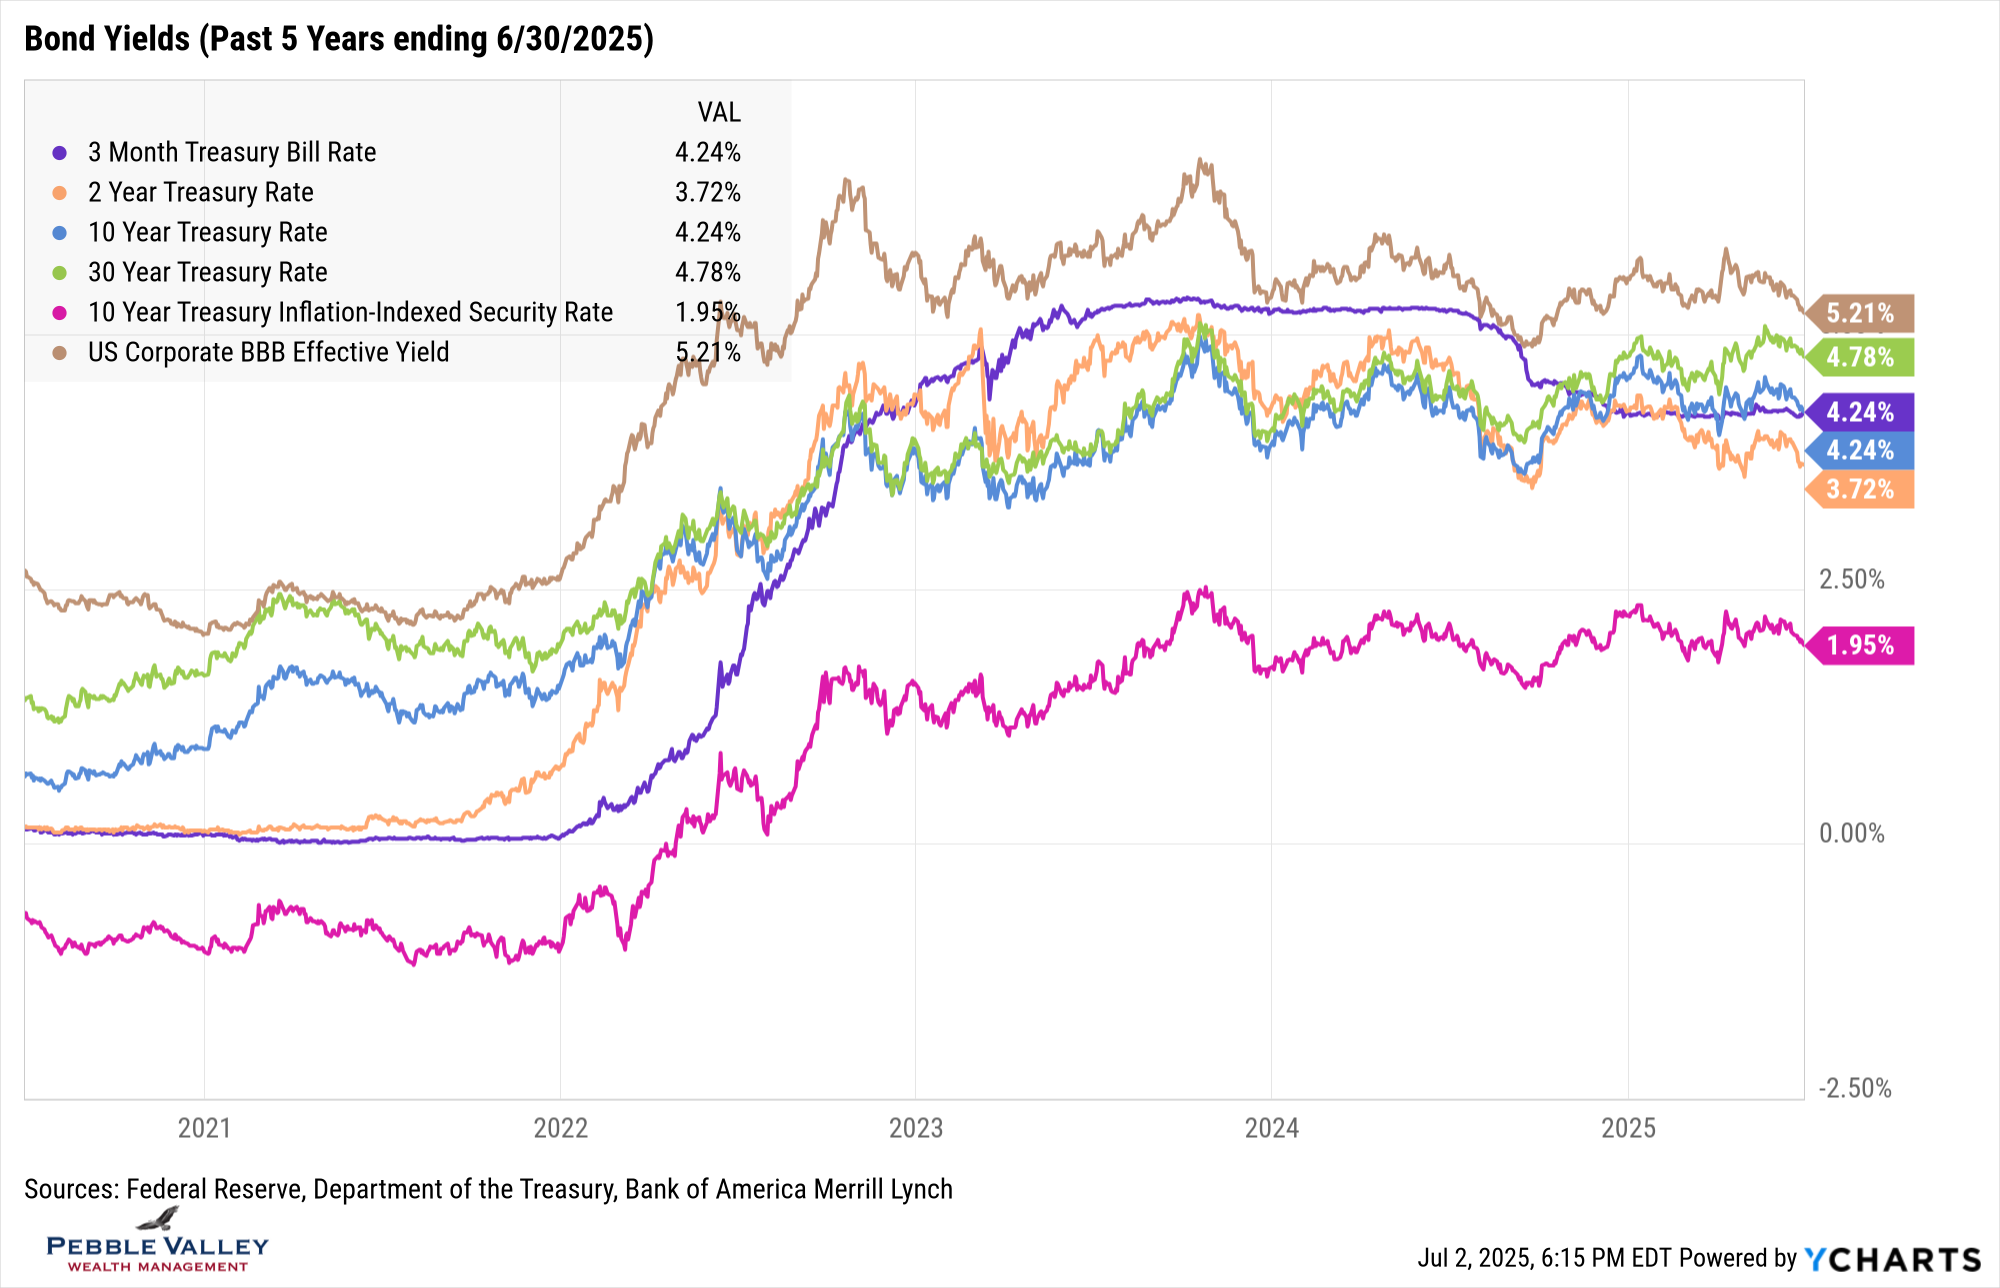
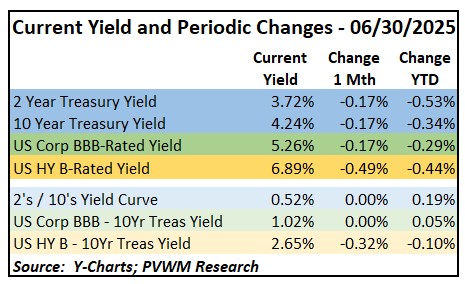
Looking at the bond yield graph and rate change table below, you can see that treasury rates fell evenly across the curve (different bond maturities). As a brief duration lesson (I can’t help myself) refer back to the table at top in the Treasury Bond section and notice the monthly total returns vary by maturity. Back down here, you can see the recent trend lower in rates, especially the 2-year treasury rate (orange line) as the market slowly begins to price back in future Fed rates cuts. Also note that while BBB-rated credit spreads didn’t tighten this month, the B-rated spreads moved tighter by 32bps. The extra yield being paid to take on lower quality bonds continues to shrink.
The FOMC meeting concluded on June 18th. The latest Summary of Economic Projections showed lower expected growth and higher inflation relative to the last estimates from March. The unemployment rate was expected to rise slightly. And the median estimate of the much touted “dot plot” – where Fed members expect to see the Fed Funds rate at the end of the next three years – was unchanged at two more cuts for 2025, but was lowered to just one additional cut in 2026 down from two. 2027 was projected to see one additional cut, the same as the last estimate. By 12/31/2027, median Fed Funds rate now stands at 3.4%. That estimate keeps drifting higher. What does the Fed Funds futures market say? Not expecting a cut at the July meeting (though a possibility) but very likely – 70% implied – for September per the CME FedWatch Tool.
My special topic this month is making you aware of two interesting trends. I won’t provide a detailed discussion, just making you aware. Monitor if interested - or ask us questions.
- Private Markets: I was at the Morningstar Investment Conference last week and this was definitely a major theme. The two primary types are Private Equity and Private Credit. Historically it was difficult to access these markets unless an institutional investor. Recently these markets are offered through funds similar to mutual funds – called “interval funds” - but with less liquidity (can’t get your money when want) and higher fees and complexity. The Private Market providers are also partnering with well-known mutual fund companies to offer a blended fund, presumably with better liquidity, as discussed in this recent WSJ article. These Private Market holdings are even being offered in some 401k plans as part of the target date funds, not as stand-alone investment choice.
Tokenization of Real-World Assets: This is a bit wonky and relies upon blockchain technology in the crypto world. The reason I mention here is because Robinhood (technology leading trading and clearing firm) recently announced a major product push into crypto services, including the tokenization and thus ability to trade two major private firms – SpaceX and OpenAI – later this summer for European users only (it’s a “regulatory thing” … for now) as discussed in this recent WSJ article. What is tokenization? Here is a 2-minute video from Bitwise Investments. If you want to go a bit deeper, here is a nice primer from State Street.
The year is half-over. That means you have another half of the year to live to the fullest! Happy Independence Day.
Have questions? Reach out! We're happy to help.
Posted by Kirk, a fee-only financial advisor who looks at your complete financial picture through the lens of a multi-disciplined, credentialed professional. www.pvwealthmgt.com


