

Asset Class Returns - 6/30/2023
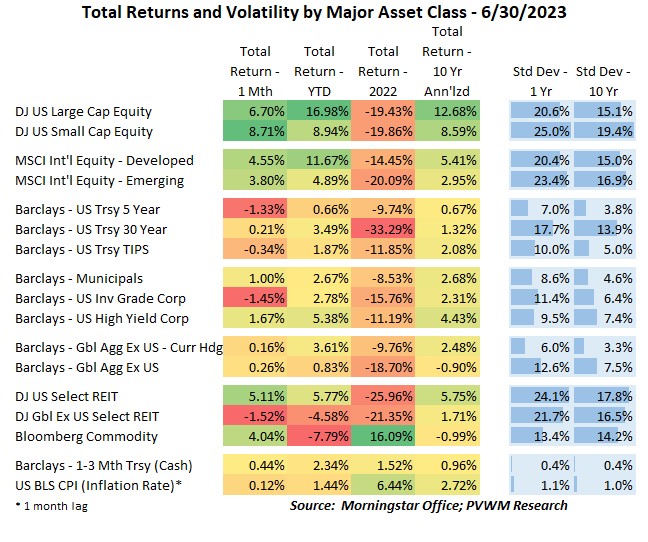
The “1 Month” column in the table above is usually my focus for the blog post – and there are some solid green boxes we will talk about. But look at that Year-to-Date (YTD) column! We are only half-way through the year and already there are some impressive gains for equities – at least at the index level. Even US REITS are up close to 6% in the face of major headwinds in the commercial real estate sector (int’l REITs not so much). Yes, if you glance one column to the right you are reminded of the 2022 carnage (commodities and cash were only “+”s) and perhaps a rebound was due. But the potential recession concerns are still with us and the Fed, after not raising rates in June (was it a pause or a skip?), has told us they are not done raising rates. … yeah… but look at those YTD returns you say!
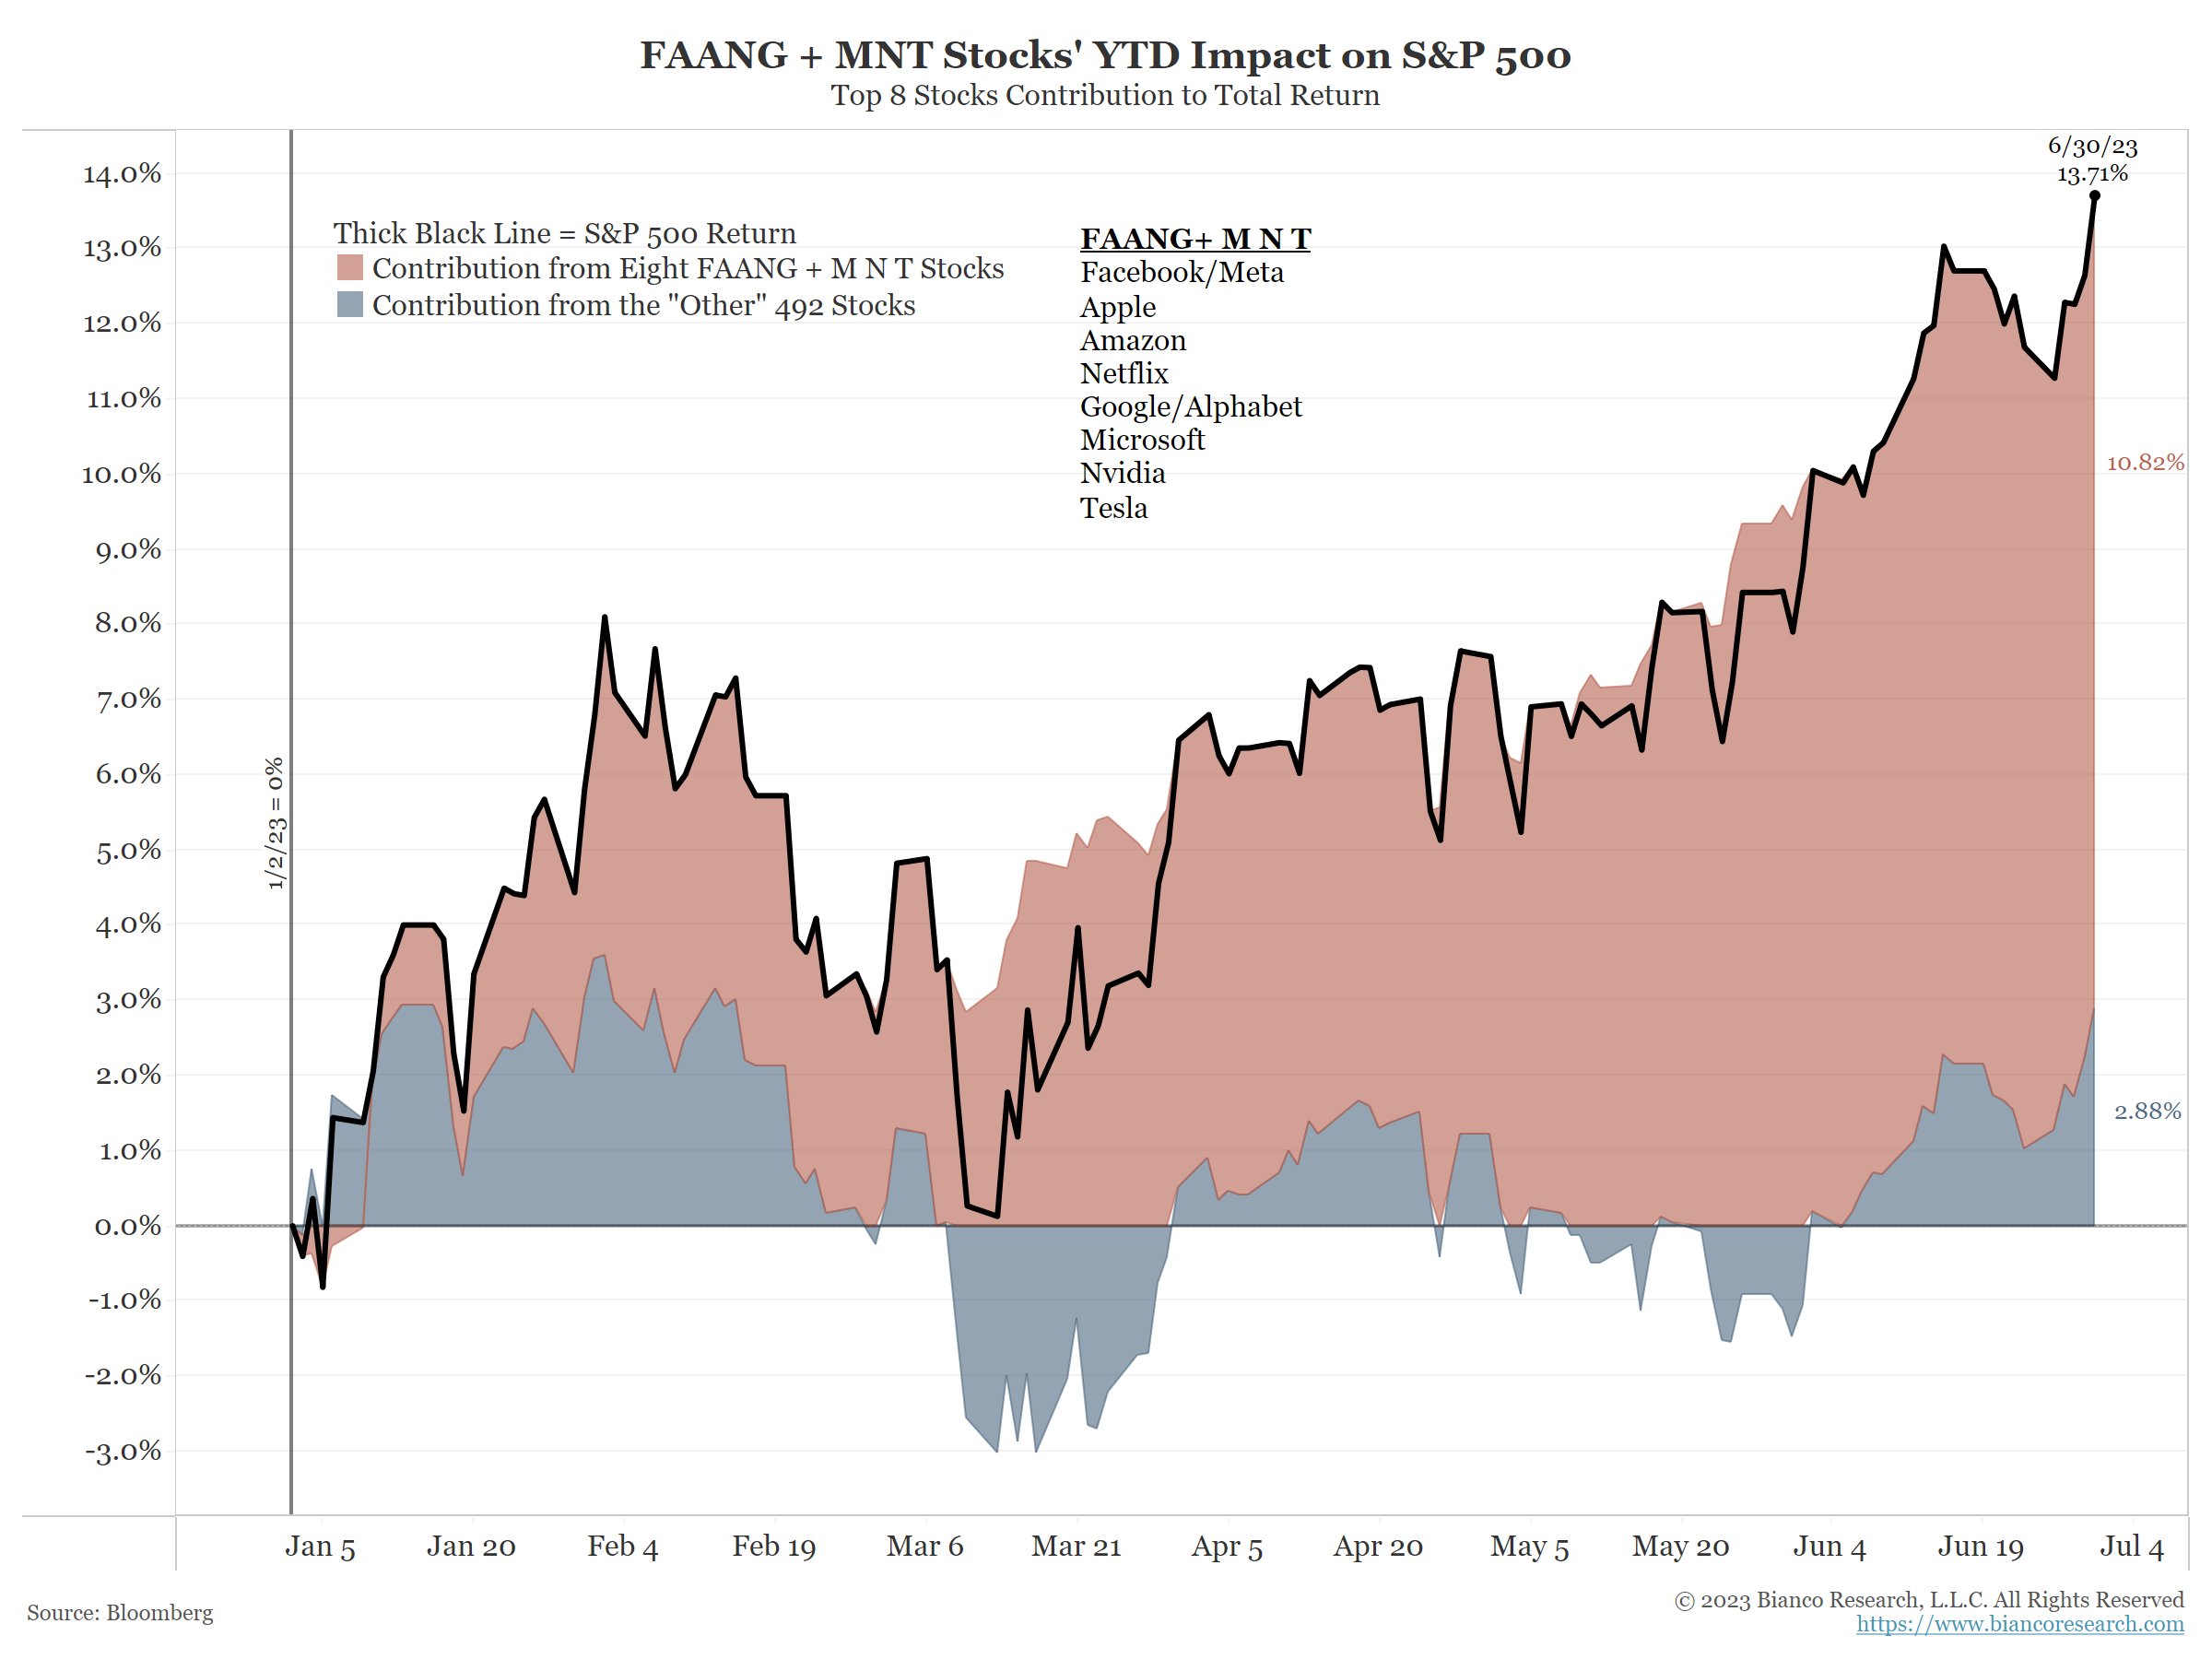
Last month I showed a price return graph of four ETFs that capture major indices of the US equity market – Dow Jones Ind Avg, S&P500, NASDAQ and Russell 2000. If I ran it again this month it would look the same except YTD returns would be about 6% higher for NASDAQ, 1% higher for DJIA and the others in between. This month I include a graph that captures the dominance just eight stocks had on the S&P500 return for the first half of year (looks like price return with 1/2/23 start date – Source: Bianco Research). Another way of summarizing the graph is with the statement – “the ‘S&P 492’ is only up +2.9% for the first half”.
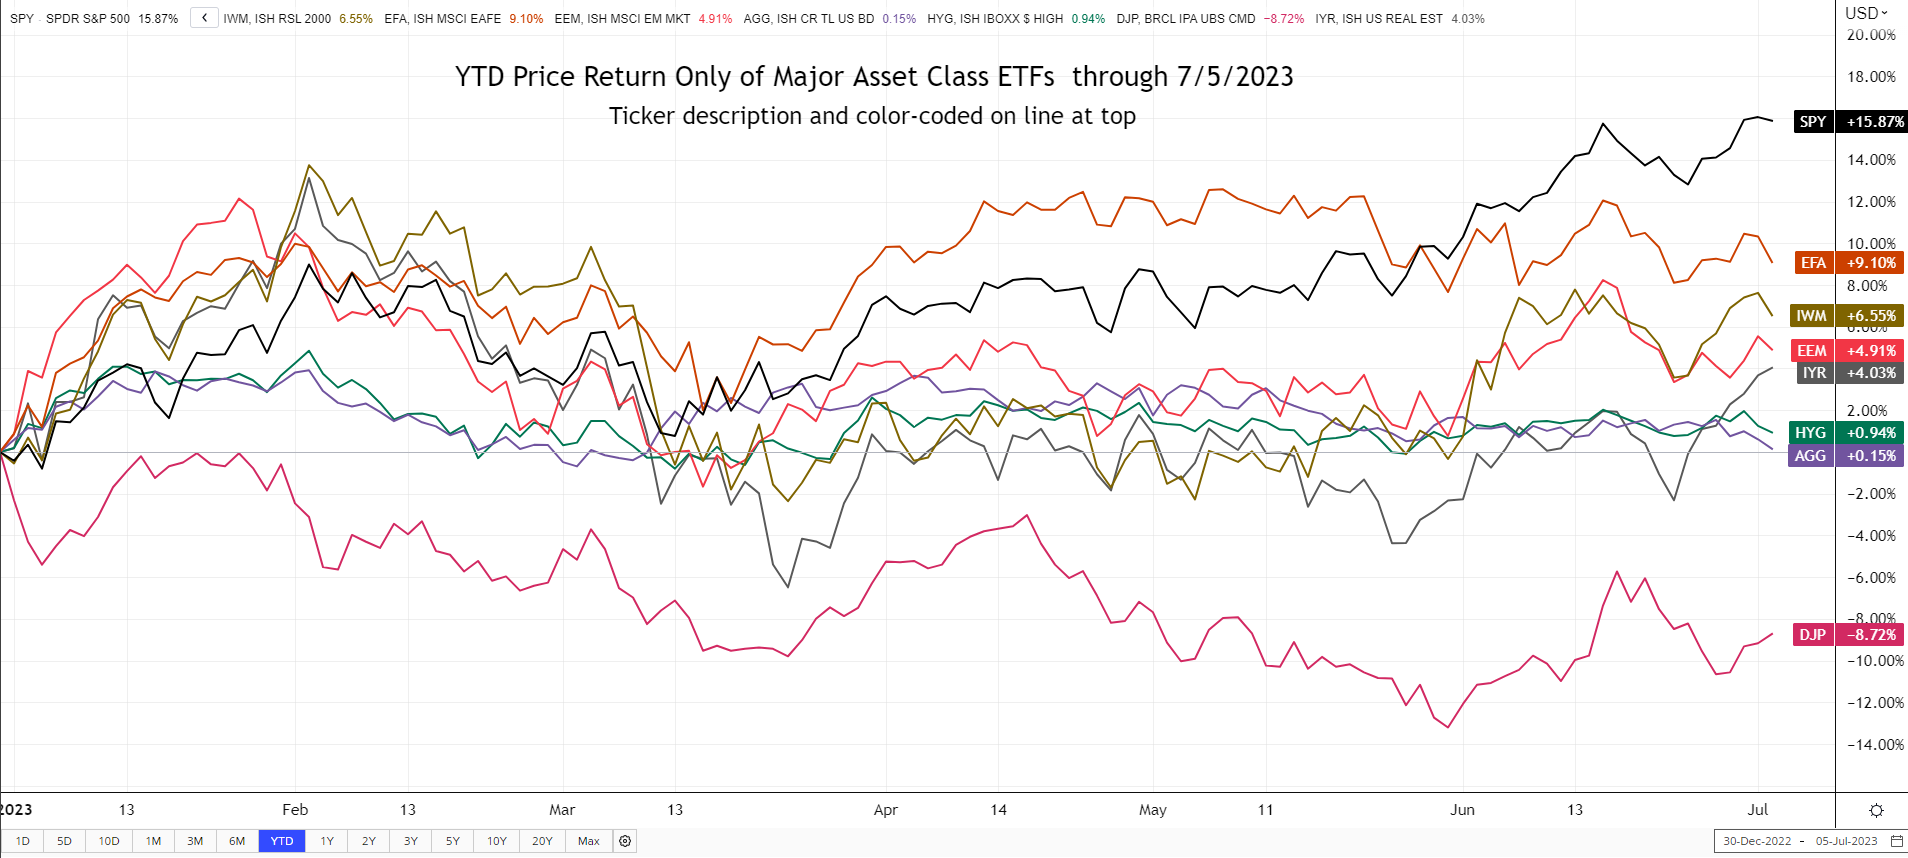
The graph below shows the YTD price-return only of major asset class ETFs through 7/5/2023. The S&P500 at the top of the pack is influenced by the handful of names mentioned above while the Russell 2000 (IWM) has been weighed down until this past month by the heavier financial sector weighting. International developed equities were leading the pack in early April following the banking issues that led to potential rate cuts by the Fed and a weaker US dollar – a tailwind for returns when converted to US terms. That asset class has been relatively flat since then. In the ‘surprising’ column is commodities still down close to 9%; in the ‘interesting’ column is the fact that the investment grade (Aggregate) and high yield bond price returns are so similar indicating that credits spreads have not priced in any credit concerns yet. Even the equity volatility index – VIX – fell and stayed below 15 throughout most of June after being above 20+ for much of the past year.
I was tempted to only show a YTD rates graph to highlight current yield levels are back to early March before the banking issues. However, there was also the early November 2022 peaks that still need to be taken out on longer-term bonds. On the very short end, you see that after an initial pullback, 3 month treasury bills continued to march higher and has at least another 0.25% to go. The 2-year treasury rate fell the most in March as the market priced in multiple Fed rate cuts. After hovering for a couple months, those rate cuts have been slowly unwound and the 2-year is back to relative high yields. The 10- and 30-year didn’t fall as much as the 2-year but they too have risen almost all the way back to March levels. The longer end of the curve captures various dynamics in levels, including long-term inflation expectations and potential Fed rate cuts after a recession. Inflation readings have been coming down but the Fed’s preferred index – Personal Consumer Expenditures (PCE) has remained quite flat at the Core level (excluding food and energy). The second graph below shows the more common Core CPI vs. Core PCE. You can see Core CPI ran hotter than PCE and has been falling while Core PCE has remained sticky.
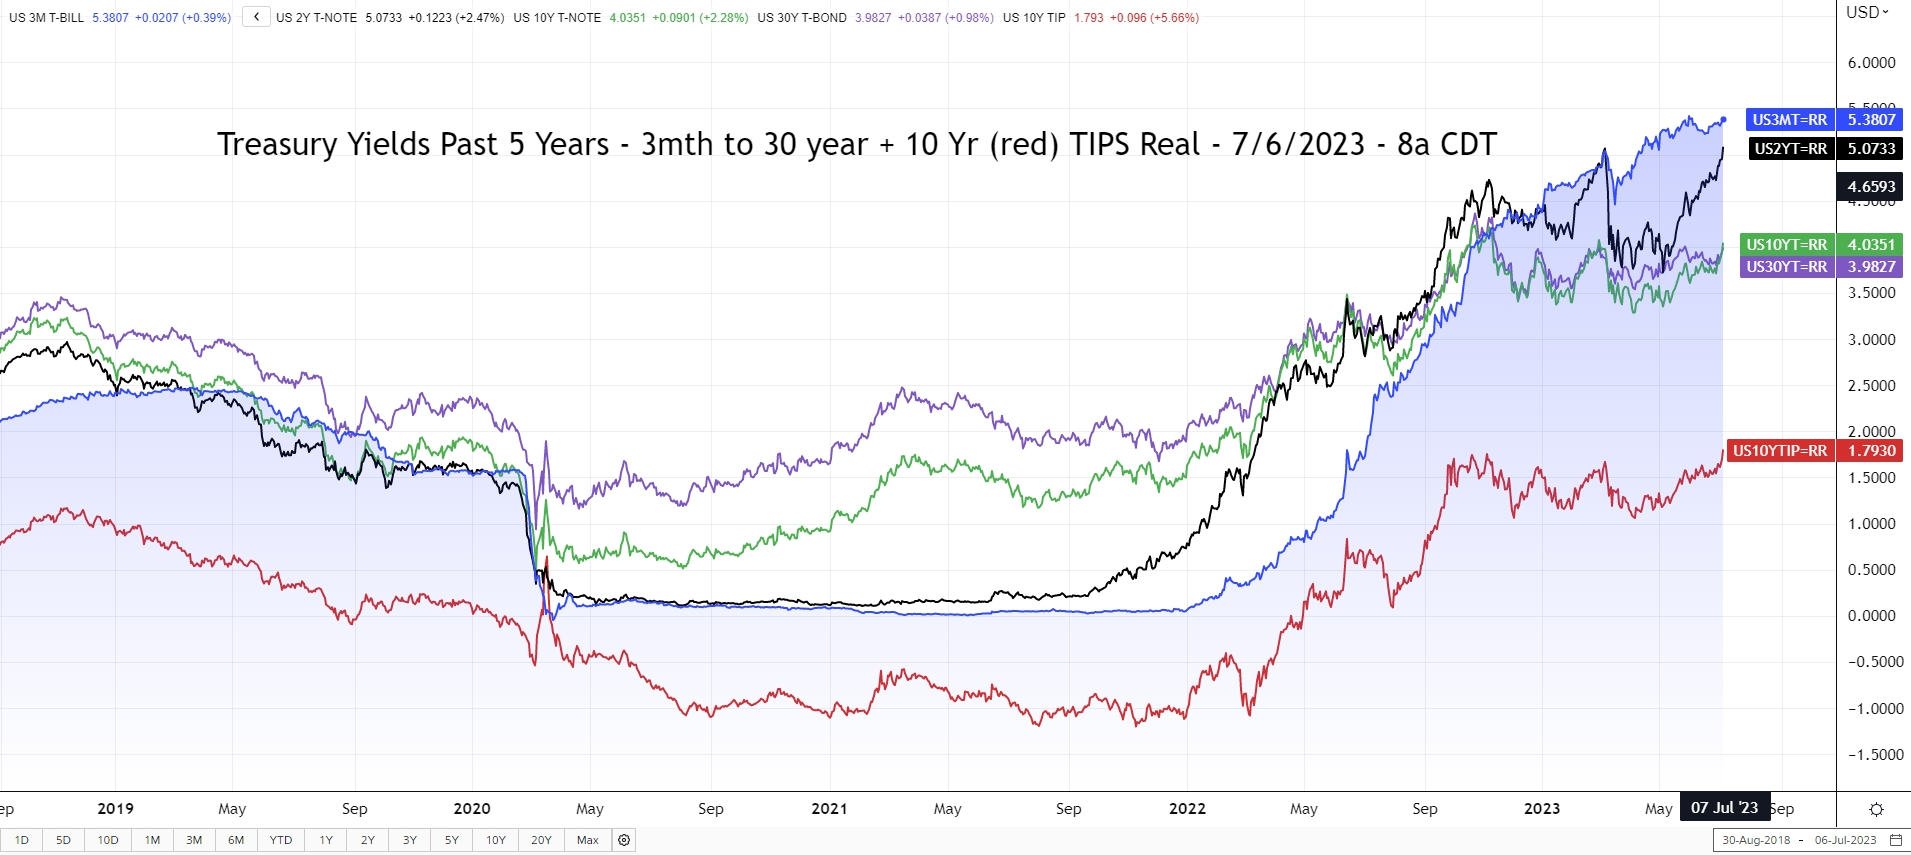
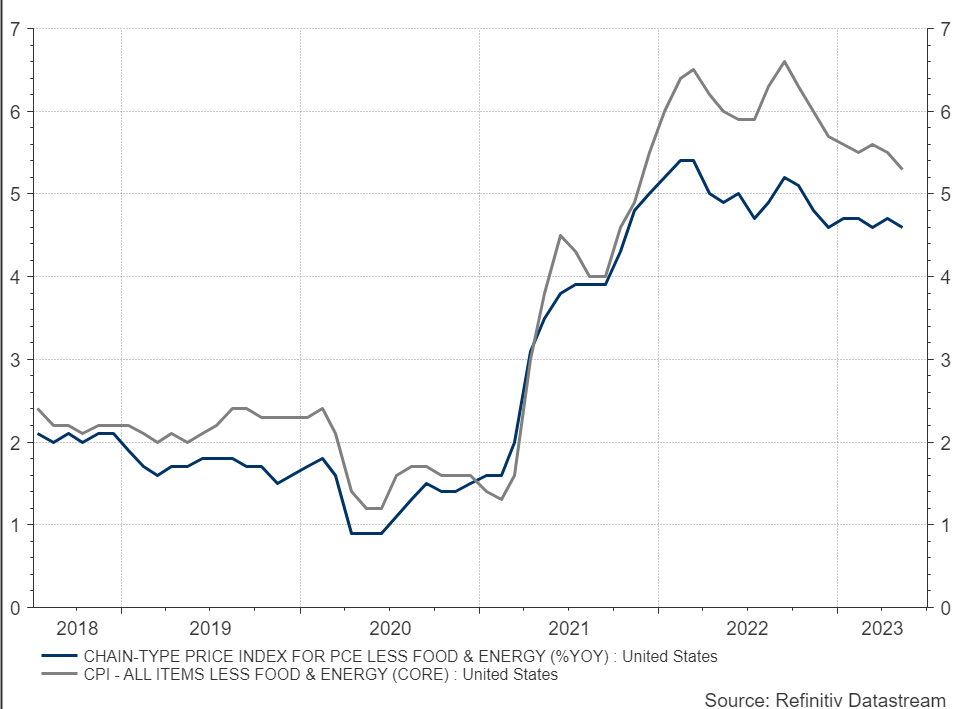
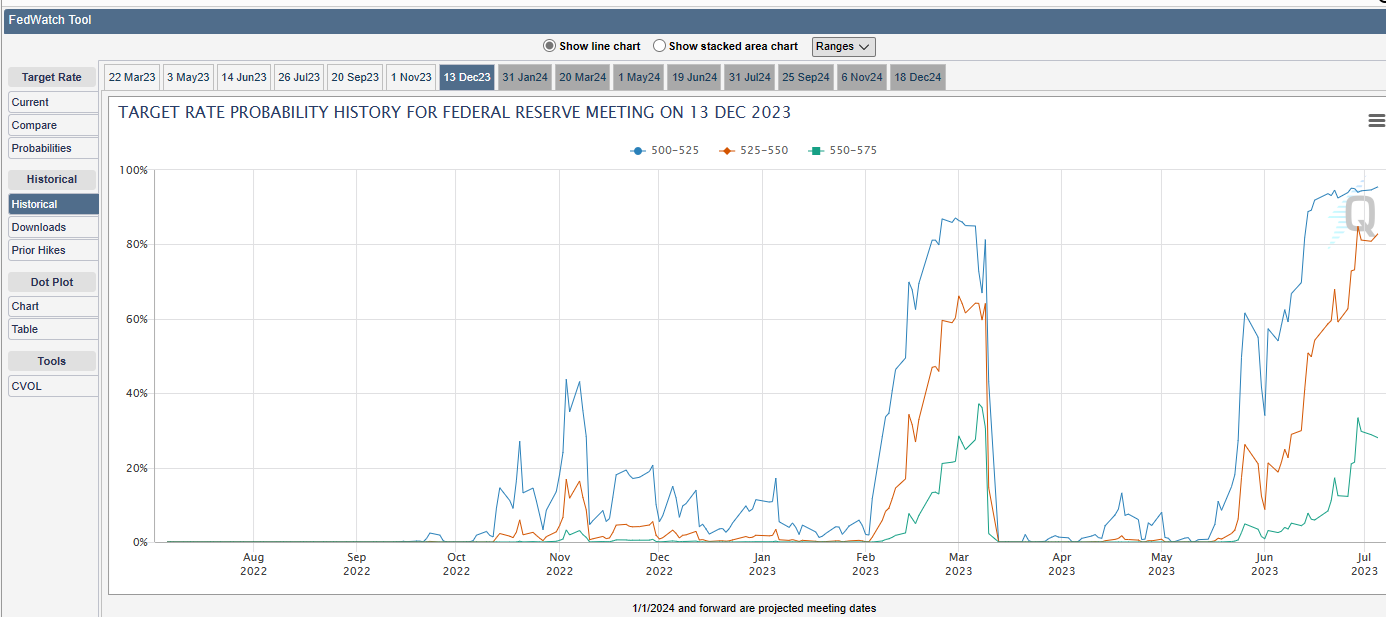
The Fed held rates at a target range of 5.00% to 5.25% at the last Fed meeting on June 14th. The surprise was the indication there may be another 0.50% rate increase by year-end 2023 based on its “Summary of Economic Projections”. The reason for no rate change was to give the economy time to reflect the large and rapid rate increases that started in early 2022 (see blue line in graph above for bogey) – the infamous “long and variable lags of monetary policy”. Also recall the Fed’s Balance Sheet continues to decrease (after brief increase in March around banking issues) and credit conditions will very likely tighten from banks (although alternative lenders are stepping in). The next Fed meeting concludes July 26th. Fed Funds futures are currently pricing in over a 90% probability of a 0.25% hike at the July meeting. It is interesting to look at where the markets are pricing in levels by the December 2023 meeting and how that has changed during 2023. Currently the market says no rate cuts in 2023, similar to early March, but with a bit more conviction. (Source: CME FedWatch Tool).
There is plenty of summer left! Continue to enjoy the slower paced days – or make them so – and throw in some ice cream!
Posted by Kirk, a fee-only financial advisor who looks at your complete financial picture through the lens of a multi-disciplined, credentialed professional. www.pvwealthmgt.com