

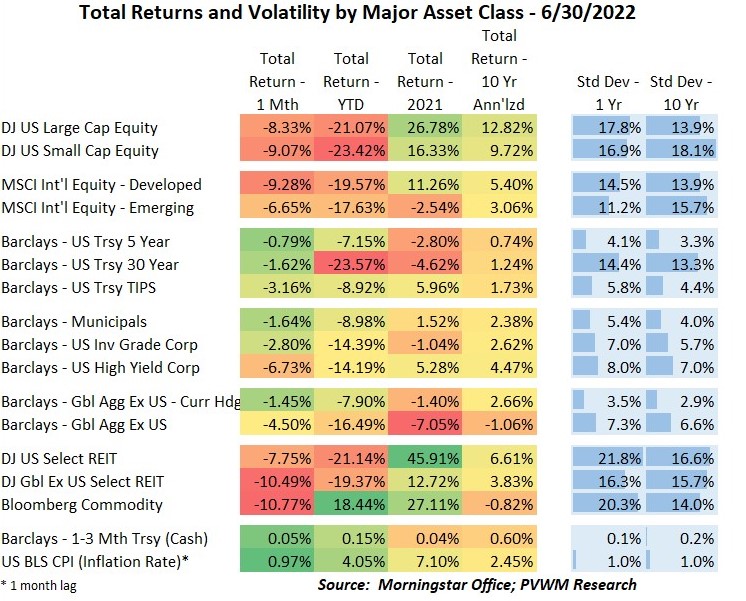
Asset Class Returns - 6/30/2022
After a strong finish last month the markets took another leg down in June. Equity markets were down about 9% for the month but global REITs and commodities – yes commodities – were down over 10%. YTD losses for equities are down 18-23% but the largest negative YTD asset class in the table below – long-maturity treasuries which are down 23.57%. The only positive returns – commodities and cash (and inflation but that positive number implies a negative return of your purchasing power). Also note the difference in the global aggregate bond index without the currency hedge, about 8.5% lower showing the impact of a strong US Dollar on international investments.
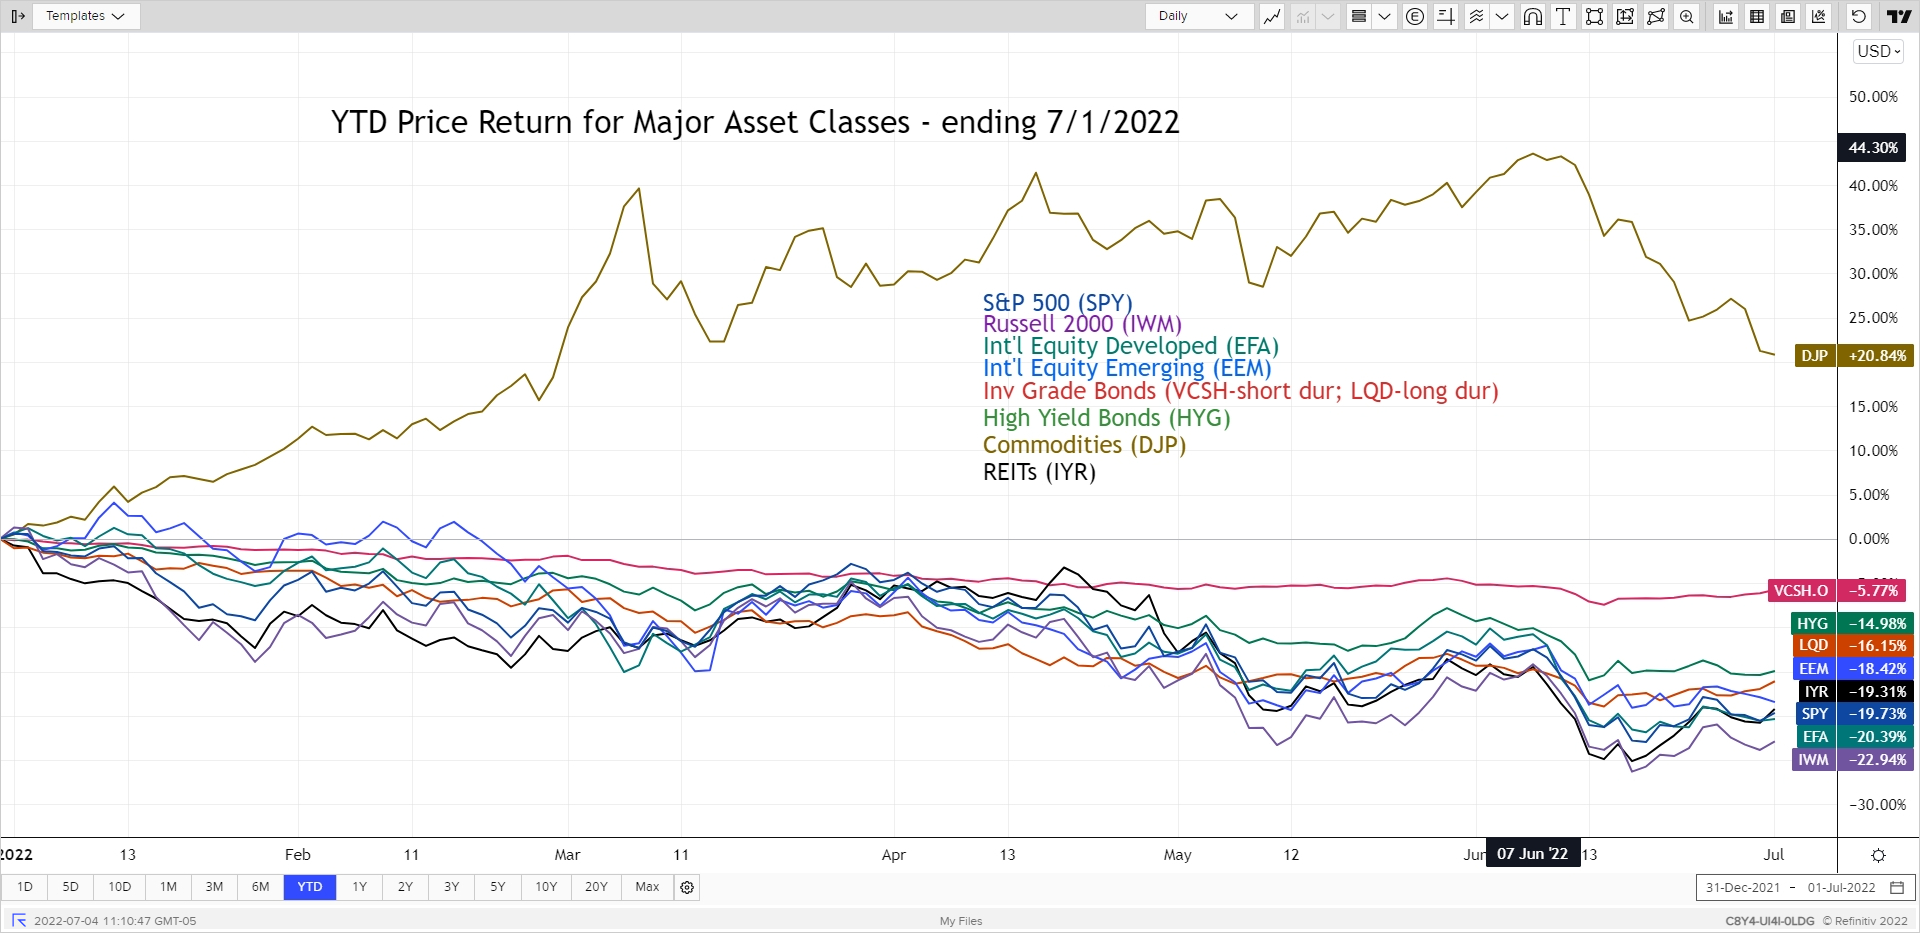
The YTD major asset classes graph includes Commodities again this month to illustrate the large pullback. Yes the Energy component was part of the story but Grains and Industrial Metals were key drivers with double-digit pullbacks. US equities were driven by Energy (down over 16% for month alone!) and Materials sector, as concerns of recession flared up this month. Defensive Consumer Staples and Health Care held up well, though slightly negative for the month. International Developed equities experienced similar pullbacks as the US but Emerging Markets was the relative outperformer – both monthly and YTD – as some pain was priced in late last year. For the astute observers of the graph, you will notice a new ticker to supplement the existing Investment Grade Bond returns. The existing LQD ETF has a longer duration and given the impact of rates this year, I added a shorter-duration corporate ETF (VCSH).
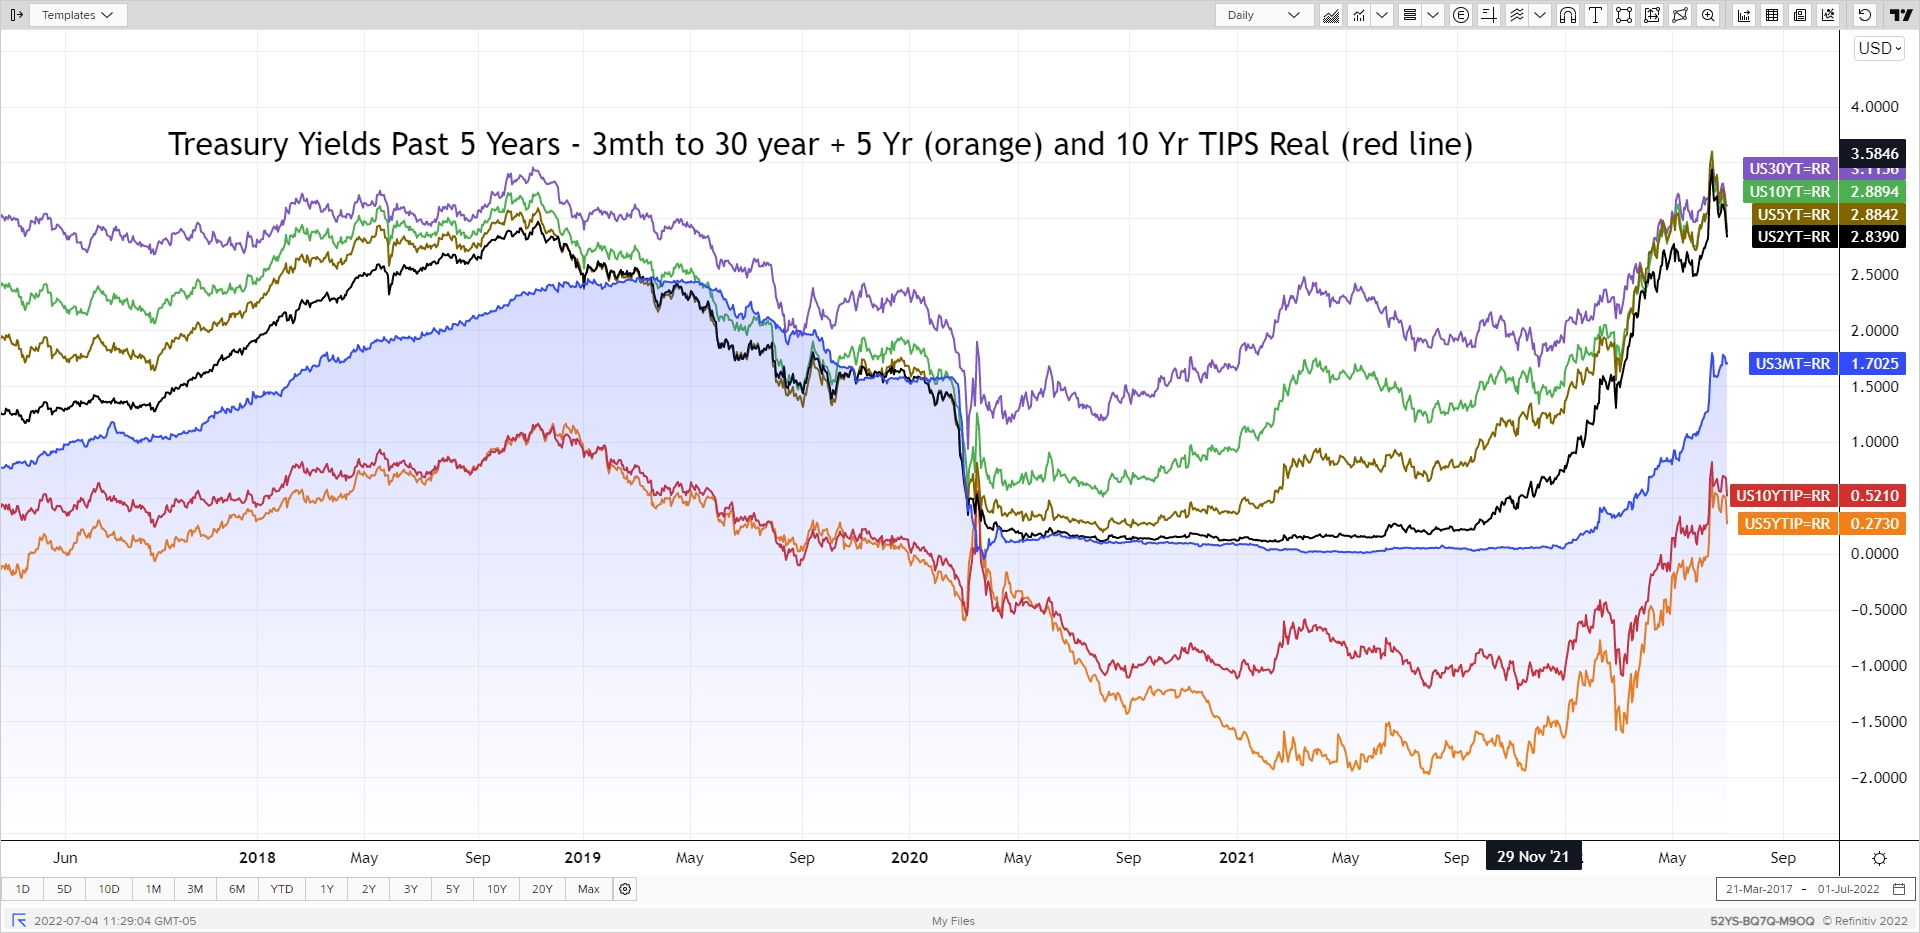
Treasury rates did something unusual this past month – they went down! There was a significant decrease in rates the last 1.5 weeks of June as the market suddenly shifted attention to a potential recession near term. If it happened, this may cause the Fed to stop raising interest rates sooner than the market had been pricing in. However, Fed Chair Powell has reiterated they will keep hiking until inflation is under control. There was also a noticeable widening of credit spreads. Note I also added 5-year real yields this month (orange line) to show how quickly the extra negative 1% real yield from 2021 has been evaporated. The rate that did not fall this past month: 3-month Treasury Bills now yielding over 1.70% as it rides the Fed’s coattails.
There are two things to note regarding the Federal Reserve and FOMC meetings.
- The June 15th meeting delivered on a larger 0.75% rate hike after CPI and more importantly to the Fed, consumer expectations of inflation, were higher than expected. Here is how the Fed statement changed from the May to June meeting. The Fed Funds rate is now 1.50% - 1.75% range with the next meeting concluding July 27th and the market expecting another 75bps increase.
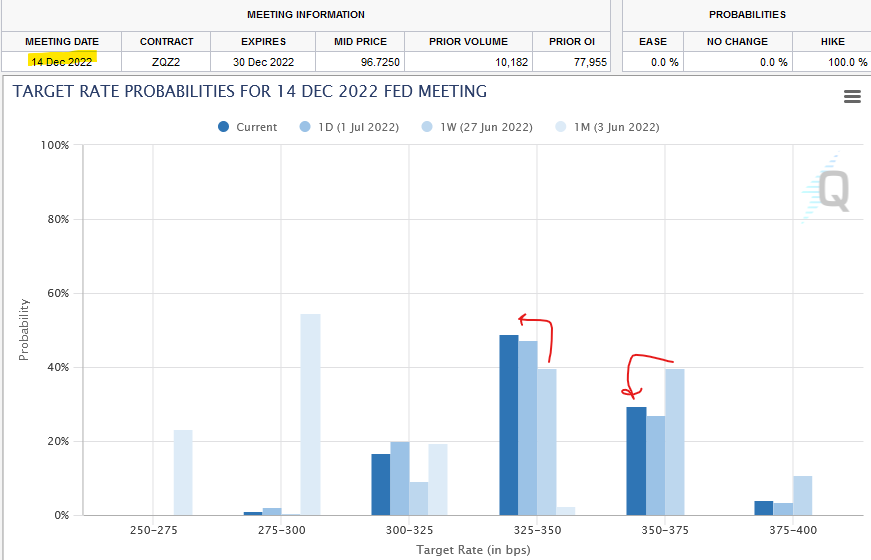
- There was a noticeable shift in the Fed Funds futures market over the past week, shifting the likely range by year-end of between 3.25% - 3.50%. The 3.50 – 3.75% is still likely, but a noticeable shift (Source: CME FedWatch – 7/1/2022). I don’t agree with the shift but respect for market pricing (“technicals adjusted”) is required.
There are two economic topics getting attention that deserve some graphs for context. I provide my brief comments and opinion, then leave you with the graphs to inform your own view.
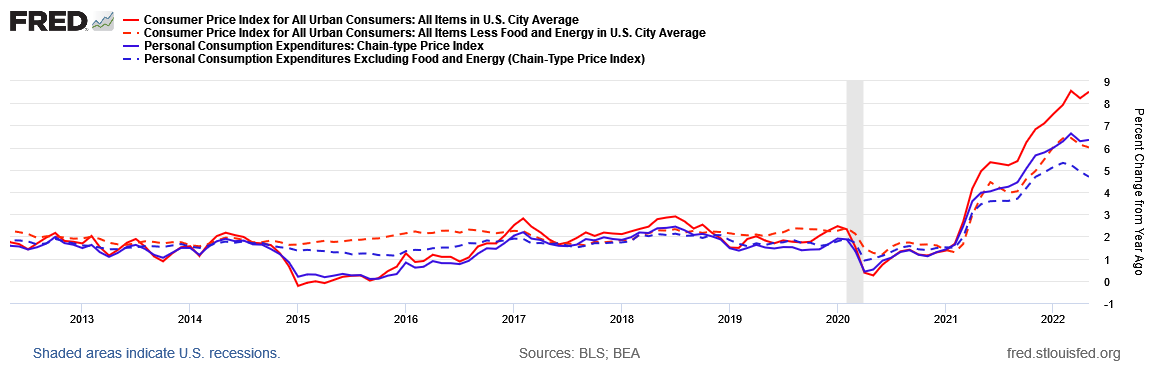
- Inflation levels and which index? Not only is there headline vs. core (excluding food and energy) inflation indices but also Consumer Price Index (CPI) vs. Personal Consumer Expenditure (PCE), the latter being the Fed’s preferred index for their 2% target. There is not as much wood to chop on that index. The Fed believes PCE is broader and timelier; if you want a deep dive click here. Fed Chair Powell acknowledged that economists historically focus on core but realize people experience the headline number.
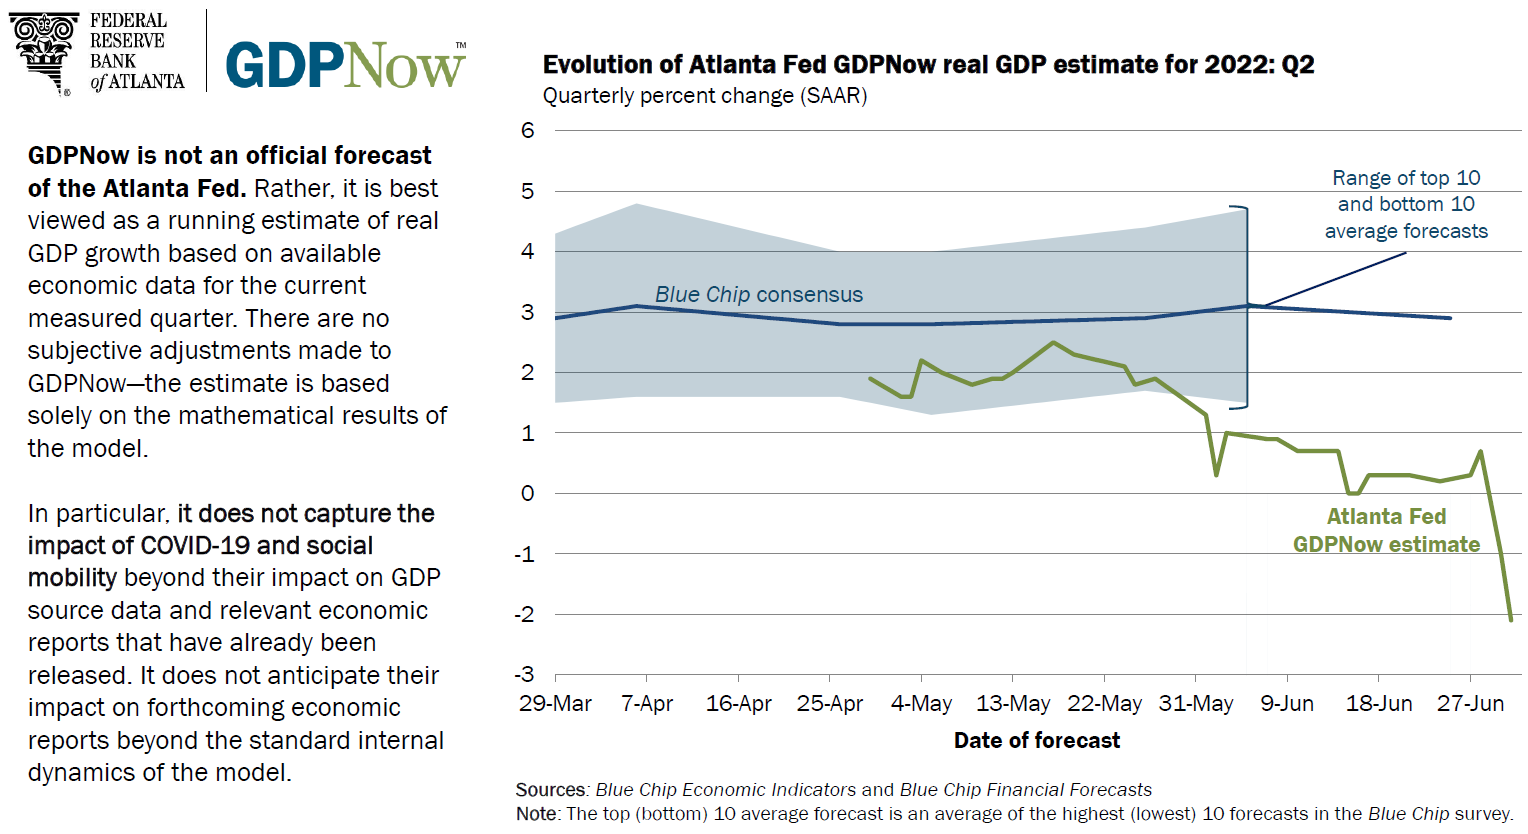
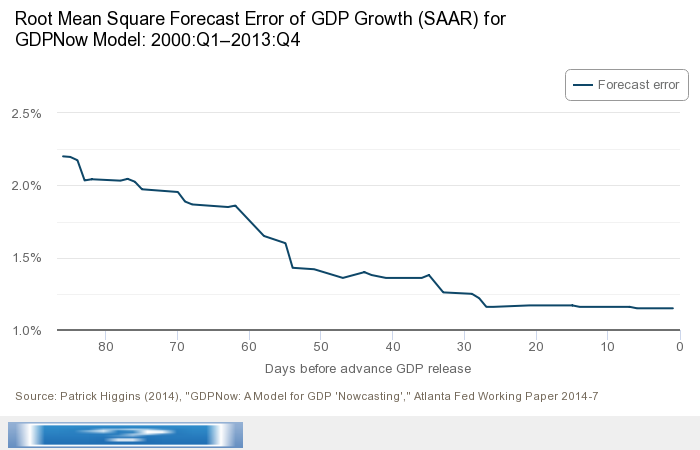
- Technical definition of recession (two successive quarters of negative GDP) and real-time estimate showing another negative quarter of GDP growth. But be aware that: a/ real-time estimates have historic error rate of 1.25% this far out from GDP release (about 30 days out now), and b/ other factors also influence a recession definition. Plus we have a pretty hot jobs market (next report this Friday) if in fact a recession is nigh, which I don’t believe it is.
Enjoy a few more months of summer (yes, I count Sep)! I hope they are filled with sun and fun.
Posted by Kirk, a fee-only financial advisor who looks at your complete financial picture through the lens of a multi-disciplined, credentialed professional. www.pvwealthmgt.com