

Asset Class Returns - 5/31/2026
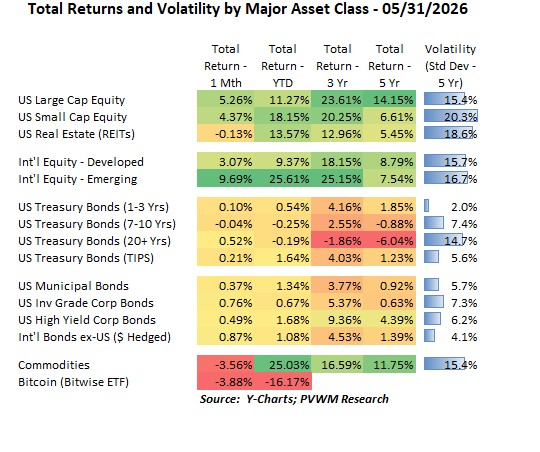
The equity rally continued in May primarily on the back of AI-related earnings projections. Glancing at the table above it looks like a traffic light - green light equity on top, yellow light caution in middle with bonds and red light stopping (even falling) at bottom with commodities and bitcoin. Optimism for the end of the Iranian war surfaced multiple times but is still not resolved. The market anticipates the war ending soon.
- US Large and Small Caps kept marching higher, adding 5% on top of strong April returns
- Int’l equities were also solid, with Developed markets in-line with US but Emerging popping 9.7% fueled by AI names in South Korea and Taiwan
- Treasury returns were relatively flat as rates rose modestly; 2yr up 10bps and 10yr up 5bps
- Credit spreads tightened to offset rising treasury yields, giving a small positive return
- Commodities saw a negative month as Energy was down over 12% in May as tensions cooled in Iran; Industrial Metals saw gains
- Bitcoin did not continue their April rally, falling 3.9% in May; of the major asset classes, it has the worst YTD return at -16.2% despite continued favorable industry trends
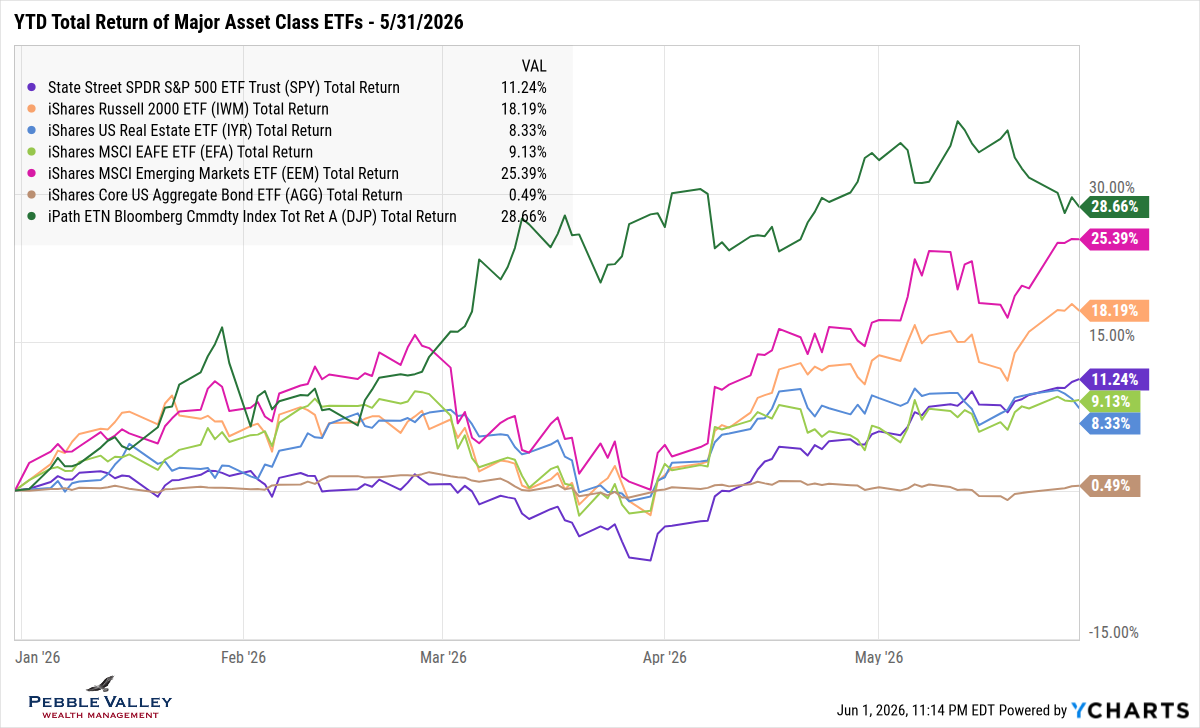
The graph below of YTD total returns of major asset class ETFs highlights the monster rally starting in late March.
- Commodities (dark green) still lead the pack but gave up their relative mid-month peak
- Emerging Markets (magenta) had two very solid months, almost catching commodities
- US Small Caps continue to pull away from the pack despite being more sensitive to higher rates
- US Large Caps, REITs and Int’l Developed remain bunched together though US Large Caps have the strongest two-month run of the three
- Bonds are being bonds, holding steady and thankful for the coupon income to offset the price drop due to higher rates.
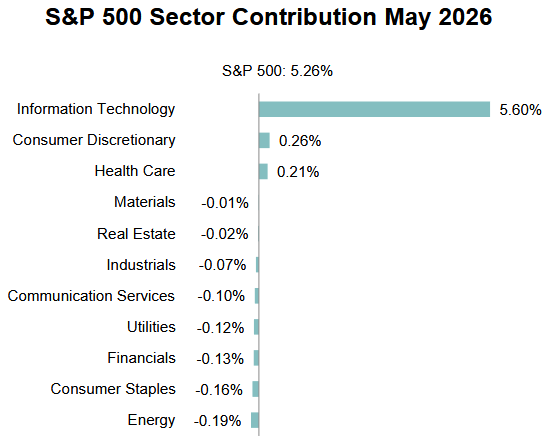
The “focused graph” this month is a table sourced from the S&P Dow Jones Indices US Dashboard. It is powerful visual showing the dominance of the Technology sector on returns again this month (recall last month’s top and bottom performing sectors graph). Not only did the Tech sector have a 16% return for May alone, it makes up 35+% of the S&P 500.
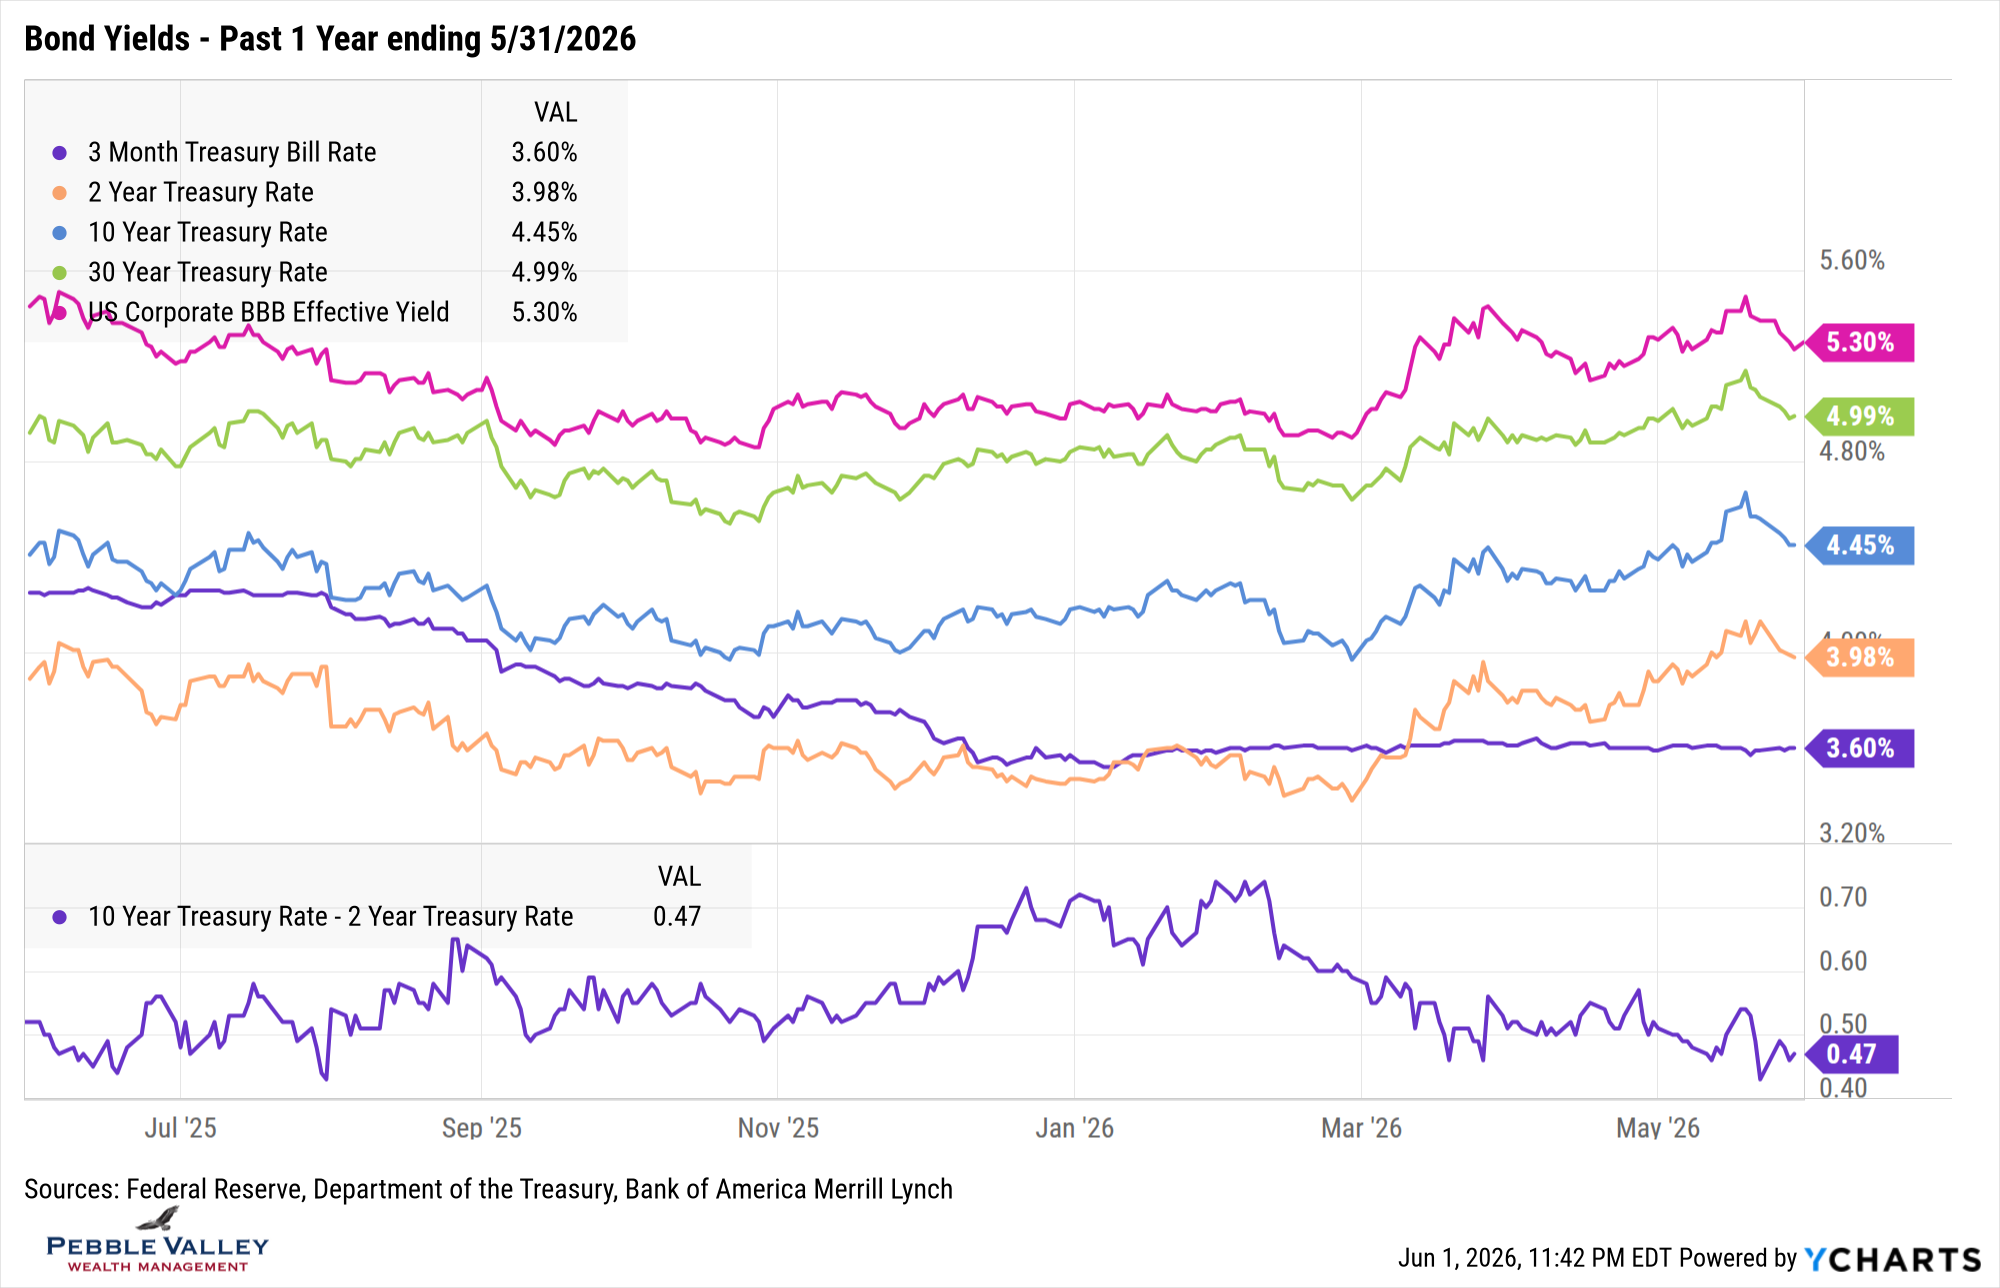
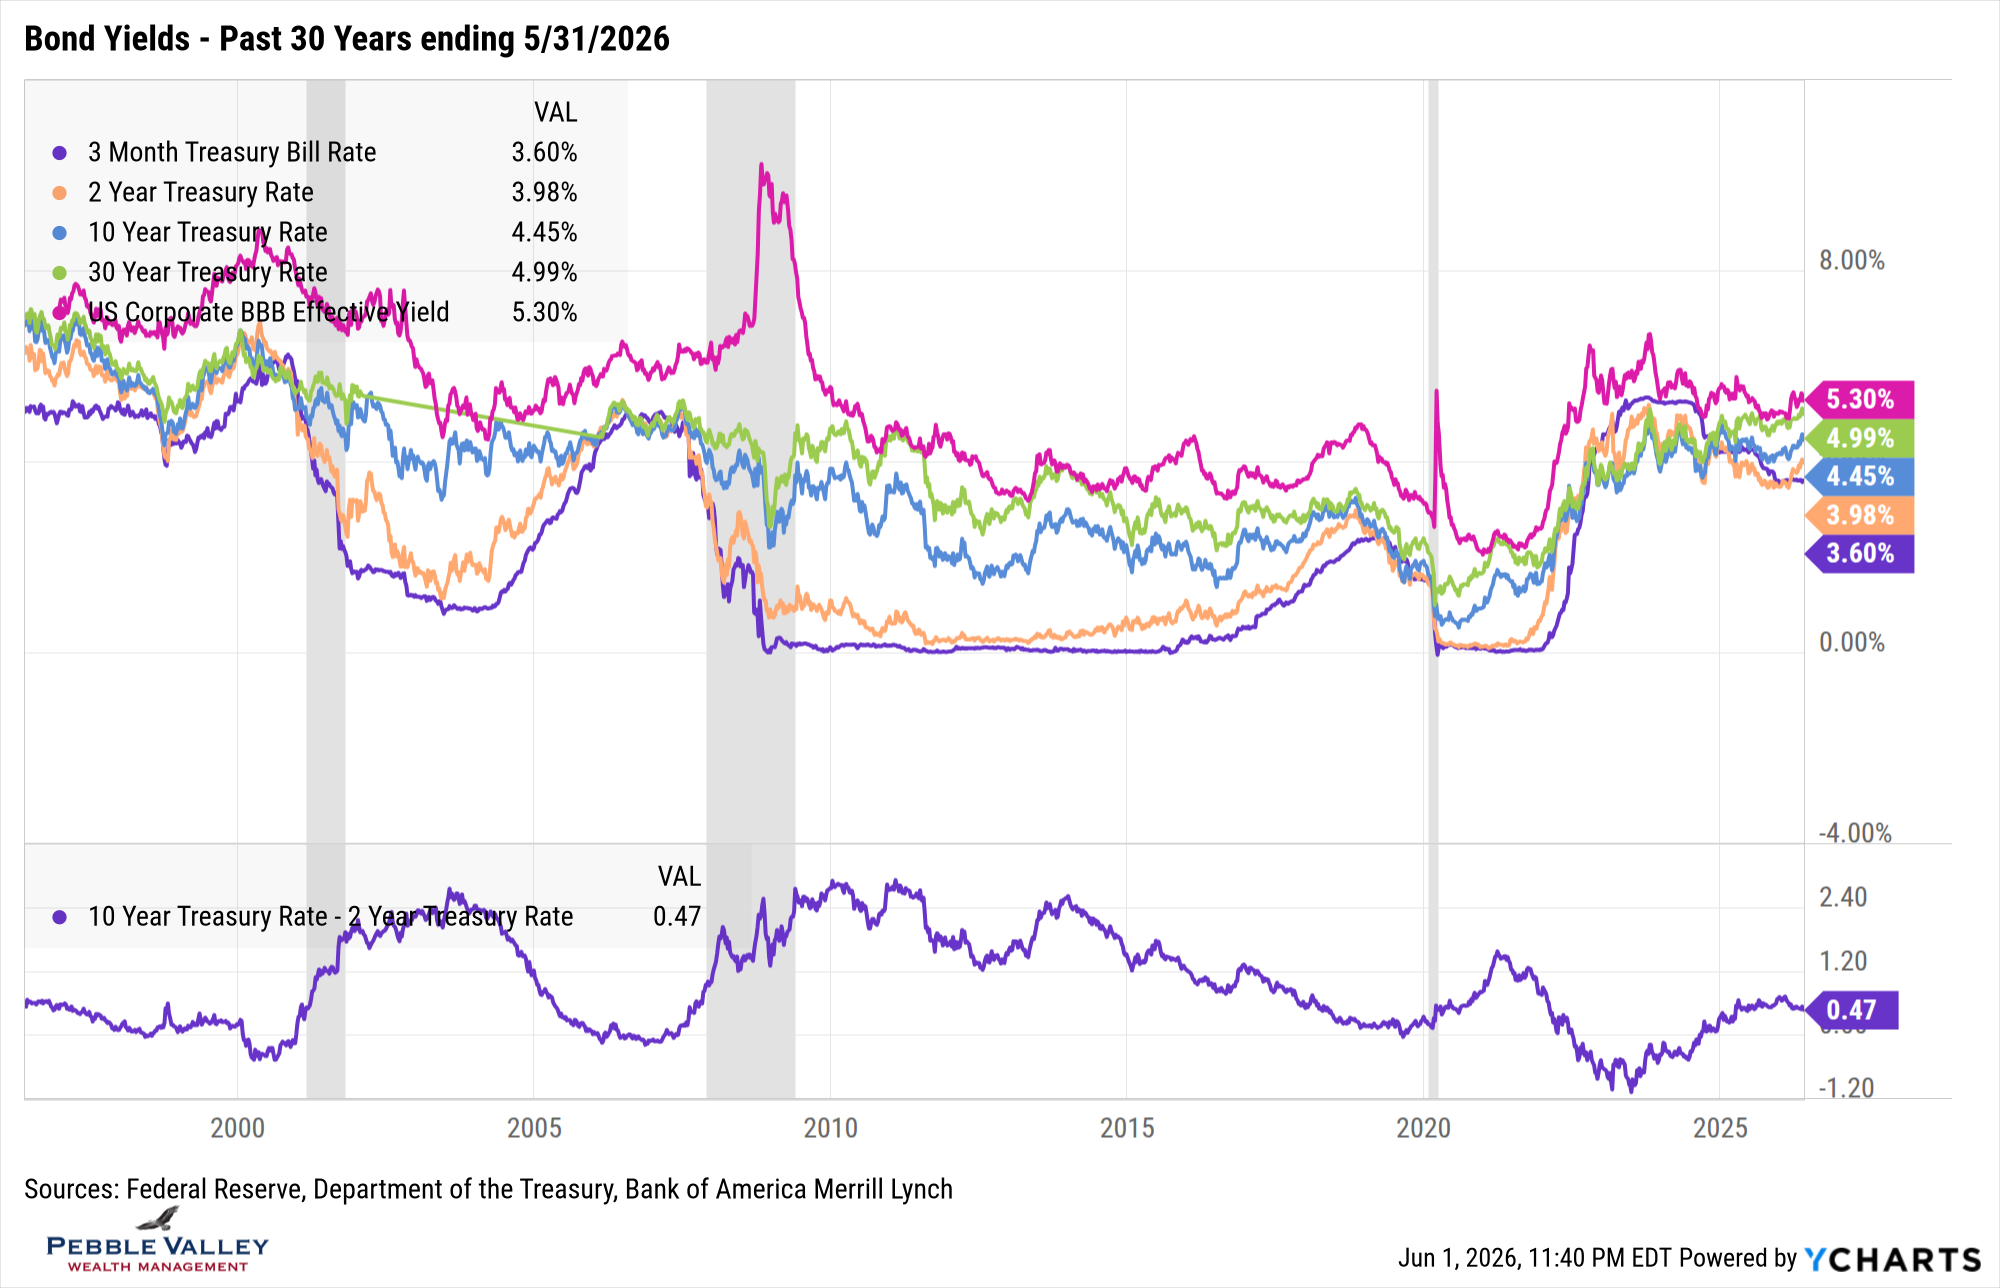
Next are the bond yield graphs over the past one- and thirty-year time frame. Here is what caught my attention this month:
- Rates were on the rise through the middle of May, then fell noticeably as optimism of a potential peace deal took over
- Rates still remain high with the 2-, 10- and 30-yr at roughly 4%, 4.5% and 5% respectively
- Good old T-Bills keep delivering a solid 3.6+% for cash
- The 30-year time frame chart doesn’t change month each month, but serves as a nice reminder that current rate levels are not crazy high.
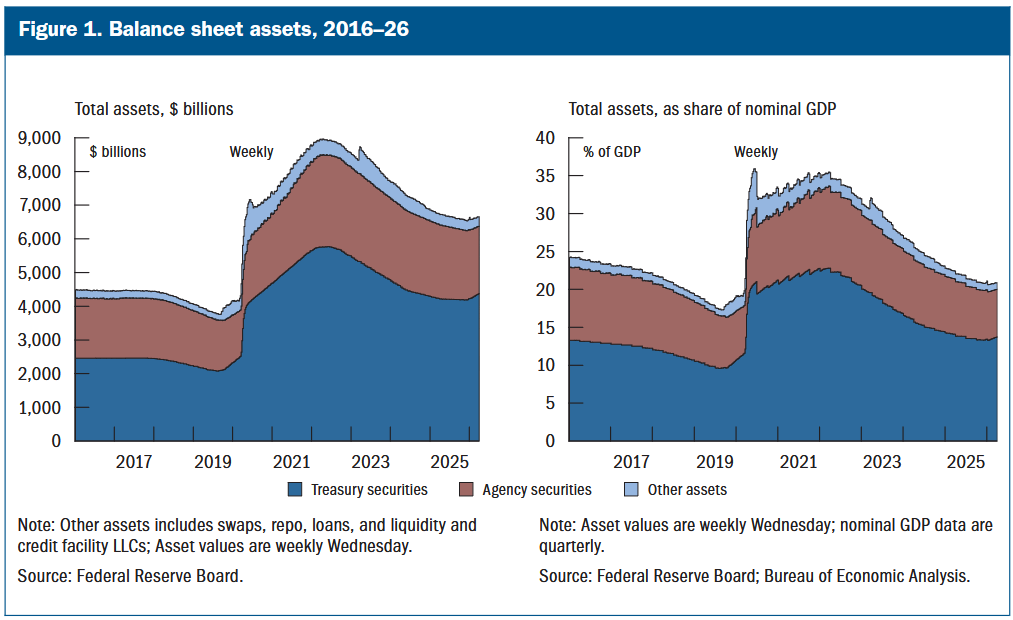
There was no FOMC meeting in May though new Fed Chair Kevin Warsh was sworn in. His first meeting concludes June 17. Former Chair Powell will remain as Fed Governor and voting member. The Summary of Economic Projections is scheduled to be released at this meeting. It will be interesting to see how the communications change under new Chair Warsh. Another thing to watch is whether there will be any changes to the Fed’s balance sheet (see graph below). I don’t have any insights, other than I believe the Fed will work closely with Treasury and they are smart, creative people. For example, will the Treasury keep funding with T-Bills (lower interest expense if rates are cut) and the Fed releases longer-dated bonds from the balance sheet into the market (reduces Fed’s balance sheet and satisfies the market with longer-dated bonds)? Fed Funds pricing now shows the current 3.50-3.75% rate likely remains until the end of 2026 but then a rate HIKE is priced in for 2027 (CME FedWatch on June 1, 2026).
My special topics this month are long-term earnings growth and upcoming monster IPOs.
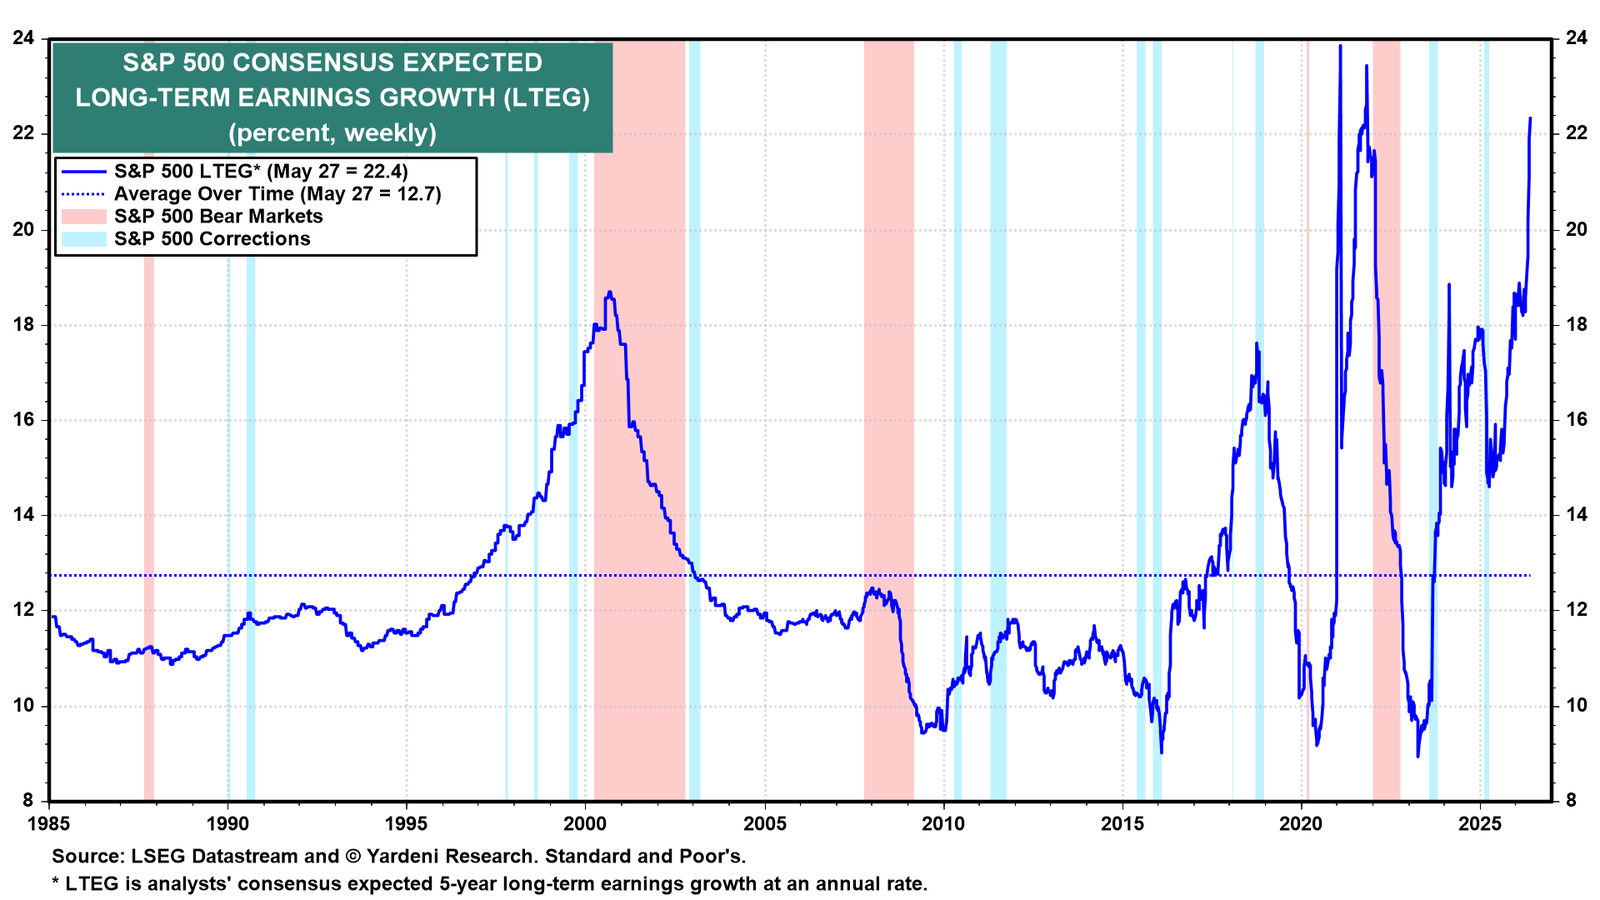
The first chart is from Ed Yardeni showing expected S&P500 long-term earnings growth projections. Oftentimes earnings projections don’t change drastically but the price paid for the earnings – the forward PE multiple – can rise on optimism. Recently the expected earnings optimism has exploded but the forward PE has drifted down slightly. Will these projected earnings be delivered? Also note these higher earnings projections are in a higher rate environment than the recent past which adds an extra headwind.
The first monster IPO – SpaceX – is expected to begin trading June 12 and expected to raise $75 - $80 billion with a market cap of about $1.8 trillion. AI firms Anthropic and OpenAI are also expected to go public soon. These three firms alone could have a combined market cap of $4 - $5 trillion and raise about $200 billion in capital. Google also just announced an equity raise of $80 billion. Note these new IPOs are expected to have a very low amount of shares available (“free float”) in the 3-5% range. Many indices use “float-adjusted market cap” when a name is added to their index so a $2 trillion market cap would “only” have $60 - $100 billion index impact. The S&P 500 has a market cap in the $60 trillion area according to Ed Yardeni. The exception is Nasdaq which starts with full market cap, but has a multiple of free-float cap of 5x – so a higher impact but still below 25% of total market cap. Here are some of the questions being raised along with my short answers, but you should follow the latest news as these developments unfold.
- Can the market absorb this much?
- Likely yes, with excitement from retail investors and the low free float.
- Are these names being added to the major indices?
- Some indices are modifying the rules given the long-term nature of these private companies. S&P is considering lowering waiting period from 12 to 6 months; Nasdaq is cutting the trading days required from 90 down to 15 days.
- Will other names need to be sold to make room?
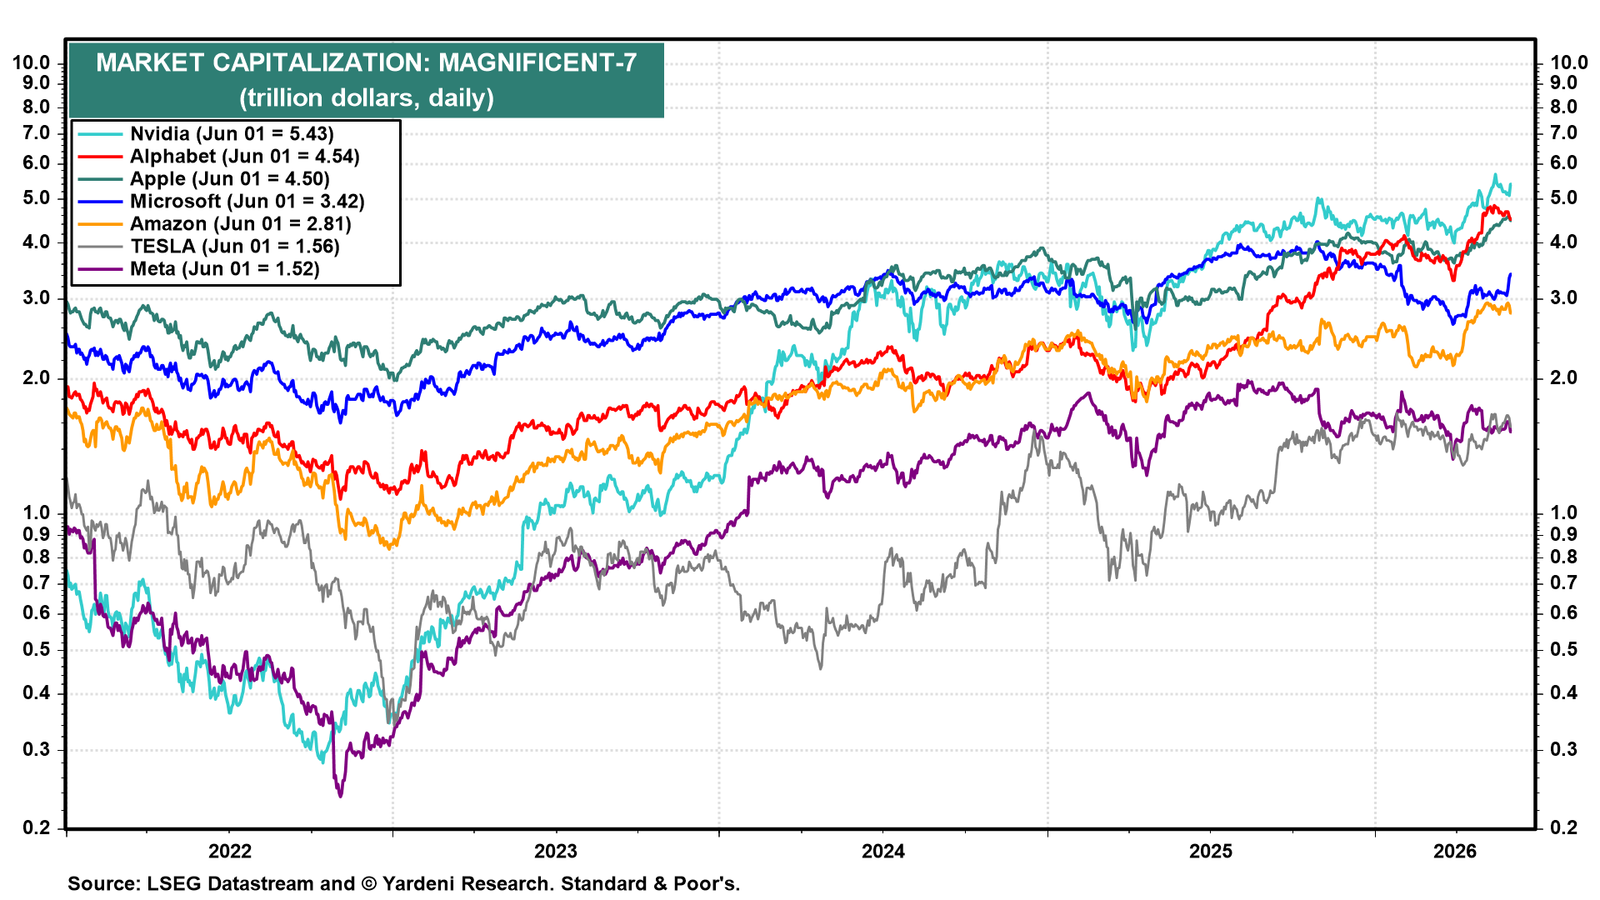
- Will see. The low free float expected will result in much lower market caps relative to Mag 7 (see graph below) but adding more AI/Tech exposure to already concentrated positions may see some selling on the margin.
- Are the passive index fund buyers going to overwhelm the supply of shares and be the bid to the market when unlocks occur?
- Not sure. Likely not overwhelm supply initially given restrictions of being added. The unlock selling of shares will be interesting. Existing insiders can’t sell at IPO but it appears SpaceX has staggered unlocks based on Q2 earnings, performance based and different time based. The latest unlocks occur will be after 180 days. A skeptic would ask if that is why S&P is considering reducing the time to be added. Not sure.
Happy Summer! Congrats to the recent graduates and enjoy the “longest day of the year”.
Have questions? Reach out! We're happy to help.
Posted by Kirk, a fee-only financial advisor who looks at your complete financial picture through the lens of a multi-disciplined, credentialed professional. www.pvwealthmgt.com