

Asset Class Returns - 5/31/2025
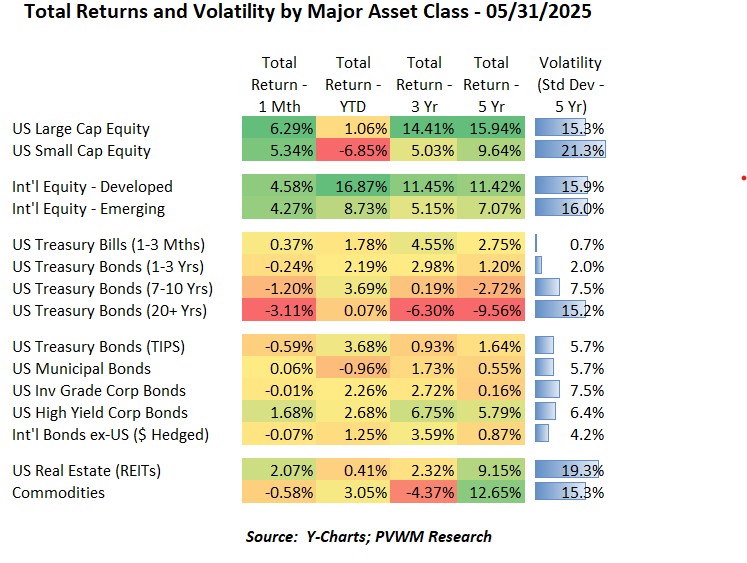
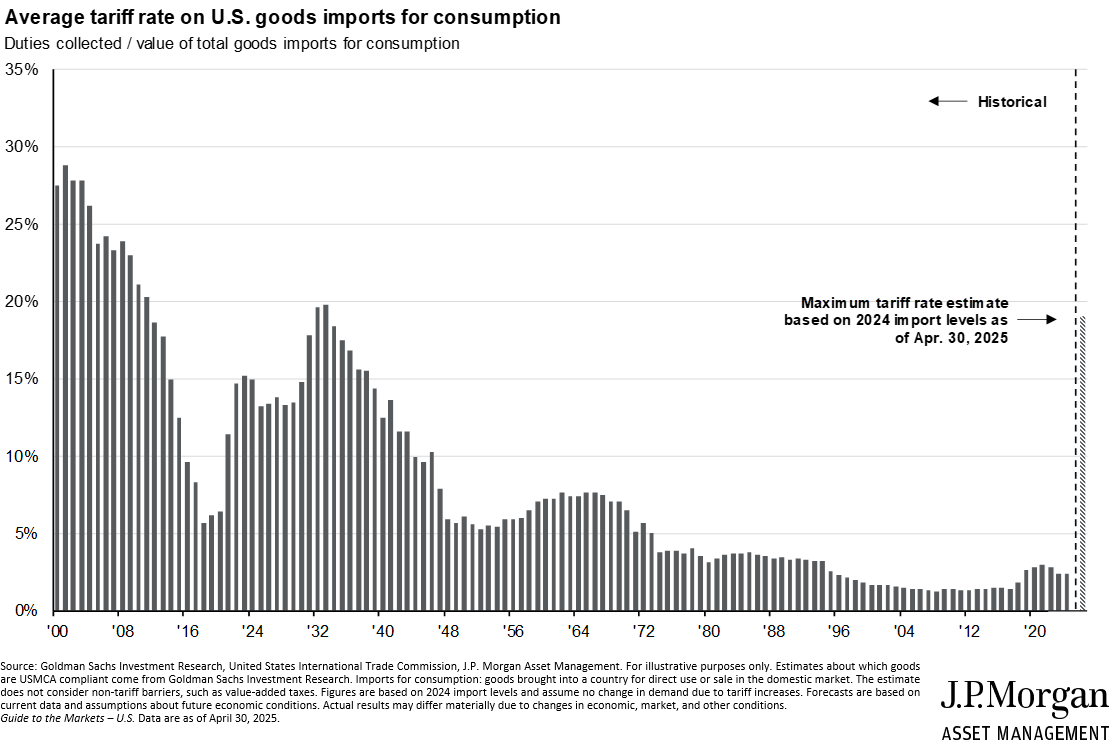
Equities bounced back strongly in May, having the best monthly performance since late 2023. Ongoing tariff negotiations during May brought tariff rate expectations down to mid-teens - well below initial levels but still noticeably above the 2-3% average prior to early April. Looking at the table above, the only negative monthly returns for the major asset classes were in bonds and commodities. Unlike April, the path during the month to get to these returns were much smoother, though uncertainty remains and future volatility is expected. That is always the case in markets, but is currently higher than normal.
- US equities had a solid month with Large Caps doing slightly better but both on fire; the YTD dispersion remains however
- International equities keep marching along as well; monthly returns not quite as strong as US equities but YTD levels – especially the +16.9% returns for Developed – are impressive for 5 months' work
- REITs and Commodities didn’t fare as well, but both remain positive YTD
- The negative returns can be found in the Treasury bond market, especially the longer maturity bonds
- Corporate bonds were relatively flat and High Yield was up 1.7% as tightening credit spreads offset the higher treasury rates.
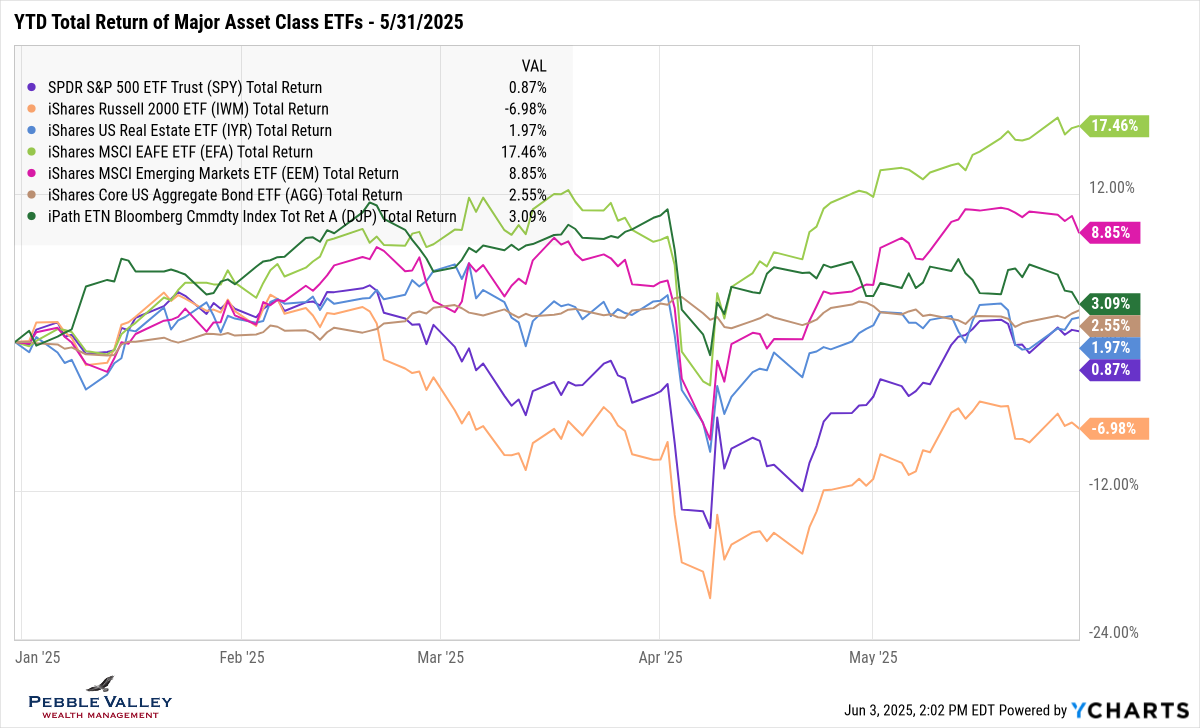
The graph below shows YTD total returns of major asset class ETFs. The recovery from mid-April kept on marching higher with the exception of REITs (due to rising rates) and Commodities (Precious Metals were flat and Grains were down). The implied market volatility gauge (VIX) continues to drift lower but interest rates remain elevated which can be a drag on valuations and corporate profitability. And no, that top green line is not US equities or the “Mag 7” but rather International Developed Equity markets, the forgotten asset class over the past decade or so. The next highest magenta line – International Emerging equities.
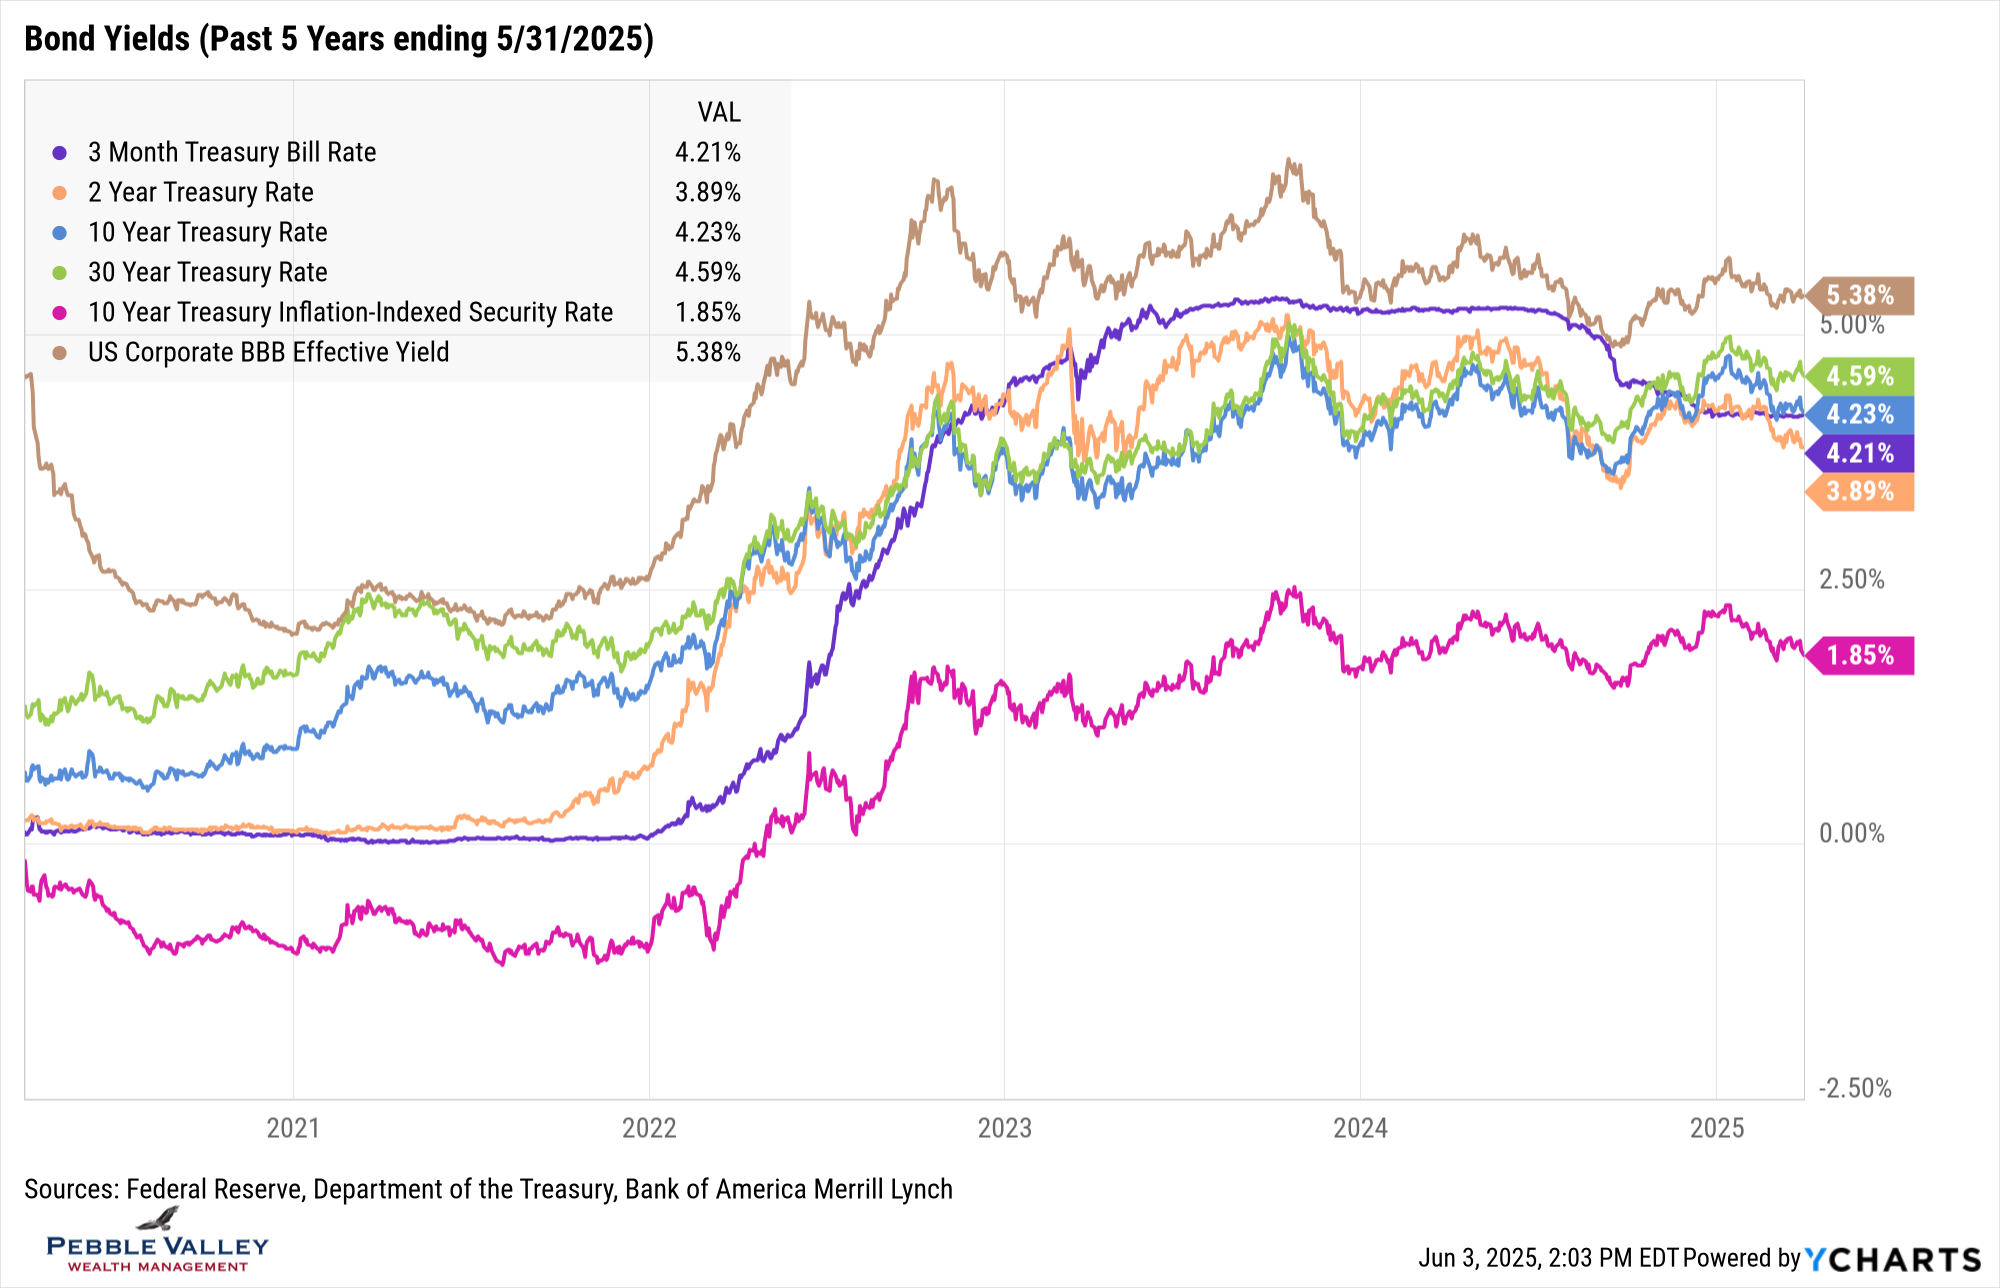
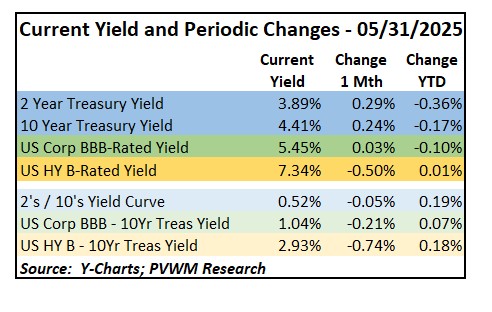
Looking at the bond yield graph below with five years of history, nothing jumps out with the longer-term view. Looking at the table below that showing the change in rates over the month and YTD a few things jump out.
- 2-year and 10-year rates rose about 0.25%
- Investment grade spreads (BBB) tightened a similar amount which mostly offset the price impact from rising treasury rates
- High Yield spreads tightened even more, providing positive total returns for the month; HY spreads are only a 0.18% wider on YTD basis
- Not shown, but longer maturity bonds both in the US and globally have been rising and the potential impact on equity valuations and borrowing costs bear watching.
The next FOMC meeting concludes on June 18th. This meeting will include an update to the Summary of Economic Projections which will be informative given recent developments. Inflation data continues to moderate and the jobs market remains solid but not much time has passed since tariff negotiations and DOGE efforts began. Current Fed Funds rate remains at 4.25-4.50% and the futures market is pricing in the next likely cut at the September meeting, followed by one more in December. I expect the Fed will continue to indicate the need to follow the data for their actions, but the press conference following the meeting can be interesting.
The special topic this month will be a graph from JPM Guide to Markets showing the historic average tariff rate and what they estimate it will be as of 4/30/2025. I expect they will have a new estimate in this month’s report. This (and other firms’ estimates) will be fluid based upon latest negotiations, but it provides context on the change occurring relative to recent history. Note the US large cap equity market has recovered most of the losses YTD but the impacts and benefits of tariffs are still ahead of us.
Happy June – the longest day of daylight coming your way!
Have questions? Reach out! We're happy to help.
Posted by Kirk, a fee-only financial advisor who looks at your complete financial picture through the lens of a multi-disciplined, credentialed professional. www.pvwealthmgt.com