

Asset Class Returns - 5/31/2024
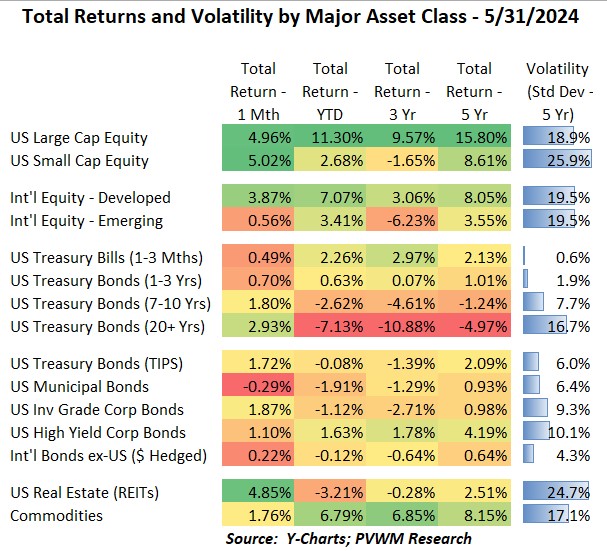
Risky asset classes rebounded in May. In US equities, both Large Caps and Small Caps rose about 5%. While monthly returns were similar, a wide dispersion remains in YTD metrics with Large Caps +11.3% while US Small Caps +2.7%. US REITS also joined the May party, up a similar +4.9%, though the YTD returns are at the bottom of the pile at -3.2%. There are more stories lately about commercial properties having trouble rolling over their debt and properties being sold with a haircut. Within sectors, Technology came roaring back (as did Roaring Kitty!) with +10% monthly return (led by Nvidia). Utilities also kept up at +9% for May – which is somewhat related to Nvidia via AI energy demands. The sector laggard this month was Energy at -0.4%. In international equities, Developed markets had a solid month at +3.9% while Emerging markets were only up +0.5%. The YTD dispersion isn’t as great as the US equity split but noticeable in the table above. Commodity markets continue their long-running favorable returns, up +1.7% for the month and +6.8% YTD. While Precious Metals continued the recent strong run, Agriculture took the place of Energy as a leader in May. Finally, all bond asset classes – except Munis - had positive returns this month with returns across maturity in line with respective durations (i.e. price sensitivity to rate changes). Credit spreads remain tight (not being paid much for risk). See more info below.
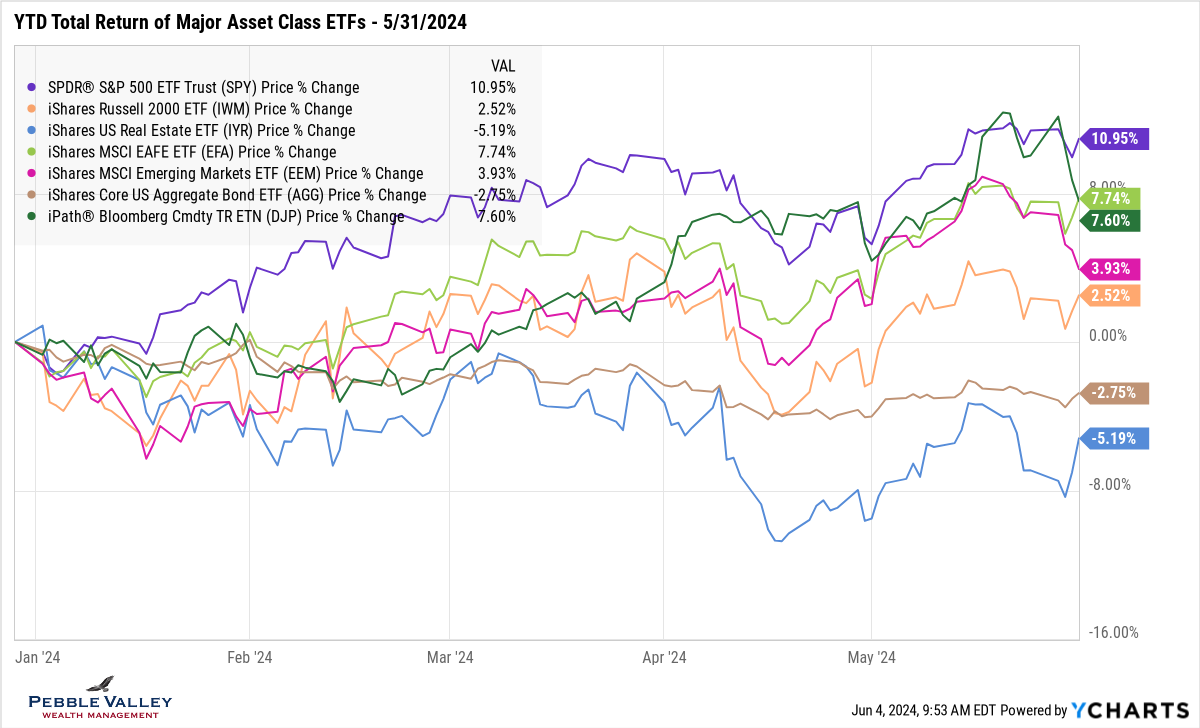
The graph below shows YTD total returns of major asset class ETFs. After the pullback in April, you can see the nice rebound in May for most asset classes. There was a late-in-month pullback for commodities and emerging markets however. While US REITs had a positive return for May, they remain the worst returning asset class on the graph at -5.2% YTD. US bonds – “the AGG” – also had a positive May but remain in negative territory YTD.
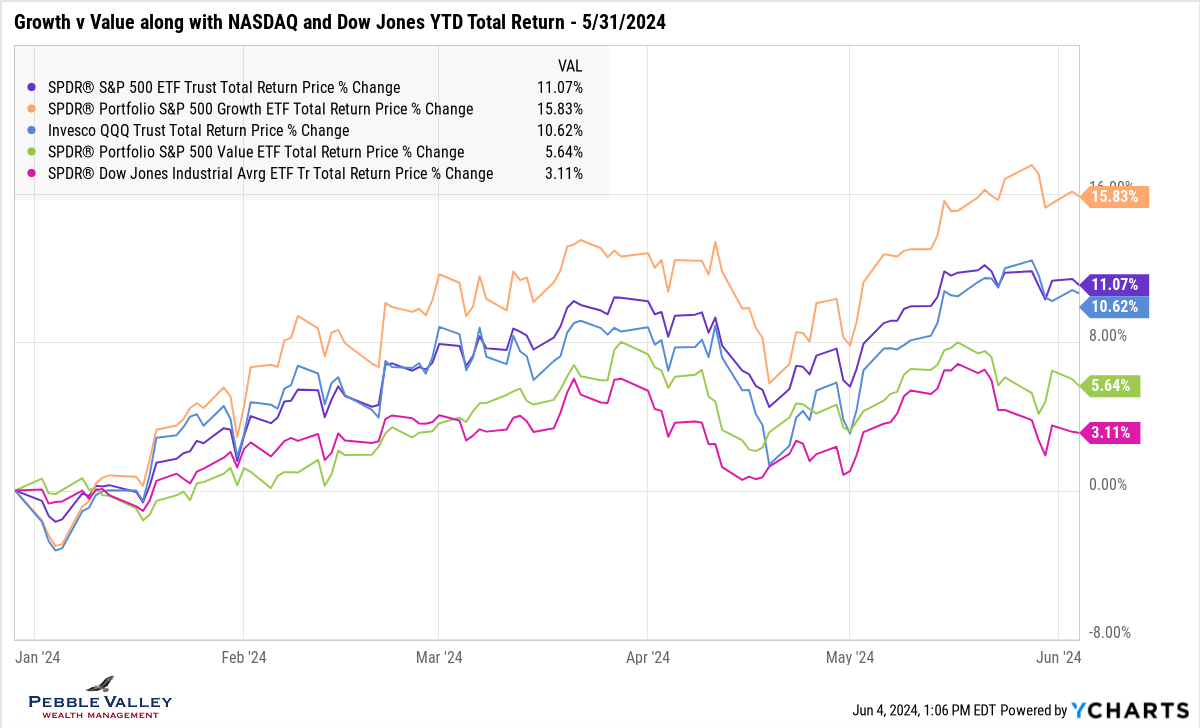
I am adding an extra graph this month to revisit the “Growth vs. Value” breakout. You may recall calendar year 2023 experienced a wide dispersion between the two, especially depending on a which ETF used (very large dispersion with Vanguard ETFs). While not precise, common indices that capture this are Nasdaq (Growth) and Dow Jones Ind Avg (Value) which saw a very wide 39% return difference in 2023. The first quarter of 2024 saw this Growth vs. Value dispersion continue, but the difference started to collapse during April. However, the strong run in May was quite concentrated in the Growth sector again. The graph below shows not only the overall S&P 500 and respective Growth vs. Value ETFs, but also the Nasdaq and Dow Jones Ind Avg (DJIA) ETFs. The Nasdaq is not running away like the Growth ETF is, but the DJIA continues to lag in line with Value (and has many fewer names that are price-weighted).
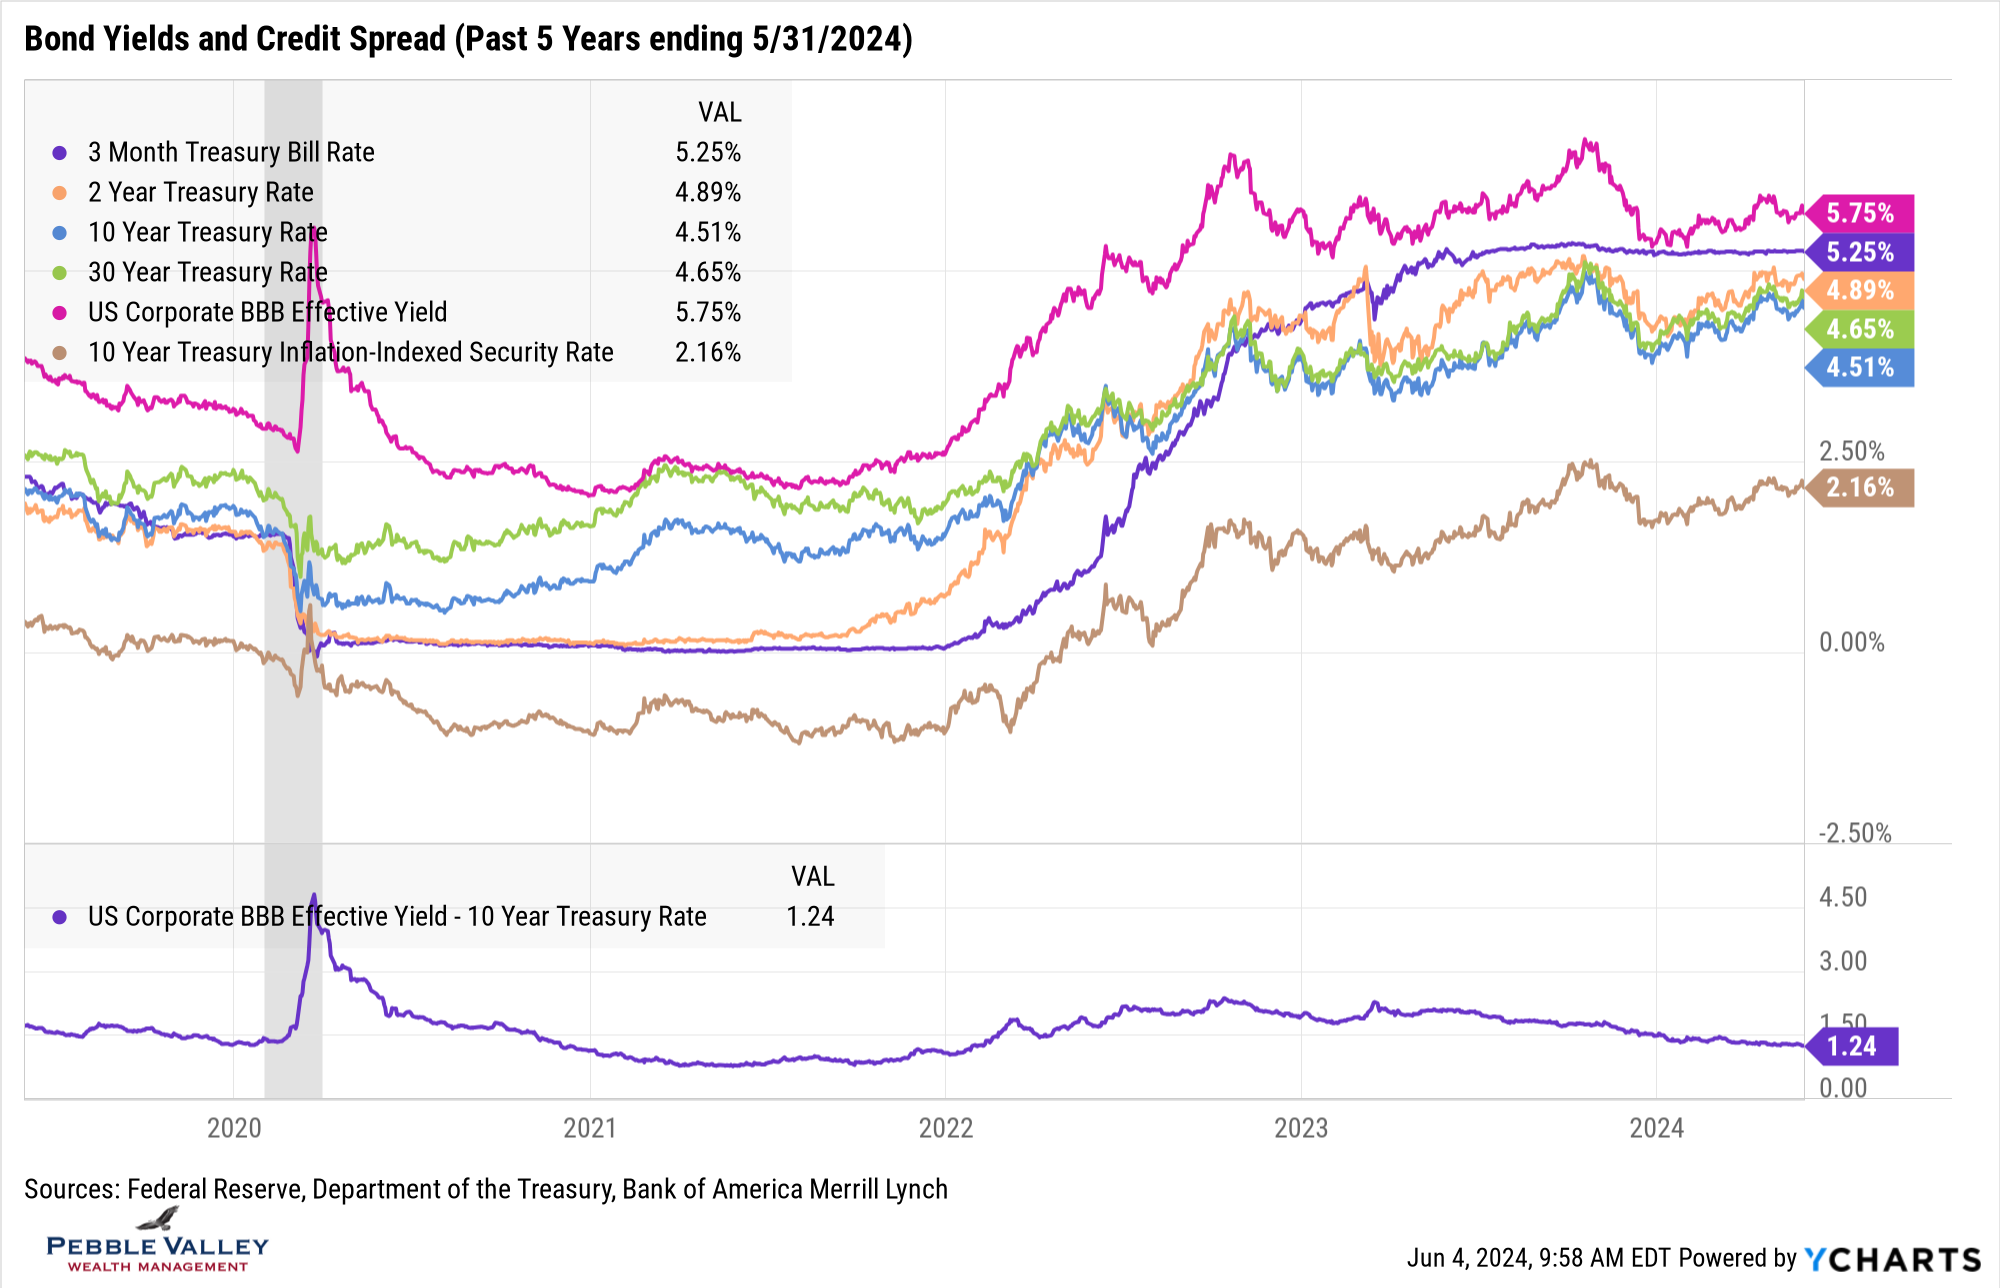
For the “rates graph”, recall last month I showed the usual Treasury Rates followed by a separate corporate spreads graph. This month I combined the two and now include a BBB-Rated corporate yield along with Treasury Rates and at the bottom show the difference between the BBB yield and 10-year Treasury Rate to capture an approximate credit spread. The credit spread is the extra yield received to take on credit risk – i.e. the possibility of not getting all your money back. When this spread is low – called tight credit spreads – you are not getting paid as much to take that extra credit risk and may consider “going up in quality”. 3-month TBills continue to earn in the 5.25+% area as the Fed remains on hold. Other Treasury yields shown were down in yield (up in price) for May after hitting YTD relative peaks at the end of April. Yields were starting to march back higher mid-month but reversed course toward the end of May (and continued into early June).
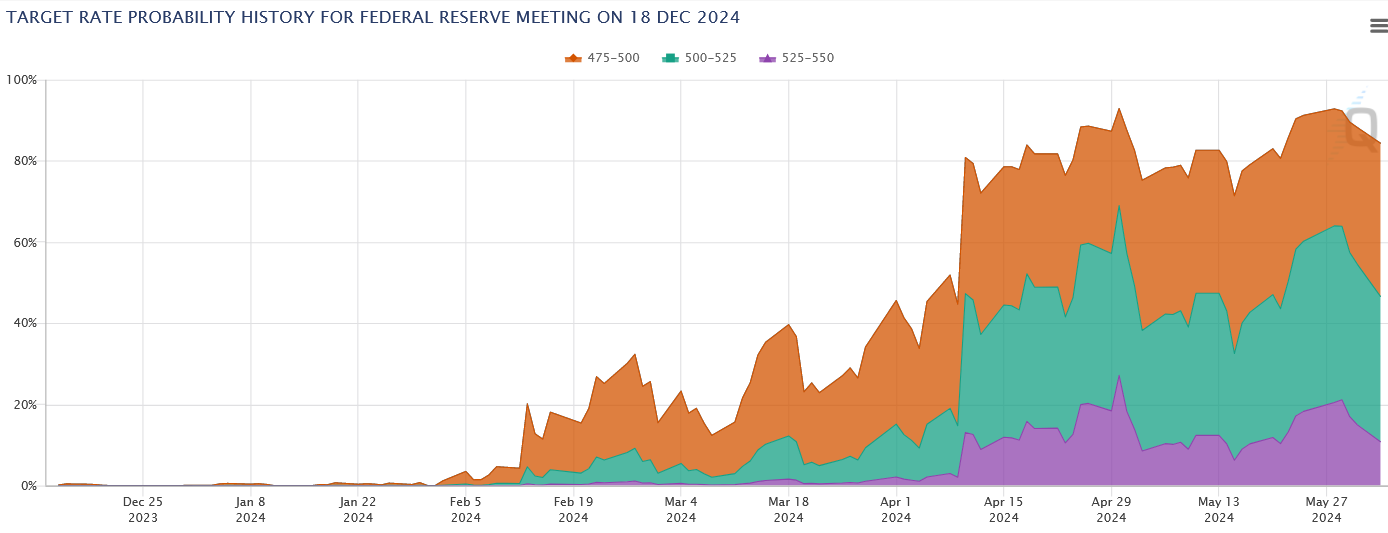
The next FOMC meeting concludes June 12th. There is no rate cut expected but the Fed’s latest Summary of Economic Projections (released 4 x’s per year) will be released. Since the last FOMC meeting, inflation readings were initially coming in higher than expected removing the likelihood of many rate cuts in 2024. The April jobs report and latest CPI and PCE inflation readings shifted some market participants to expect at least one and possibly two 0.25% rate cuts by the end of 2024. The CME Fedwatch Tool below (Source: cmegroup.com) shows the implied probability of none (purple), one (green) or two (orange) rate cuts. The CPI print in early April kicked off the rate cut expectations action while the PCE release in late May expanded the possibility of two rate cuts – the orange band.
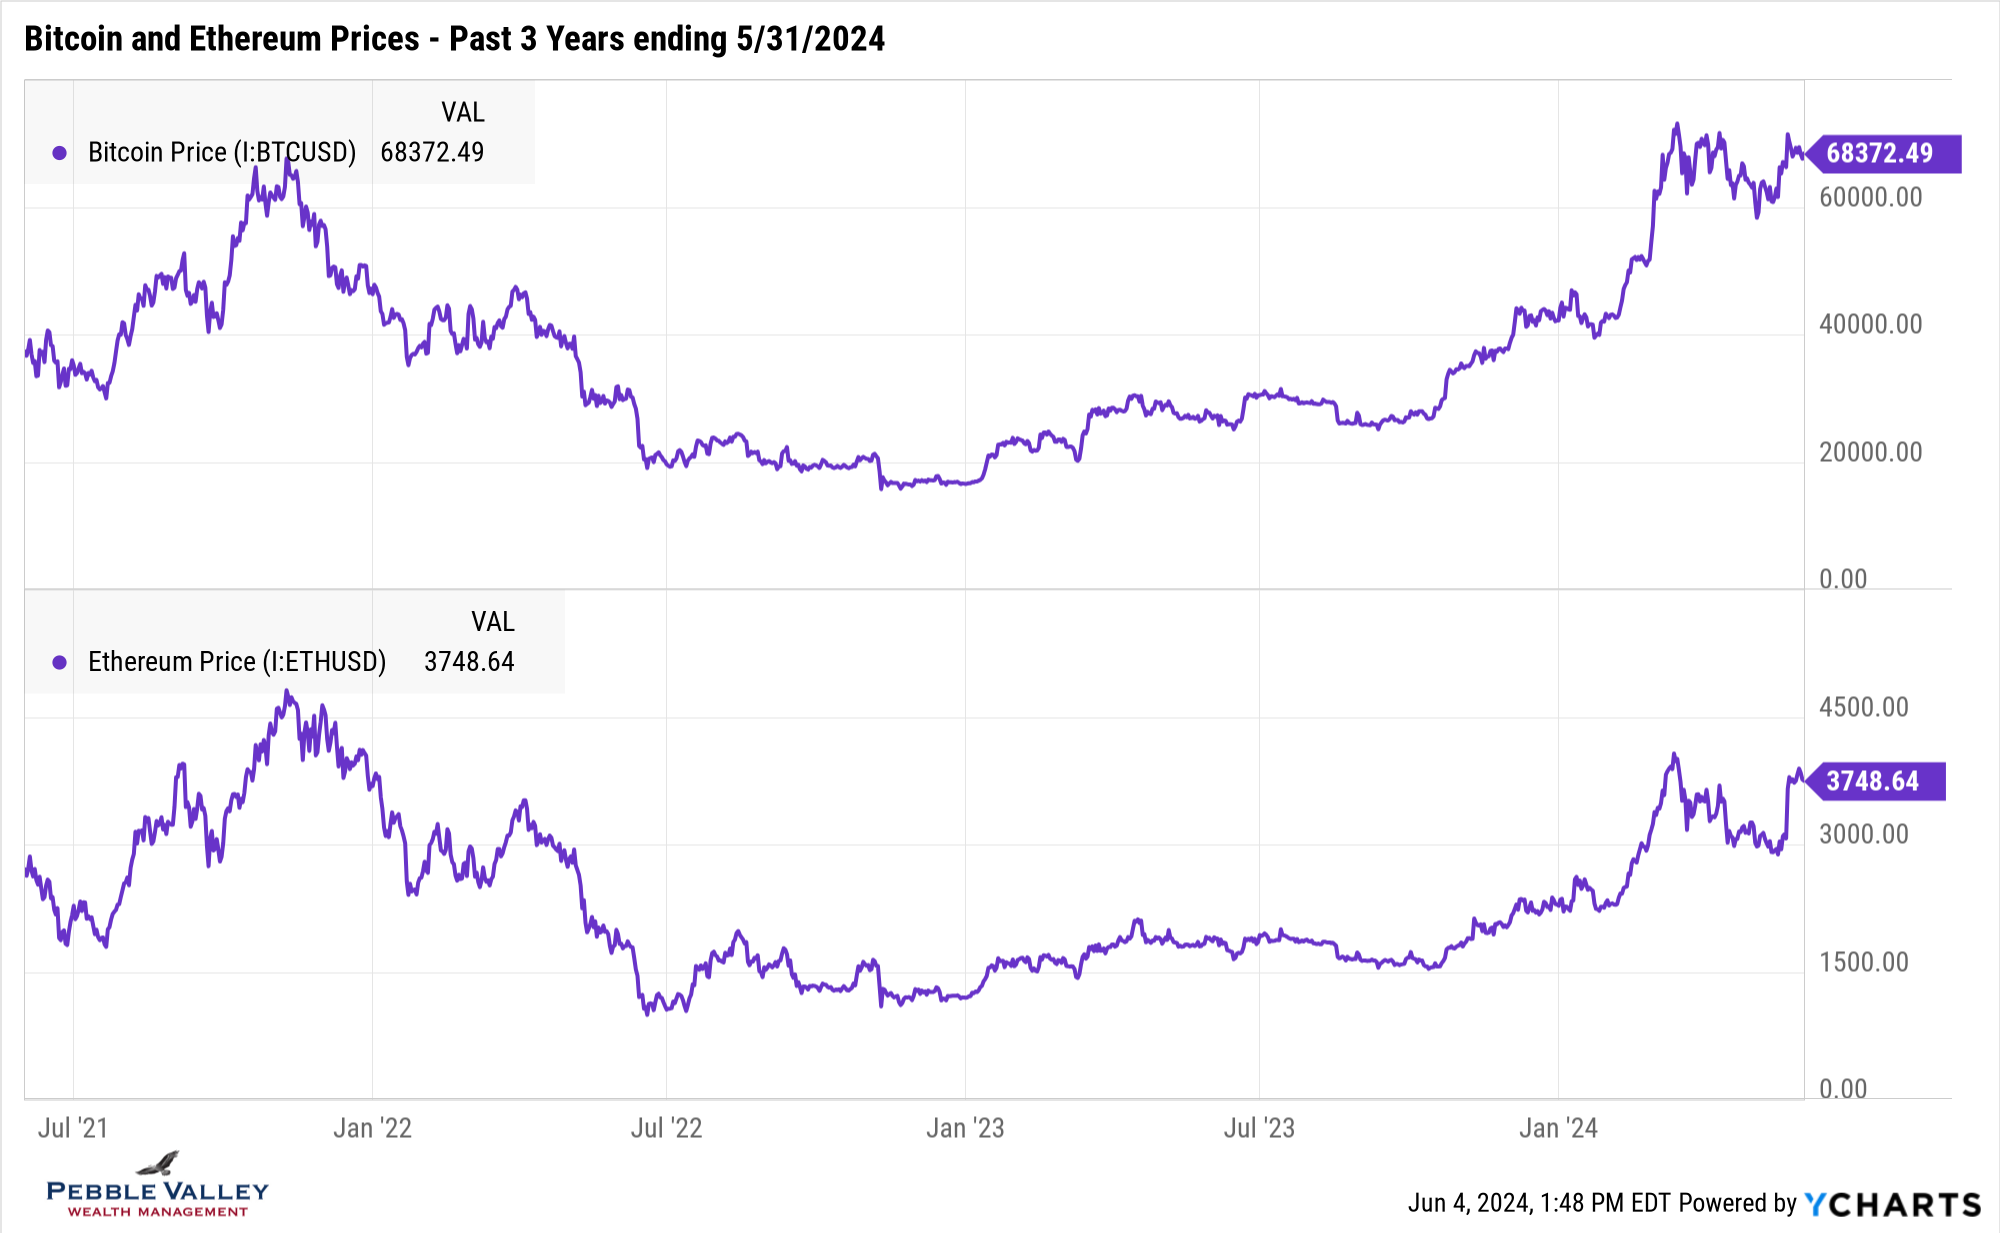
My special topic this month is crypto. My last dedicated blog post was back in November 2022 after the collapse of FTX. Since then the crypto market not only survived this eighth or ninth or tenth shock to the crypto market, but also recovered nicely into the fall of 2023. Then the major development was the potential for approval of a spot Bitcoin ETF after years of regulatory uncertainty (already futures-based Bitcoin and Ethereum ETFs). Crypto prices rose in advance of the actual Bitcoin ETF approval on January 11, 2024. Prices continued to move higher as demand increased, though took a pause after relative peaking in early March. Markets shifted its attention to when the spot Ethereum ETF would be approved. Given the inaction of SEC leading up to a May 23 deadline, market participants expected no approval until the end of 2024 at the earliest. However, there was a complete 180 degree turn on the views of the SEC a week before the deadline and the SEC approved the first part of an Ethereum ETF after ‘staking’ features were removed. The second phase of approving each issuers’ filings are now in progress and trading in these new ETFs is expected in weeks rather than months. Not only is this a fundamental shift in the regulatory treatment of crypto but with these approvals, could come additional demand for this nascent asset class.
Happy summer – officially later this month. Enjoy the hopefully slower schedules and a few more ice cream cones!
Posted by Kirk, a fee-only financial advisor who looks at your complete financial picture through the lens of a multi-disciplined, credentialed professional. www.pvwealthmgt.com