

Asset Class Returns - 5/31/2022
Here is this month’s market summary. Unless noted, the time frame is year-to-date with screen shots through end of day 6/1/2022.
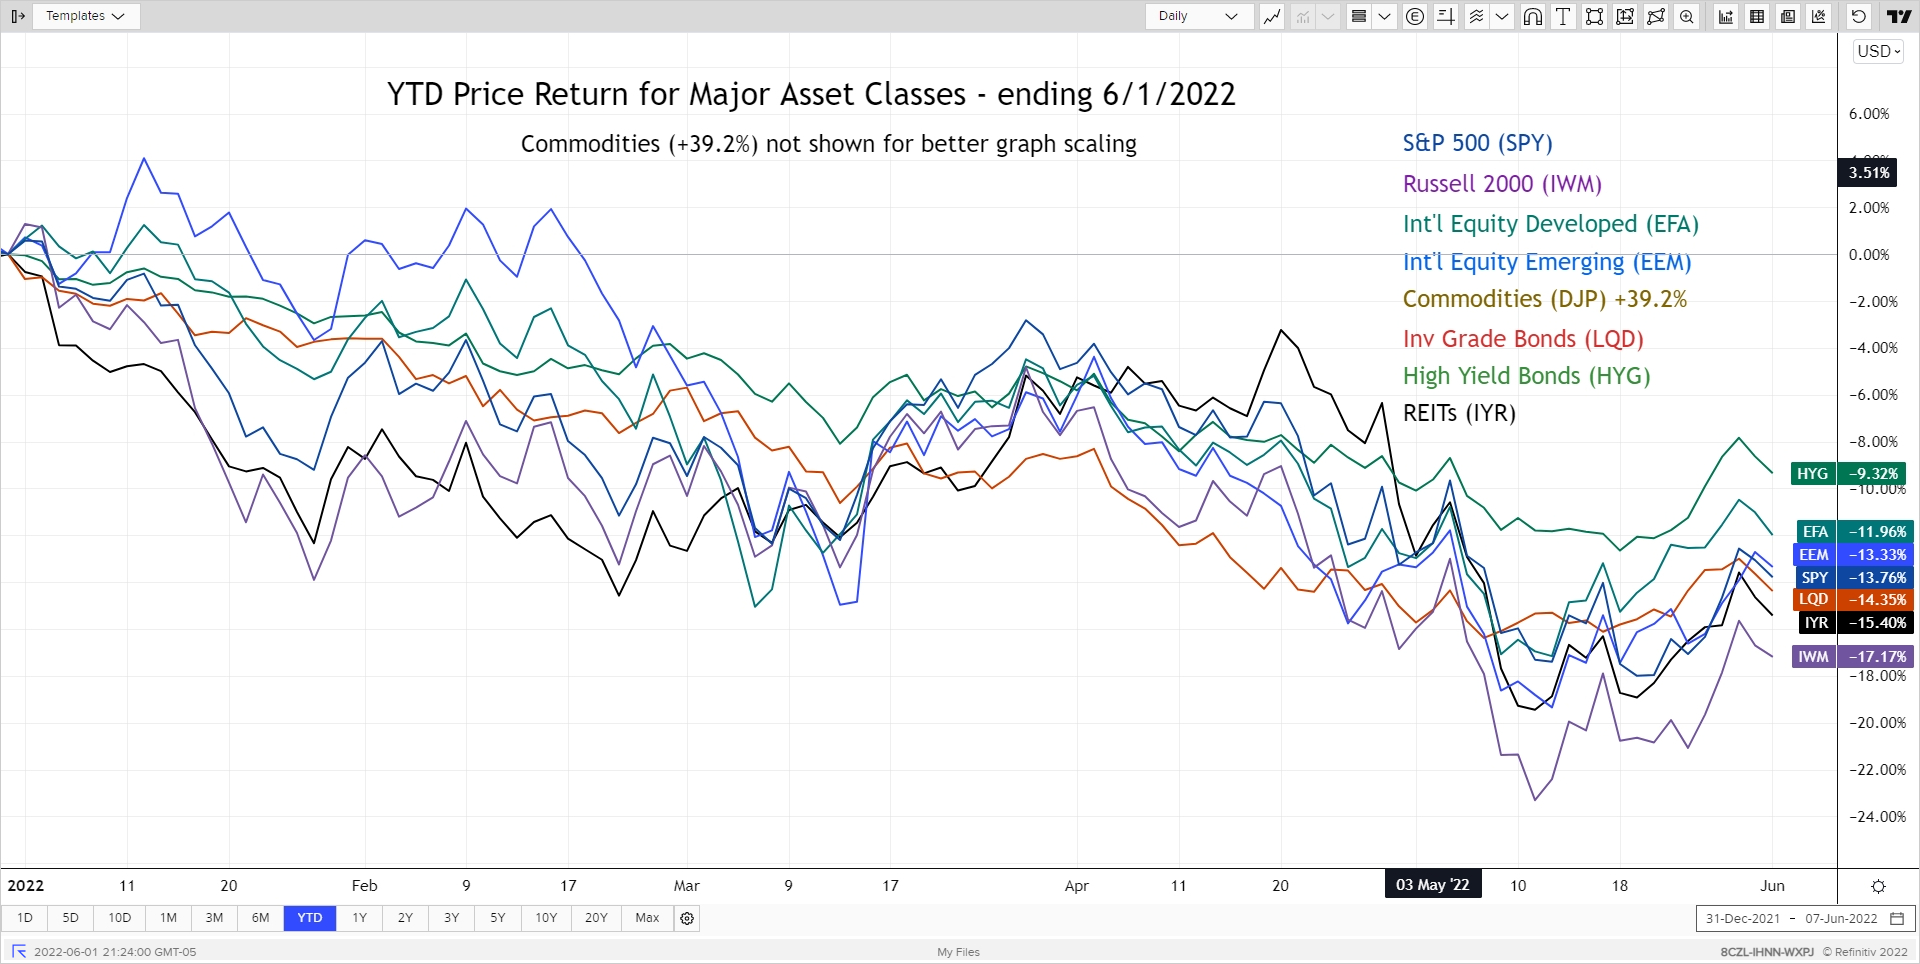
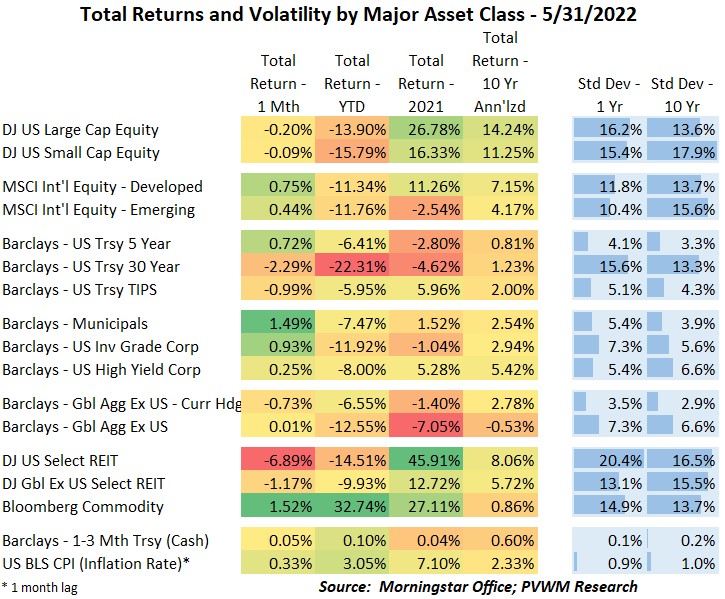
Let’s start with the major asset classes viewed on a YTD basis. I normally include Commodities but with the +39.2% YTD return (using DJP), I excluded this month for a more refined graphing view. US equities were flat for the month and international equities up slightly, leaving the YTD returns bunched up in the -13% area. The exception are US Small Caps which are down about -17% (using IWM). REITs had a rough run since relative highs (but still negative) in late April. For the month alone they were down about -7% bringing YTD returns toward the bottom of the asset class pile. Except for short maturities, Treasuries saw another negative month bringing the long maturity (30-year) Treasury index down -22% YTD. That is what extremely low rates with extended durations from last year will do.
This month I am showing a sector chart (excluding Energy, +59% YTD) along with Growth and Value. The outperformance of Value over Growth remains a wide 21+%. You can see the related sectors around each. One sector that has surprised me this year is Utilities. I expected quite negative returns with rising rates but that is the second best performing sector after Energy – with a positive YTD return!

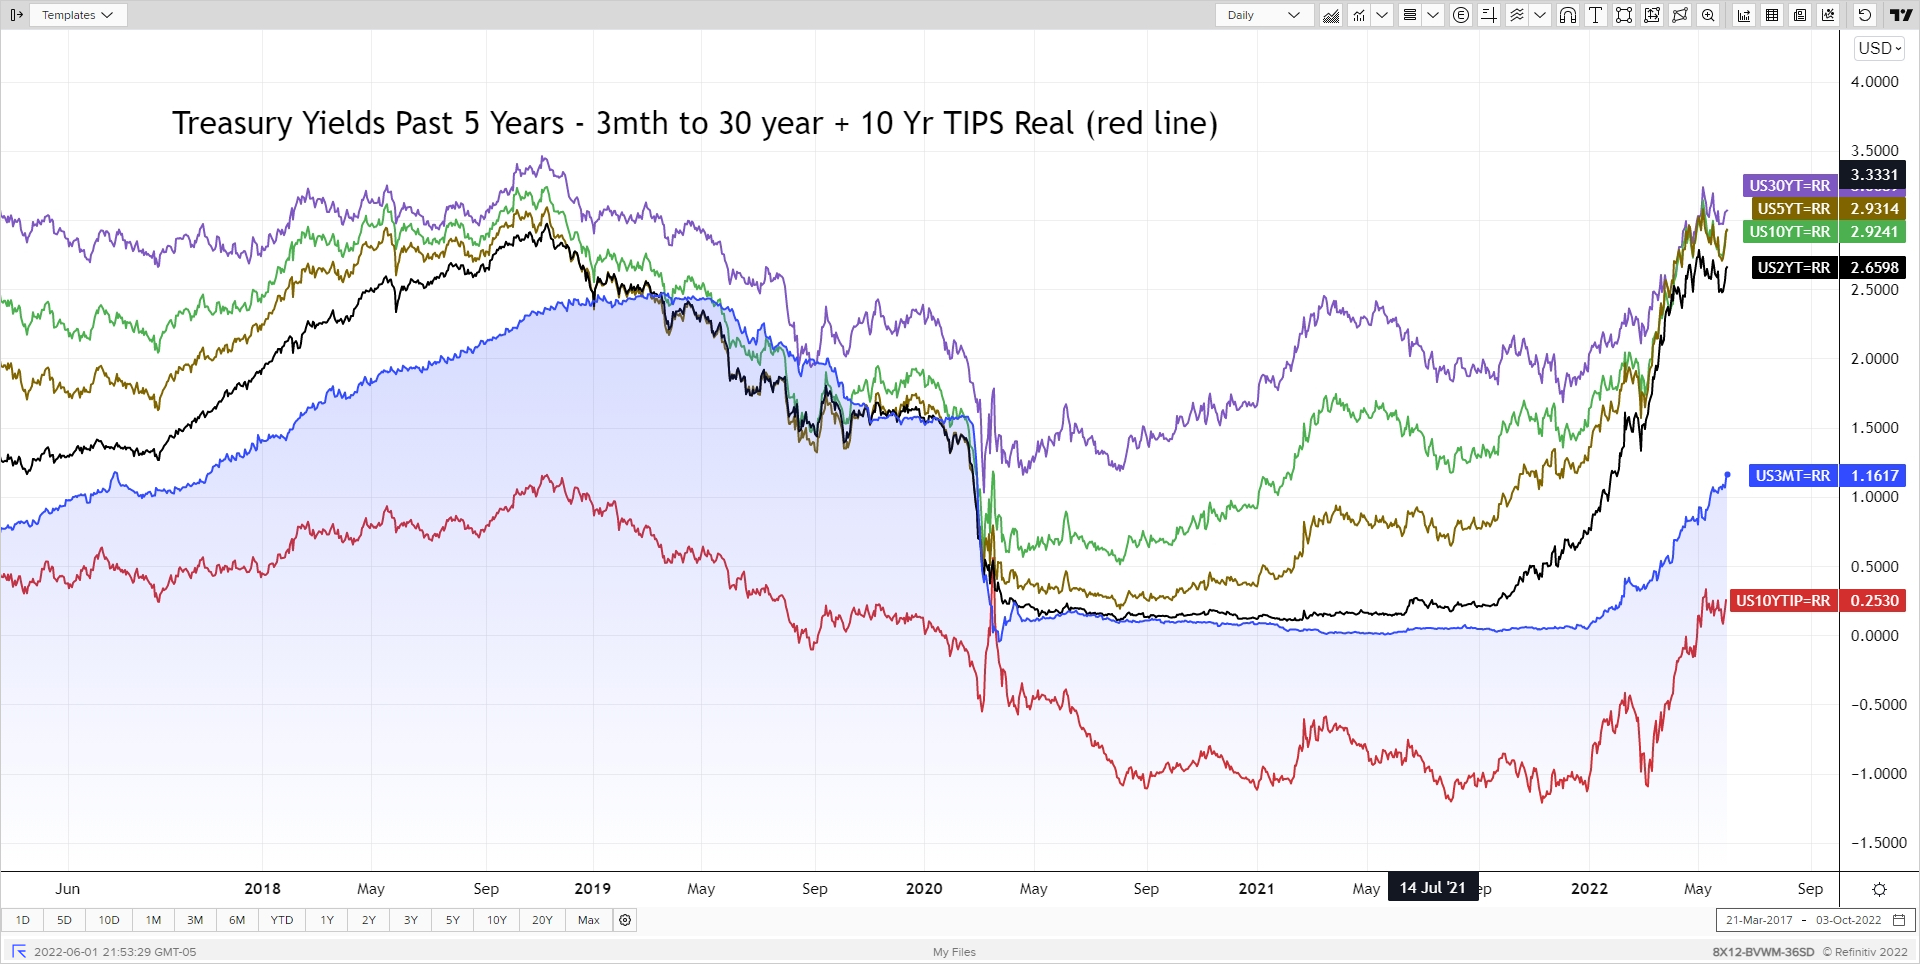
The usual Treasury rate graph always has something unusual the past six months. In addition to capturing the jarringly rapid rate rise in 2022, a few unusual things to note this month:
- 3-month Treasury Bill yields now have a 1-handle! 1.16% to be exact. As I mentioned last month, there is more love coming from the Fed for those looking for yield in the safe end of the pool.
- 10-year real yields remain in the positive zone at 0.25%. Even 5-year real yields are close to 0.00% after being almost -2.00% less than 6 months ago. Those are some big moves. See the May PVWM Newsletter for an article on how this impacts equity valuation.
- Note how the 2-year rate drifted back down after the May 4 FOMC meeting when the Fed indirectly took a 0.75% rate hike off the table (though got behind a couple more 0.50% hikes). On the other end of the curve, the 30-year rate held above 3.00%.
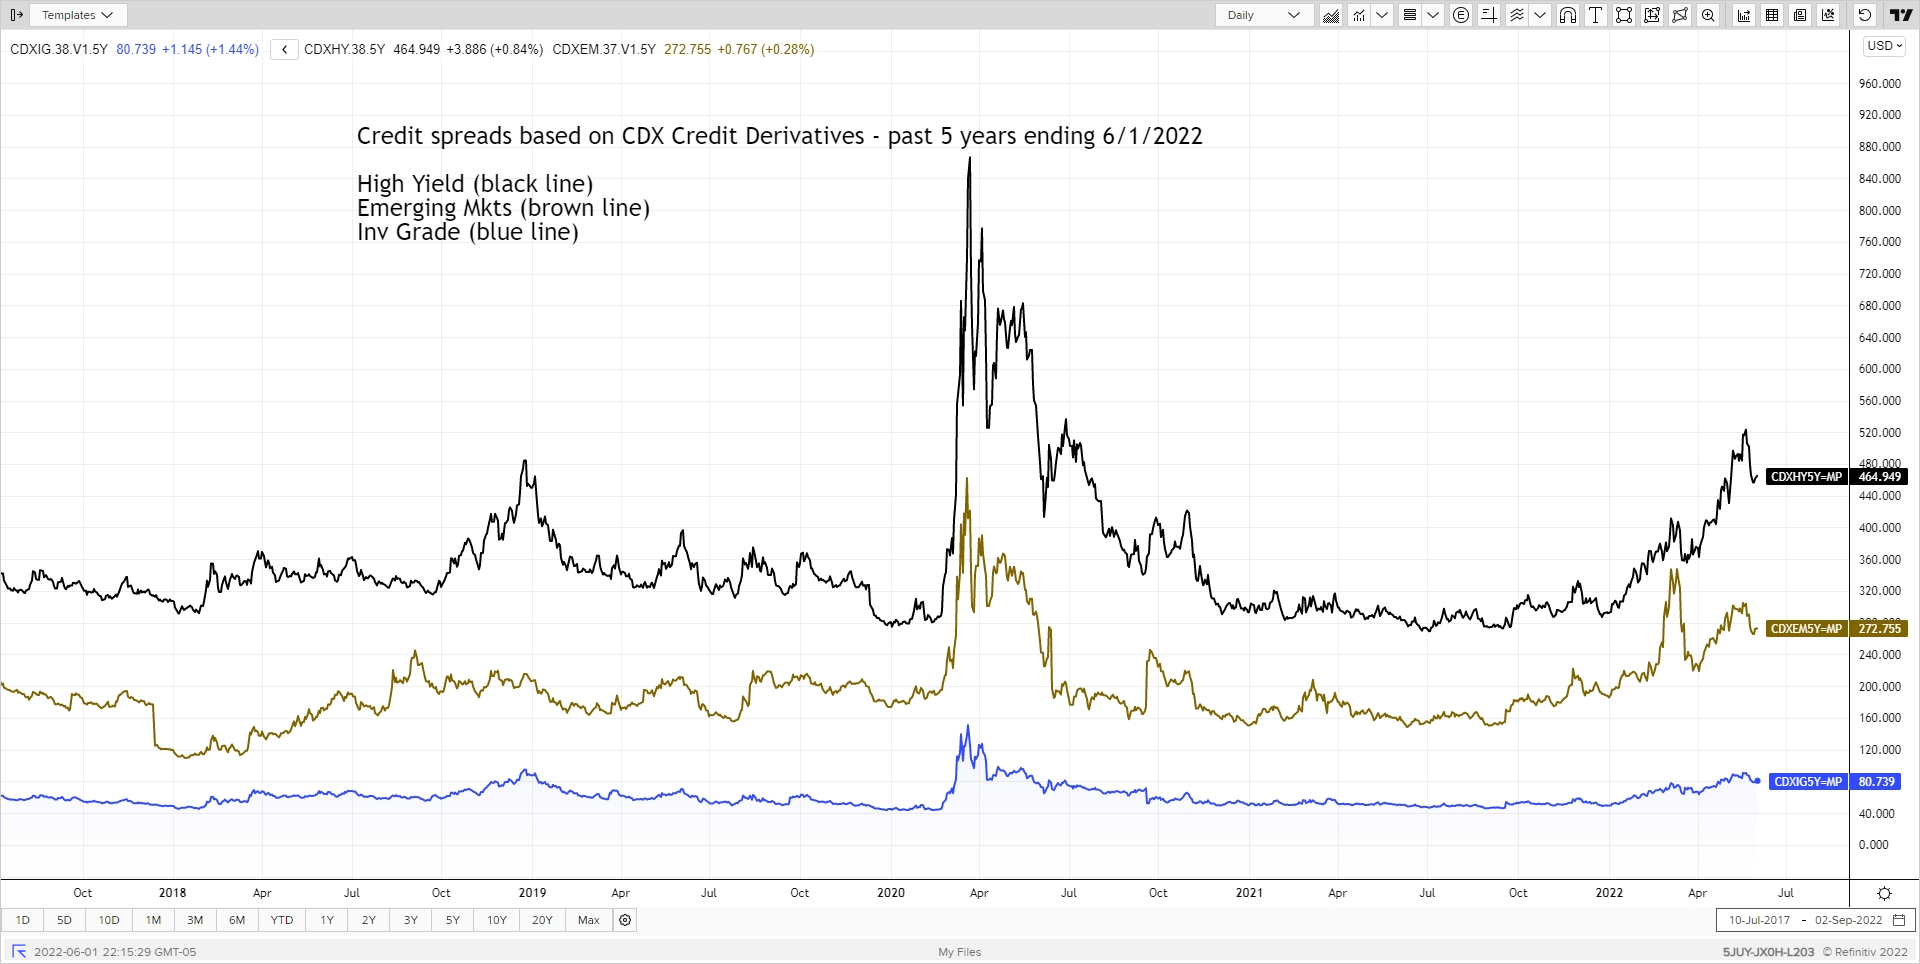
Up until early April the credits markets were relative calm based on the continued relatively low credit spreads (the extra yield paid to take credit risk). Since then however spreads have begun to widen as concerns of recession increased. Investment Grade credit only widened about 13bps based on CDX credit derivative index but high yield widened about 150bps (1.50%) mid-month before settling in at +90bps for the month. Not a panic mode by any stretch but noticeable moves from the bond market after being relatively muted YTD while equities were selling off.
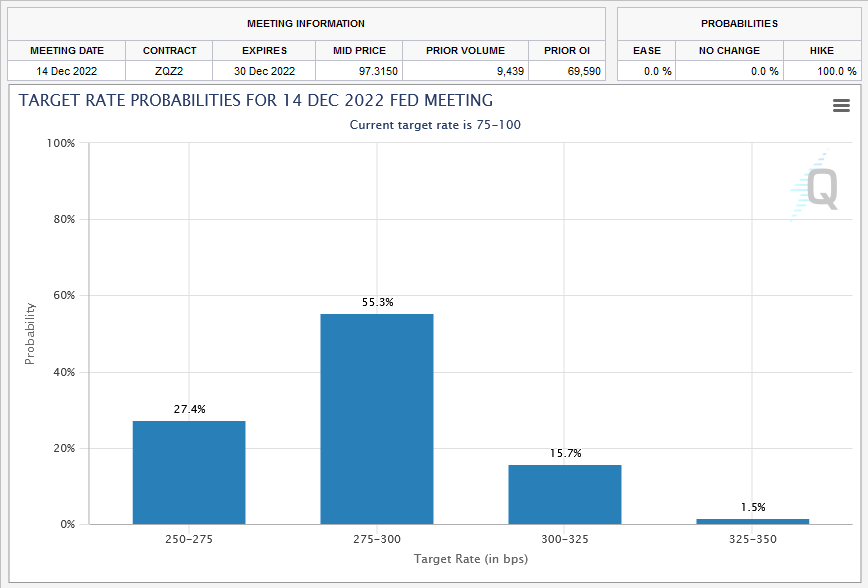
Regarding the Federal Reserve and FOMC meetings, the May 4th meeting concluded with a 0.50% rate hike. The Fed also announced plans to reduce the balance sheet by not reinvesting up to $30 billion/month in treasuries and $17.5 billion/month in mortgage-backed securities starting June 1. Those monthly numbers will increase (allow more bonds to run off) to $60 billion and $35 billion respectively after three months. During the press conference Fed Chair Powell indicated the Fed was not likely to move 0.75% at a future meeting but did say at least a couple more 0.50% hikes are likely. The next meeting concludes June 15th. The futures market is pricing in a likely Fed Funds rate by year-end of between 2.5% - 3.00%, up from the current 0.75% - 1.00% range (Source: CME FedWatch – 6/1/2022).
Happy unofficial start to Summer! For those living in the northern parts of the US especially, grab each day!
Posted by Kirk, a fee-only financial advisor who looks at your complete financial picture through the lens of a multi-disciplined, credentialed professional. www.pvwealthmgt.com