

Asset Class Returns - 4/30/2026
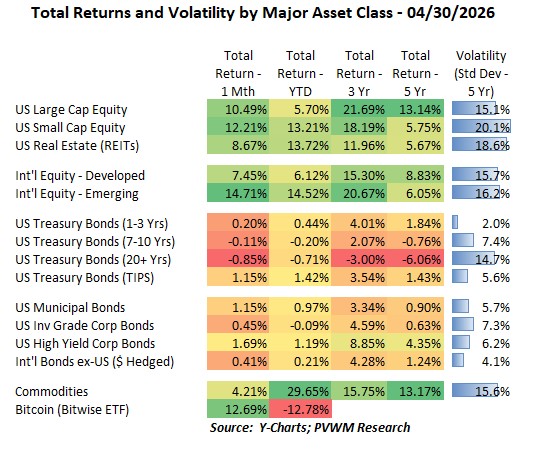
Risk-on was the theme in April after a strong start to the earnings season which outweighed global uncertainty in Iran and potentially higher rates for longer.
Looking at the table above, one could be mistaken to think the 1-Month returns are for a full year. Only Treasury bond returns were negative. Credit spreads tightened enough to put a “+” sign in front of the corporate bond indices. There is still plenty of uncertainty with the war in Iran and Treasury rates keep marching higher, but most major indices are now above levels seen just before the war in Iran started. Here are a few things to highlight for the month.
- US Large and Small Caps were up +10.5% and +12.2% respectively, through Large Caps lag YTD
- US REITS were up through not as much, but lead the US equity YTD return column
- Int'l equities also joined the party but Emerging had more fun as their relatively low valuation got investors' attention while Developed markets faced potentially higher interest rates
- Treasury returns were down slightly as rates rose modestly; credit spreads tightened noticeably, especially for B-Rated spreads (High Yield) that tightened over 65 bps
- Commodities continued marching higher driven by Energy again, though not as strong as March. Take a look at those YTD returns on +30%!
- Bitcoin is up again, having the second highest return for the month - though lowest YTD. Solid fundamentals and buying demand from the company Stratgey to back their income notes were drivers.
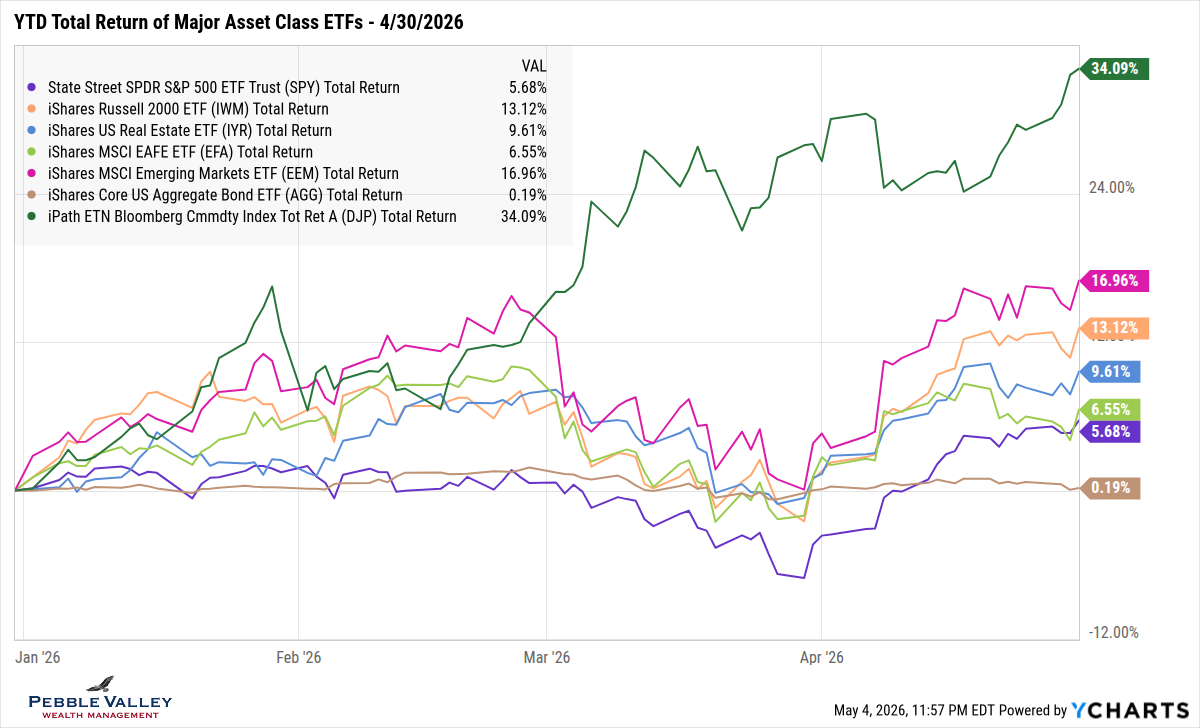
The first graph below shows total returns of the major asset class ETFs. After the pullback in March, most major indices are back above levels seen just before the Iran war in late February. The only exception is Int’l Equity Developed and US Aggregate Bonds.
- Commodities (dark green) did NOT see a pullback in March but kept on marching in April with the rest of the market
- Emerging Markets (magenta) reestablished the YTD lead among equity indices
- US Large Caps remain the lowest YTD among equity indices, though back in the same pack as Int’l Developed
- Rising rates continues to chip away at the coupon income from bonds, though hanging on to a slight positive total return (income + price change) on YTD basis.
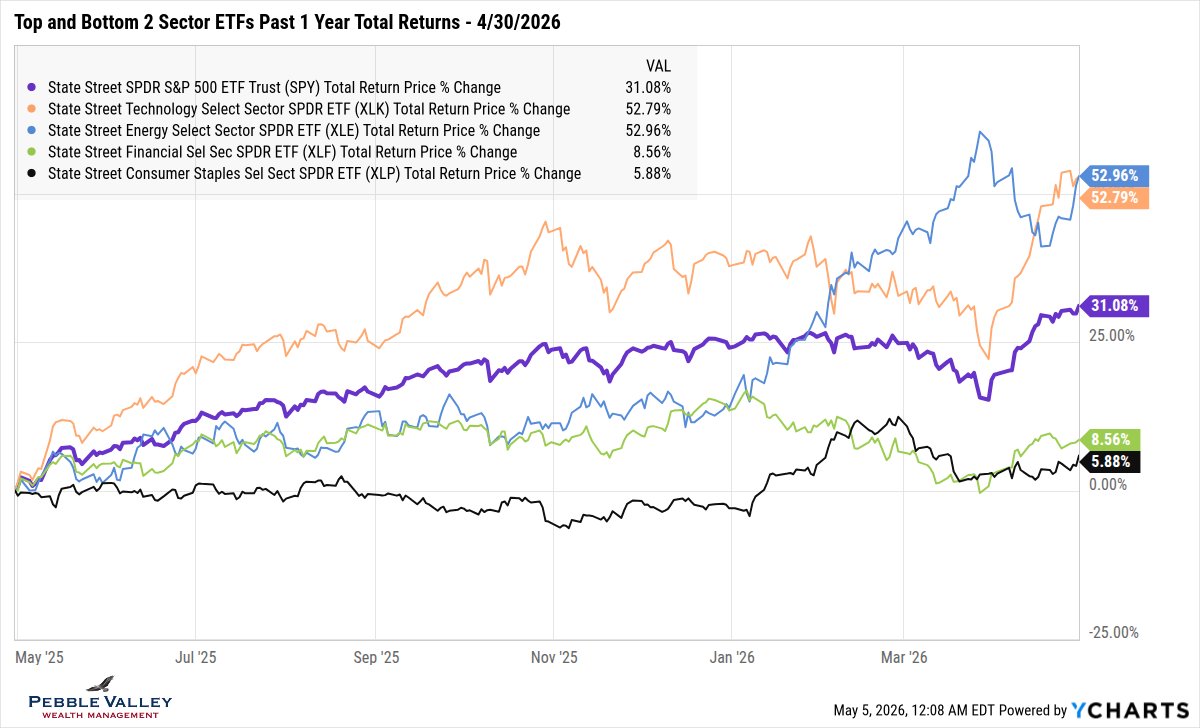
The “focused graph” this month shows the top and bottom two sector ETFs over the past year – along with overall S&P 500 returns. The Technology sector (and Momentum at Factor level) saw close to +20% returns in April. Energy is also up strongly over the past year but most of those gains occurred in the first three months of this year. On the underperforming (though still positive) side, Financials got caught in the Private Credit concerns early in the year and the safer, defensive Consumer Staples are left behind when Momentum is so strong. One thing to note when looking at Sector returns is the relative market cap weighting in the S&P500. Of the top two performing sectors, Technology is an eye-popping 35+% weight while Energy is less than 4%. On the low performing side, Financials make up about 12% while Staples are under 5%.
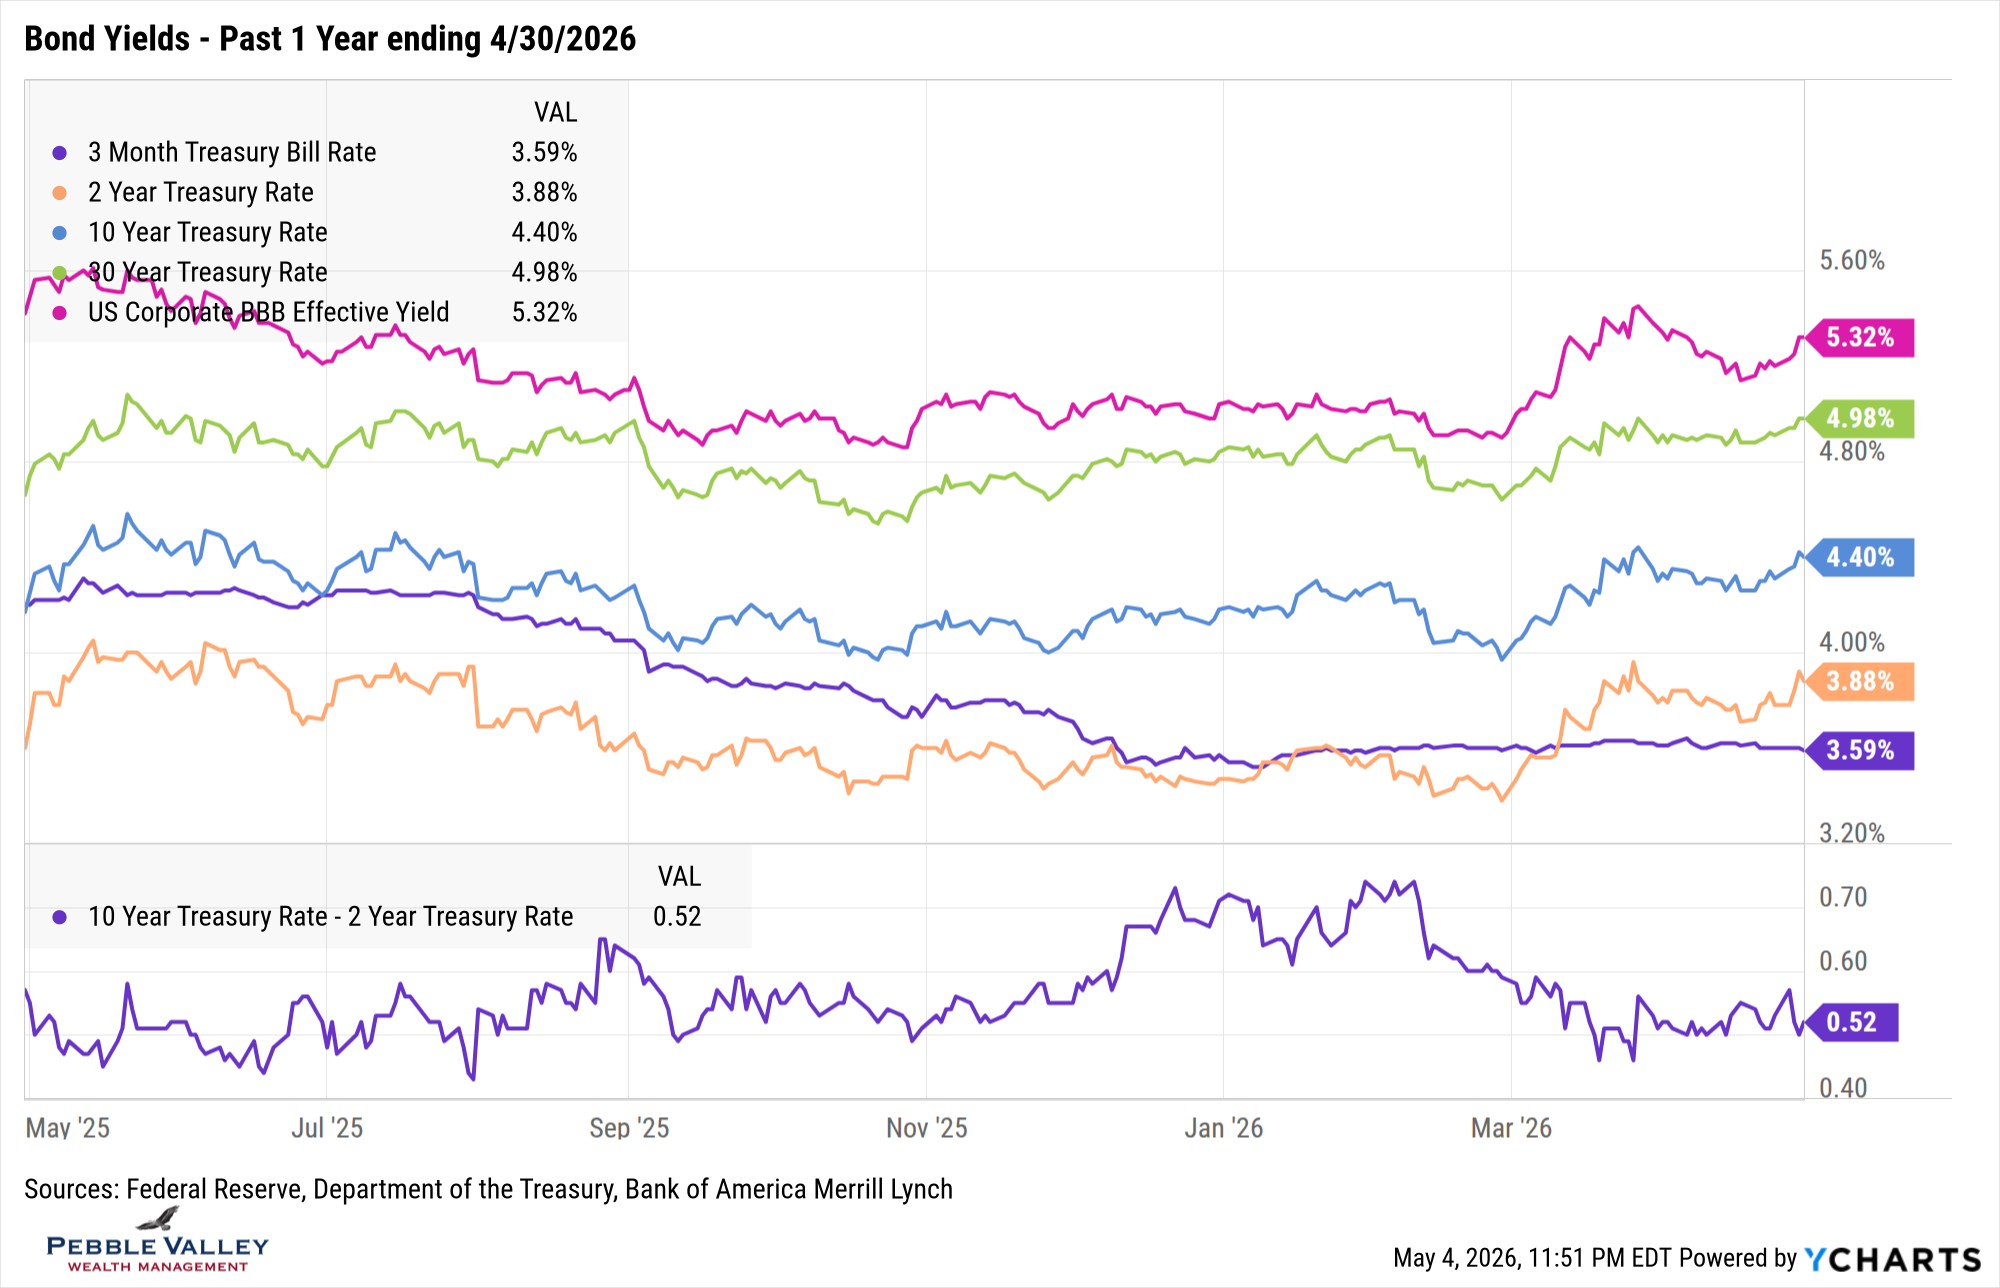
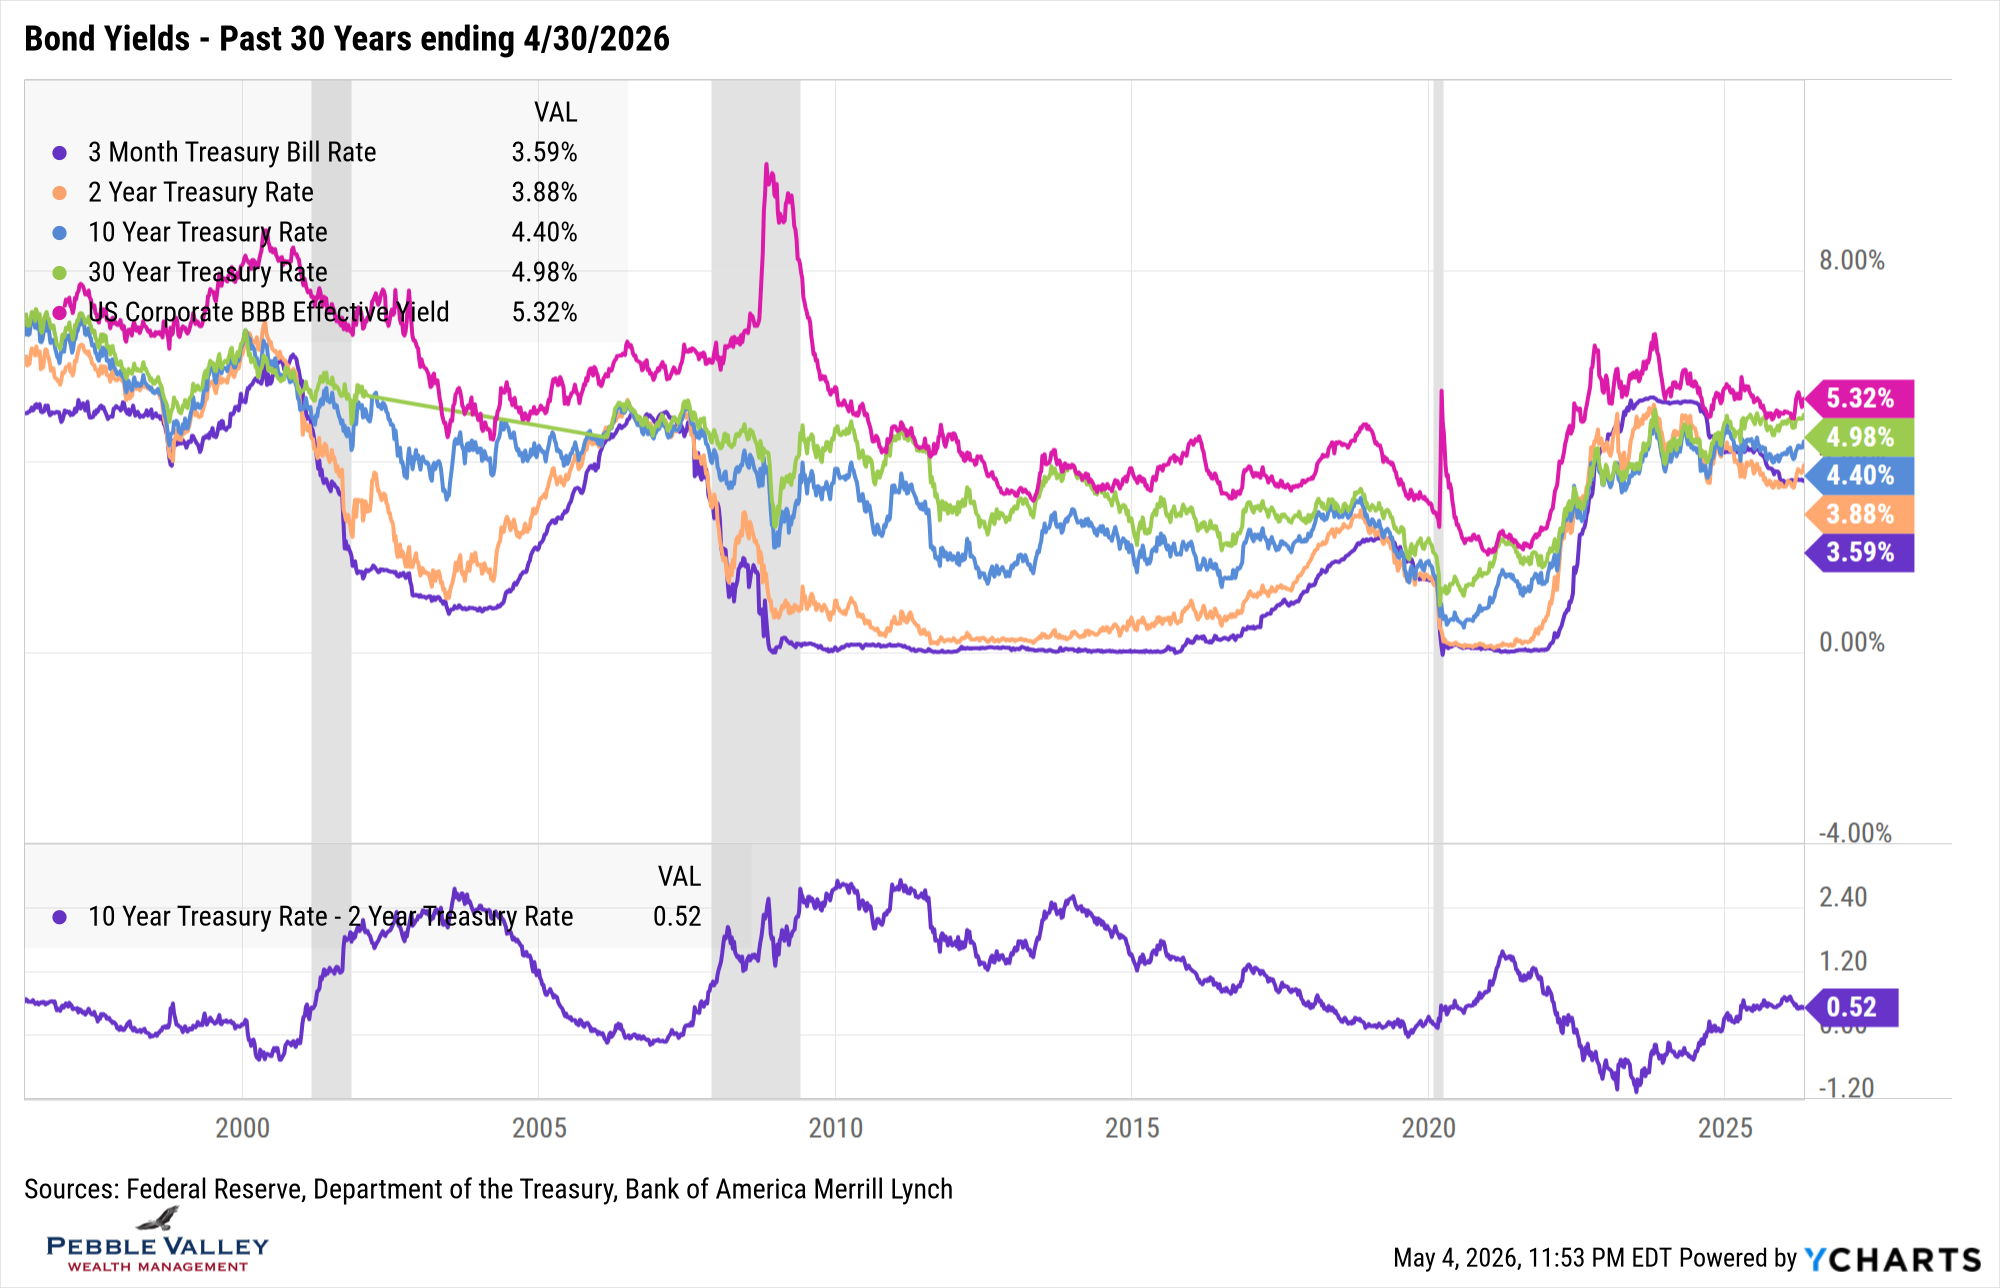
Next are the bond yield graphs over the past one- and thirty-year time frame. Here is what caught my attention this month:
- Rates initially fell during April but ended the month drifting higher
- 2-year rates began marching back toward 4% though remains short of that level
- 30-year yields at 5% and 10-year at 4.5% are at levels where if they keep going, may shift the sentiment in other markets on the impact of higher rates (I am surprised hasn’t already)
- Hard to see on graph but credit spreads tightened slightly for the month; B spreads (High Yield) tightened over 65bps, reversing much of the March widening.
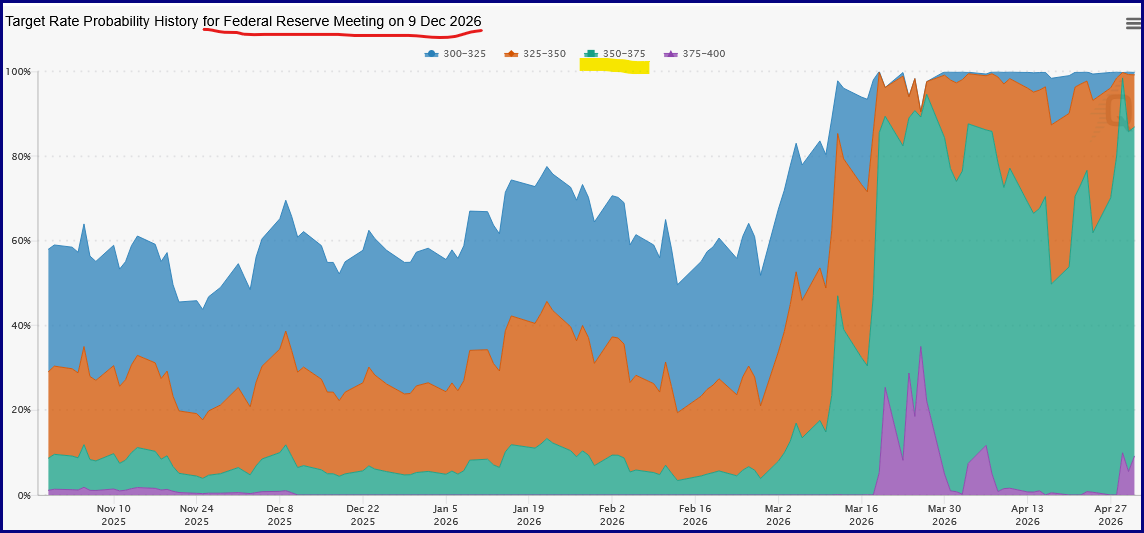
The FOMC meeting concluded on April 29th. As expected, the Fed held rates steady at current 3.50-3.75%. Surprisingly, there were four dissents. The usual Stephen Miran dissented, wanting a rate cut, but three other voting members wanted the statement to reflect a balance of risks to acknowledge the risk of inflation remains present. This was very likely Chair Powell’s last Fed Press Conference as Kevin Warsh will likely be nominated this month. Powell did confirm he will remain on as Fed Governor but in the intended supporting role with the main intent of being on the Fed if legal action resurfaces. Shifting to market pricing, Fed Funds futures are implying the next rate cut won’t occur until late 2027. There was even a chance of a rate hike being priced in late March but then backing off, though it picked up again slightly late in April as seen by the purple part of graph below which shows probability of Fed Funds rate levels by end of 2026 (Source: CME FedWatch, May 4, 2026).
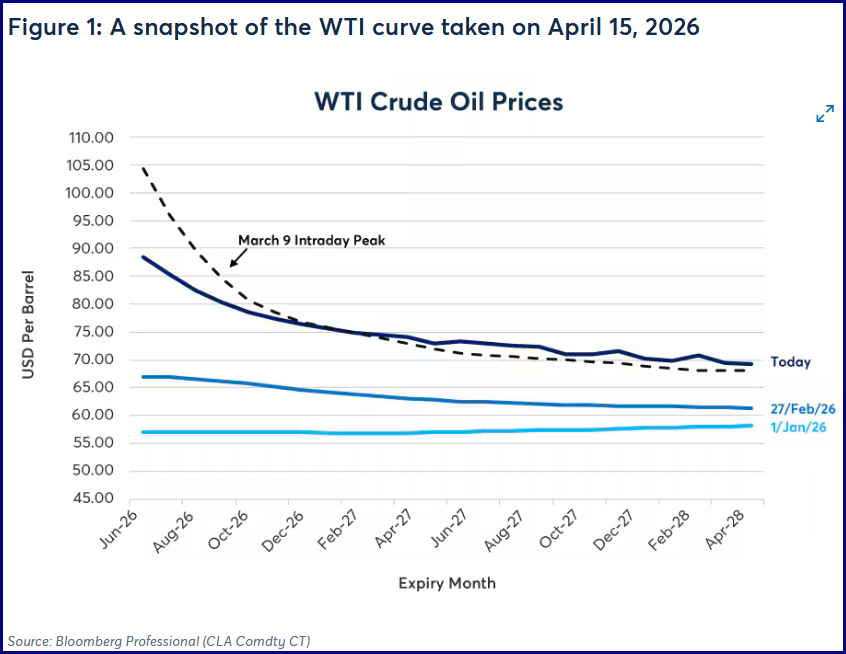
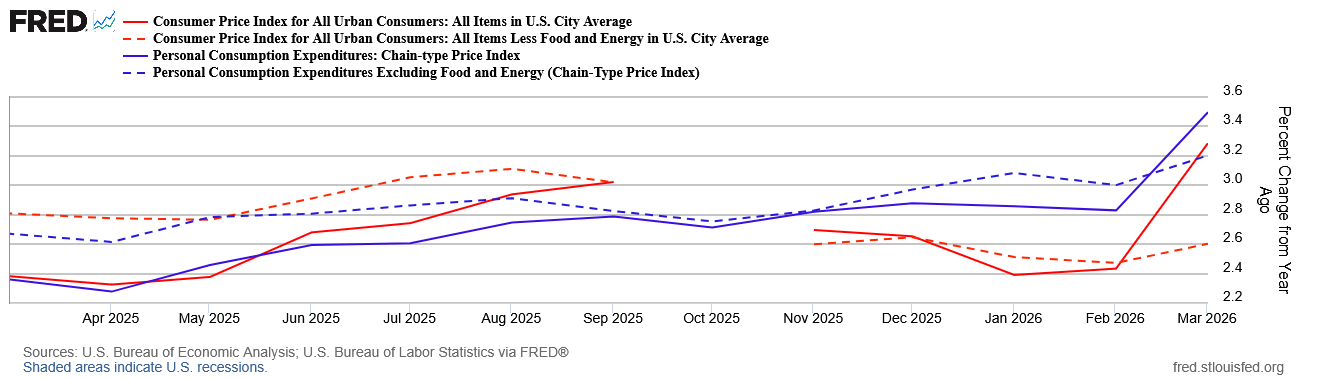
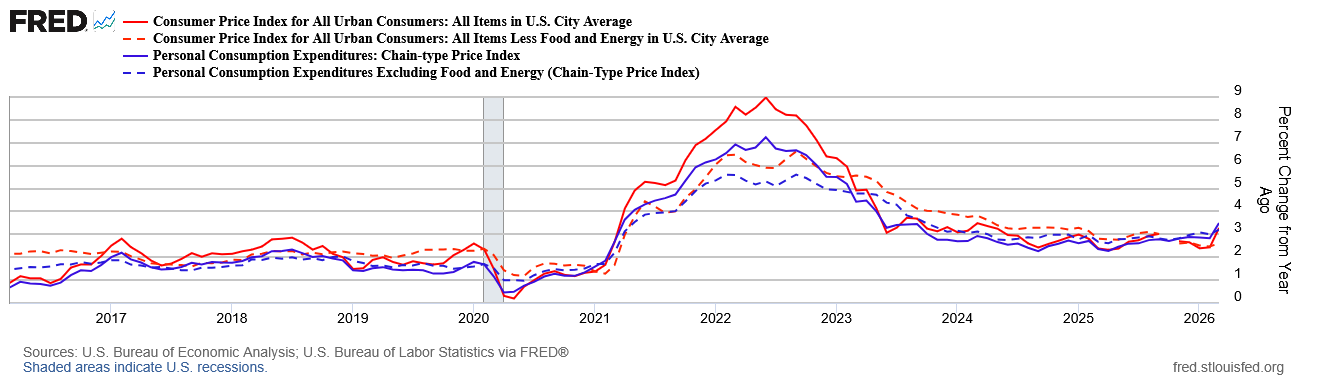
My special topics this month are oil markets again and the latest inflation readings. Last month I showed the forward futures contracts and the premium priced in for delivery of oil near-term vs. in future months. The graph below shows this concept in graphical form but also how much different delivery month contract varied before vs. after Iran war (Source: CME Research paper). Yes, the price of oil is expected to come down, but even the Dec '26 or early '27 contracts are still elevated from where they were at the end of February. The next two graphs show the latest inflation readings - CPI and the Fed's PCE for both headline and core (excluding food and energy). I show the 1-year chart first so you can see the impact on the latest month's reading, followed by the 10-year graph for context. Recall the Fed's preferred PCE level target is down to 2%. Did I mention there were three dissents at the last Fed meeting around inflation?
Happy Mother’s Day to all who celebrate. And we paid our dues in April with the weather so enjoy the May flowers.
Have questions? Reach out! We're happy to help.
Posted by Kirk, a fee-only financial advisor who looks at your complete financial picture through the lens of a multi-disciplined, credentialed professional. www.pvwealthmgt.com