

Asset Class Returns - 4/30/2025
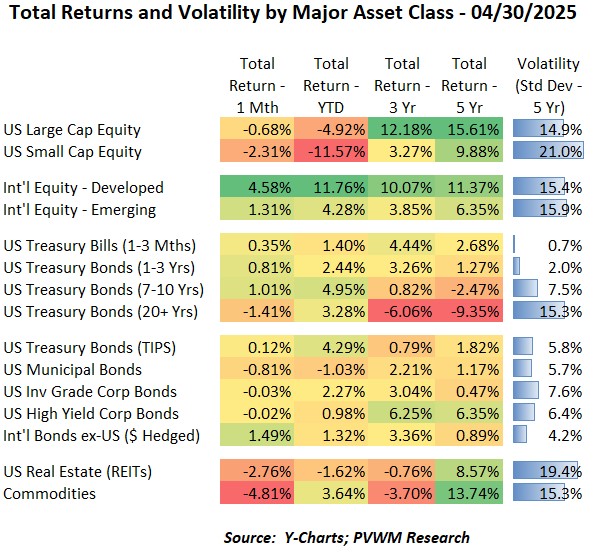
Looking at the table above, only a few of the major asset classes had large swings in monthly returns. There was much volatility during the month however, which is best captured in the graph below. But first a few comments on the table above.
- US equities were down slightly for the month with Large Caps holding up better than Small Caps; YTD the dispersion is much wider at -4.9% and -11.6% respectively
- International equities are just the opposite showing positive returns; Developed markets were the outperformers over Emerging, with YTD levels of +11.8% vs. 4.3%
- The most pain for the month was seen in Commodities – driven by Energy – but they are still hanging on to a nice +3.6% return YTD
- Bond returns were relatively muted, though long maturity Treasuries were down as only a slight increase in rates can bring negative total returns with such long duration.
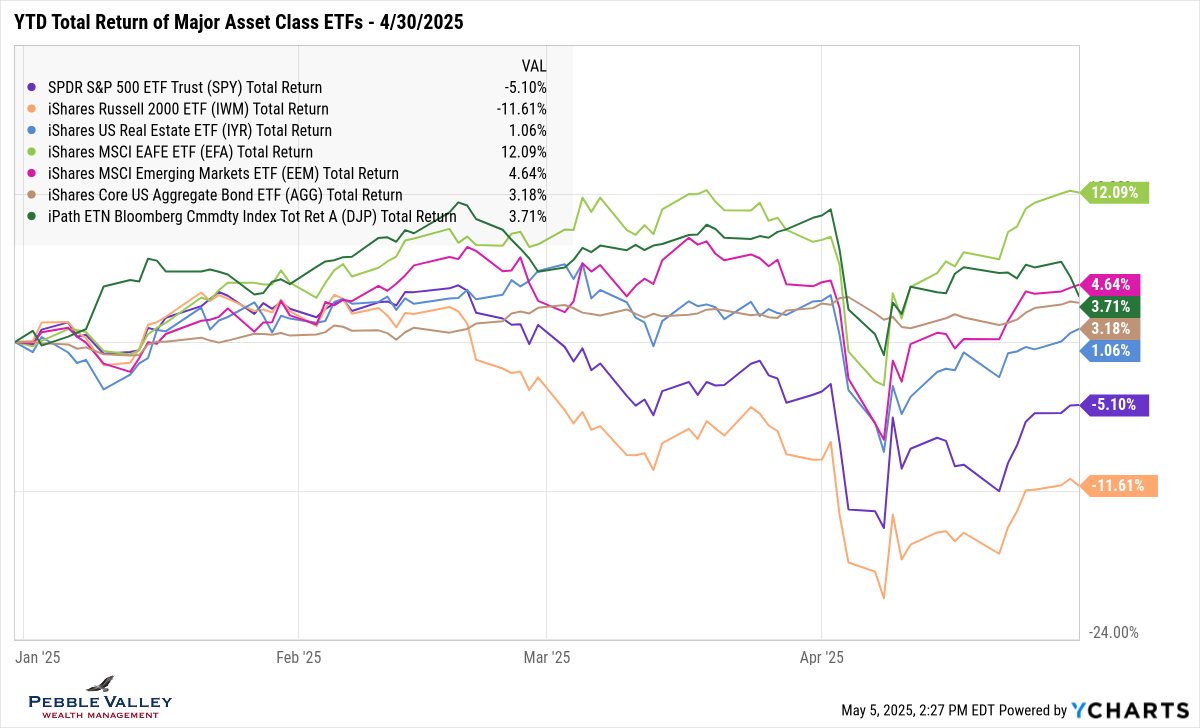
The graph below shows total returns of major asset class ETFs. I only show YTD this month since we now have four months to view and more importantly, to better see the swings during the month of April. As demonstrated by the table above, much of the damage done early in the month from tariff negotiations was recovered by month-end. More calm is present in the markets but plenty of uncertainty remains. The YTD outperformer remains International Developed Equity markets while US Small Caps are a major laggard. Interestingly the only two negative YTD returns are from US equity asset classes. The maximum YTD drawdown for US Large Caps is -15.0% while Small Caps is -20.7%.
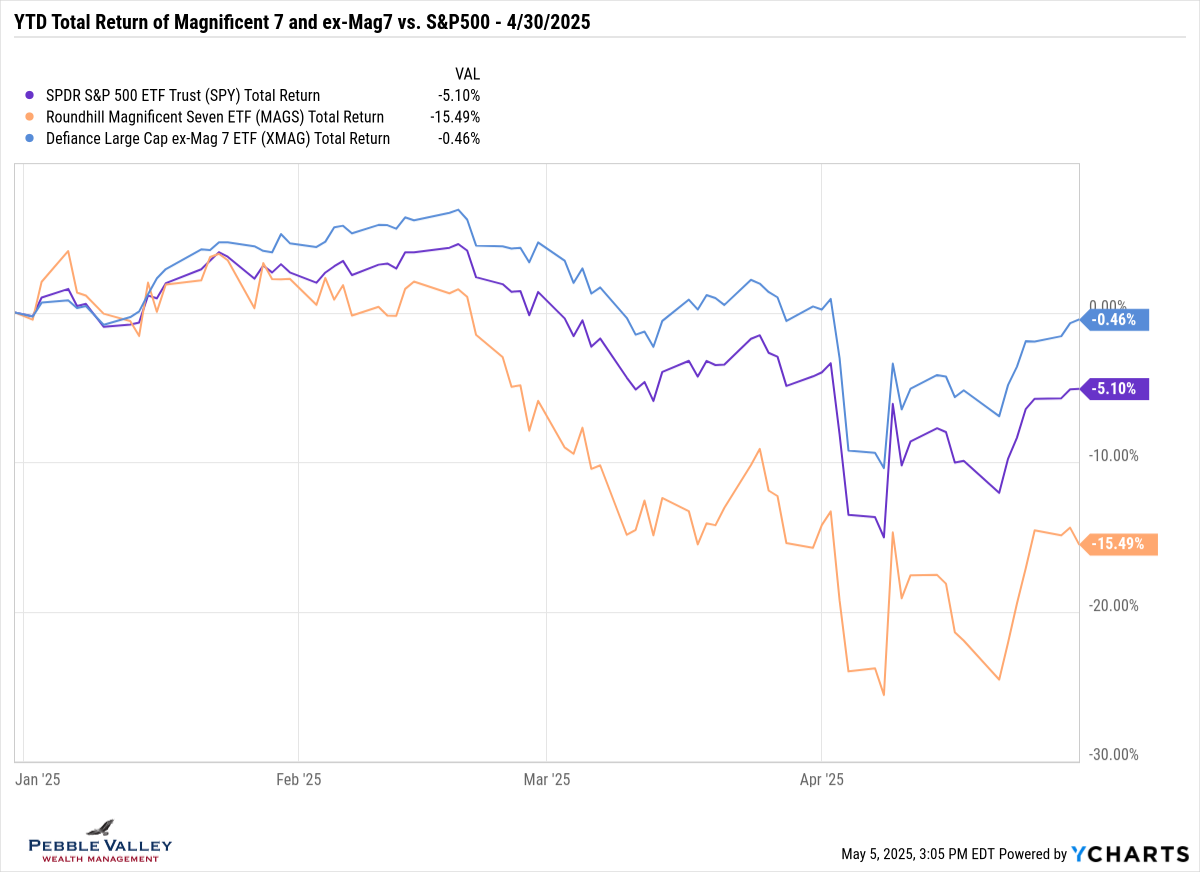
While reading Ed Yardini research I ran across two ETFs that capture two different parts of the S&P500 that I mentioned in last month’s blog post – Magnificent 7 and ex-Magnificent 7. In the past I would show the US Growth v. Value split to demonstrate the differing returns for the type of stock. With these specific ETF tickers I can get more precise. I show those YTD returns relative to the overall S&P500. The maximum YTD drawdown for the Magnificent 7 is -25.6%.
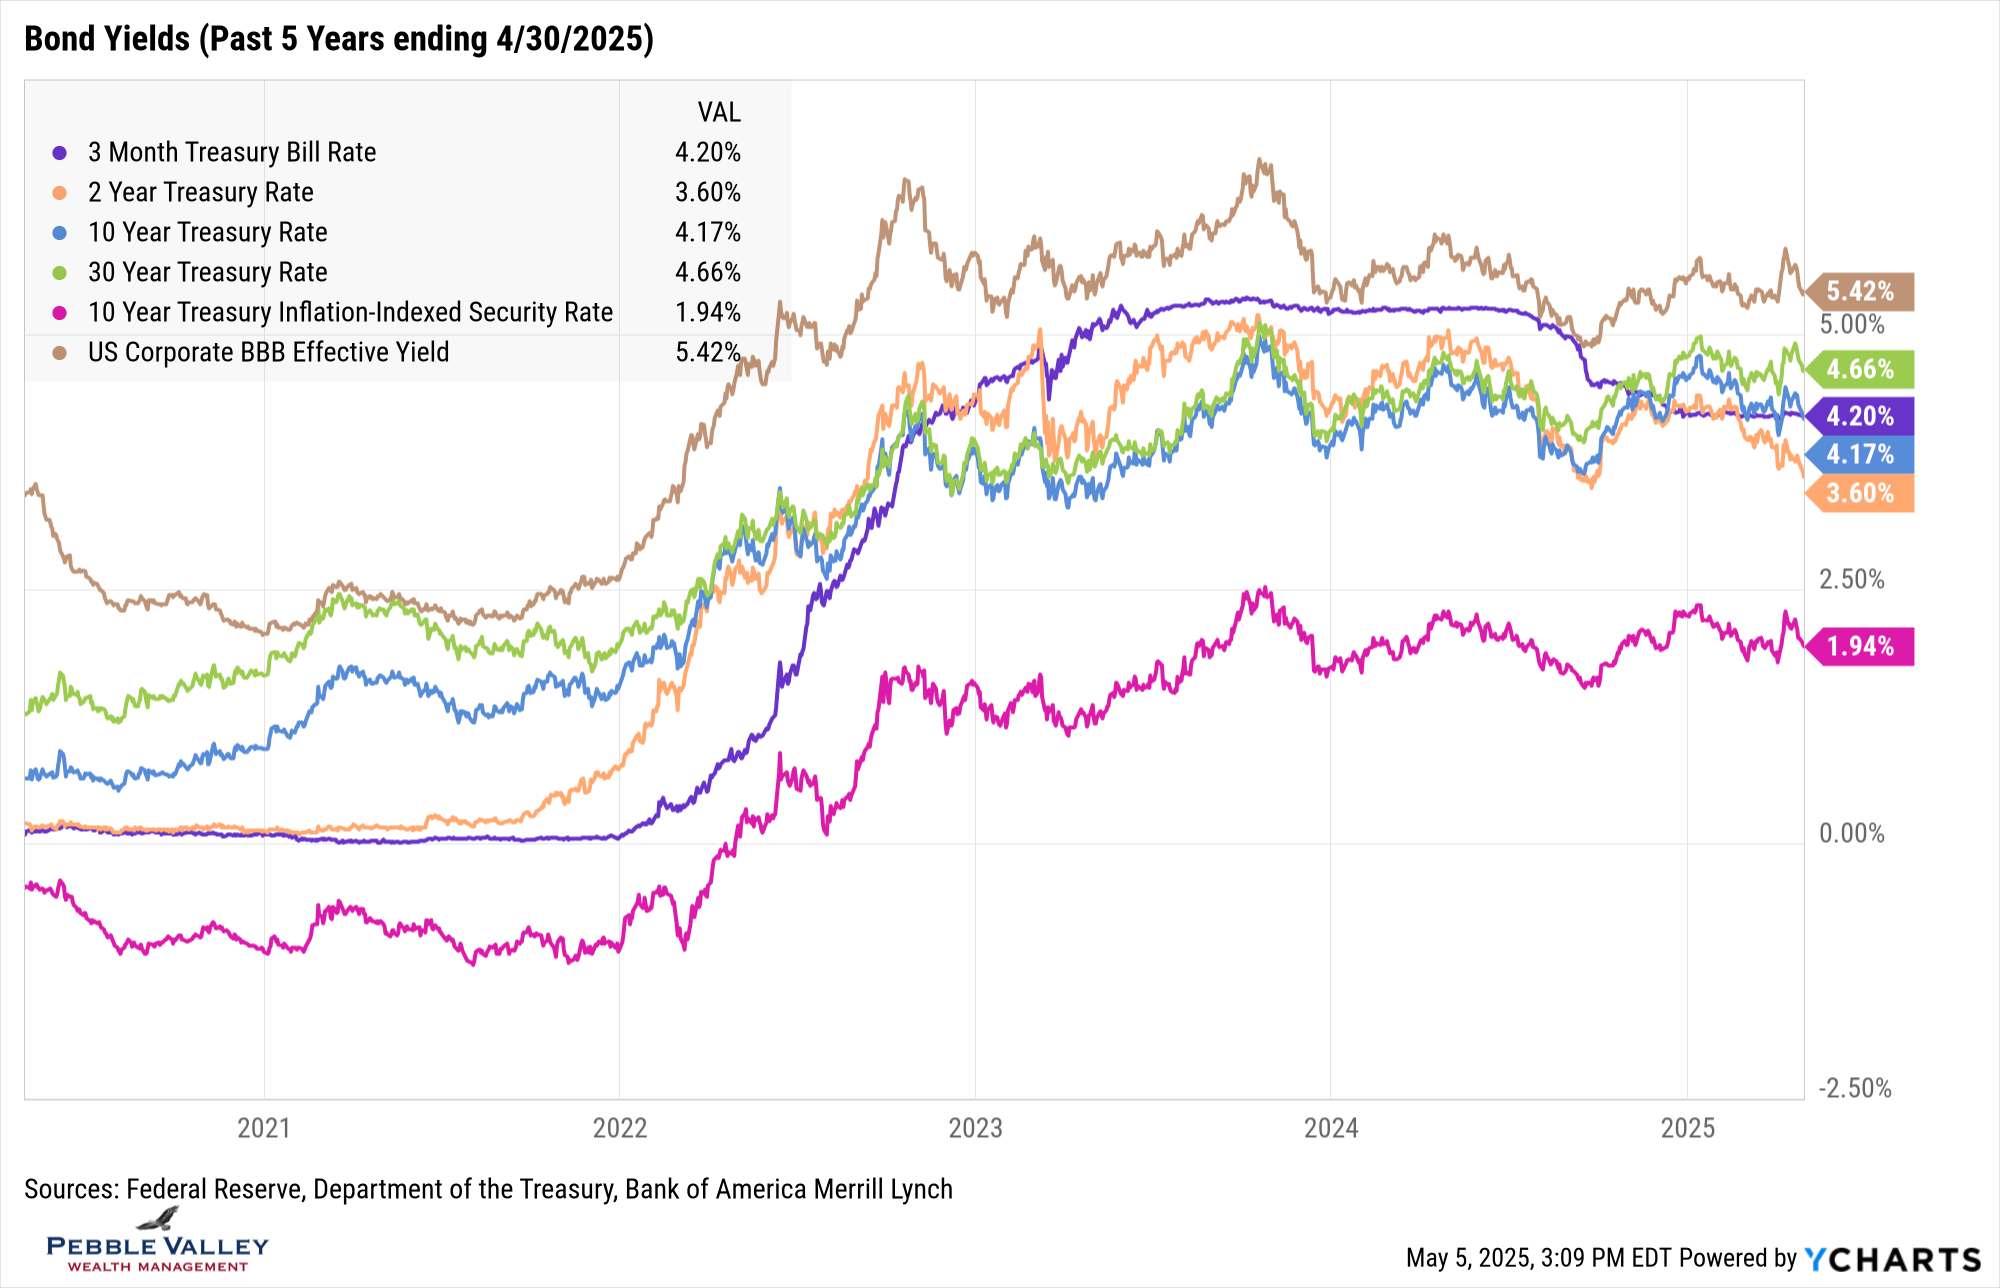
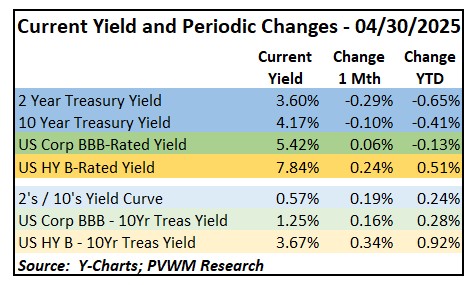
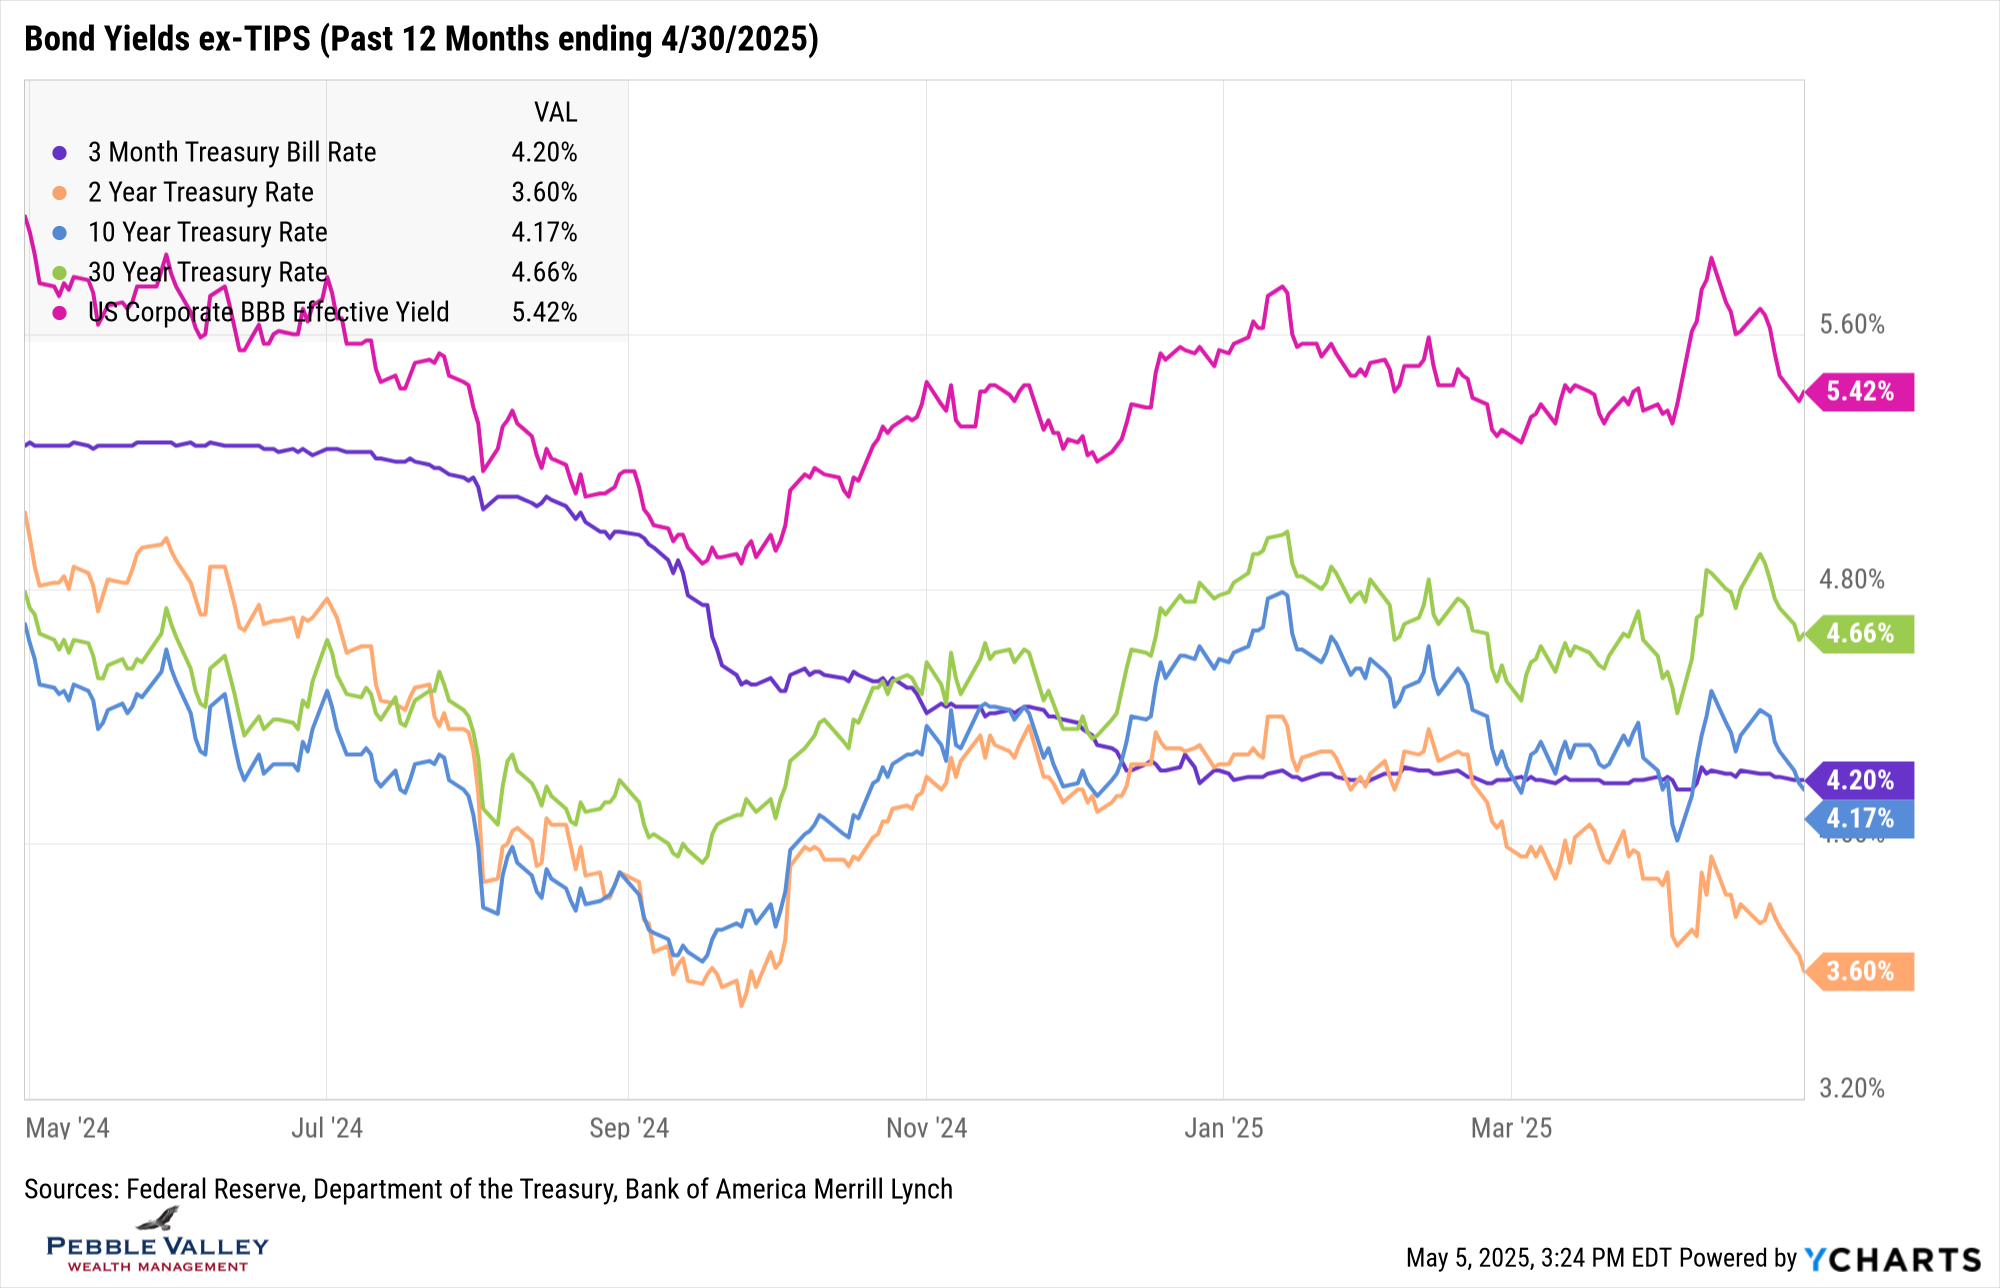
Similar to equities, the change in interest rates for April using month-end only values was pretty stable – except for 2-year rates which fell -0.29%. I also include a second graph for the past 12 months (excluding TIPS for more granularity). The bond market also bears just as much as the equity market. You can see there was quite a large spike in rates mid-month before settling down, though the 30-year rate didn’t settle as much. The two-year Treasury rate only saw a small jump in rates mid-month before continuing the steady march lower as the market prices in expected Fed rate cuts. Corporate spreads also widened mid-month and recovered somewhat by end-of-month, but you can see in the table that spreads were wider for the month due to concerns over potential recession (though less so than early in April) and potentially lower profit margins. Since month-end, a solid jobs report caused rates to begin drifting back up.
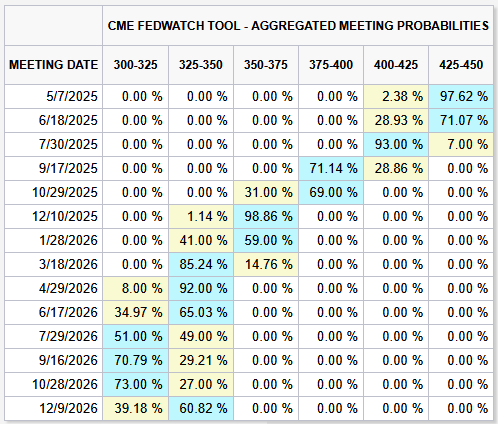
The next FOMC meeting concludes on May 7th. The FOMC currently has Fed Funds rate at 4.25-4.50%. Toward the end of April, the market was pricing in closer to four 0.25% rate cuts by the end of 2025. After the better than expected jobs reports last Friday, the market has backed off to three rates cuts. The first likely rate cut is now pushed out to July. In addition to economic conditions including expected inflation and job strength, the market was also reacting to comments about a potential early replacement for current Fed Chair Powell. The President directly stated he would not attempt to replace him at a press conference shortly after the stories emerged. It may take a couple months to begin seeing the impact of tariffs in the data and even longer for the impact of government job cuts due to some receiving compensation into early fall.
While there is not a deep dive into a special topic this month, I have two quick comments:
- Captain Obvious says to continue monitoring tariff negotiations
- Treasury set the new I Bond fixed rate for deposits received between May 1 through October 31 at 1.10%. The inflation component for the next 6 months is 2.86% annualized. See my previous blog post for the details of how the all-in I Bond rate is calculated.
Early May means a very important day is coming up. Happy Mother’s Day to all the mothers out there!
Have questions? Reach out! We're happy to help.
Posted by Kirk, a fee-only financial advisor who looks at your complete financial picture through the lens of a multi-disciplined, credentialed professional. www.pvwealthmgt.com