

Asset Class Returns - 3/31/2023
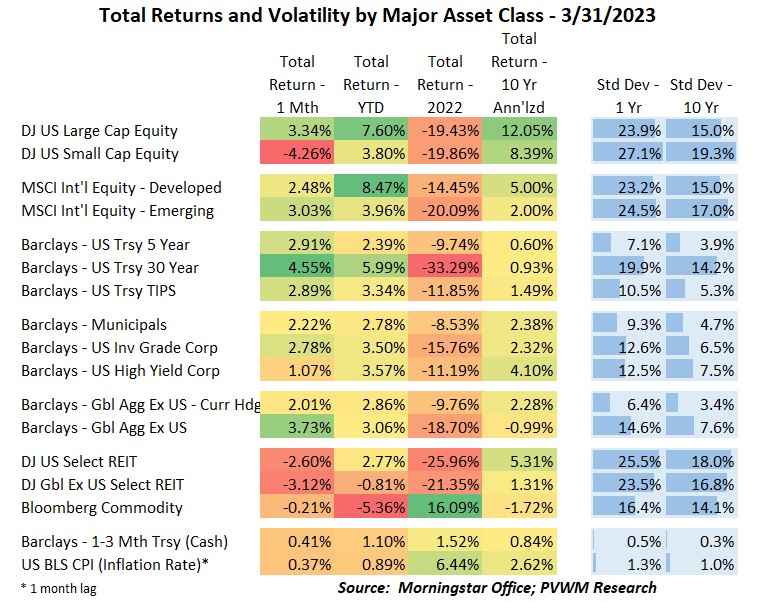
A quick glance at the YTD column in the table above shows the overall market returns are off to a great start in 2023 - except for commodities. Even the bond market has solid YTD gains, especially the longer-dated treasury index. Usually the equity and bond market returns don’t move together in such strong fashion, though this was similar – but the opposite sign – as returns in 2022. Looking at the monthly returns, a couple significant outliers are evident; US small caps drastically underperformed large caps and commercial real estate had noticeable negative returns. Any common underlying theme? Banks.
Before I continue my regular monthly commentary, I must remind readers of the banking issues that dominated the news starting March 10th. Two medium sized banks were shut down and the FDIC stepped in to cover all depositors, not just those below the insured limit of $250k per depositor. The main catalysts were a concentration of large depositors in a single industry that was struggling and large unrealized losses on low-credit risk, but high interest rate risk bonds. See my recent blog post for a full discussion.
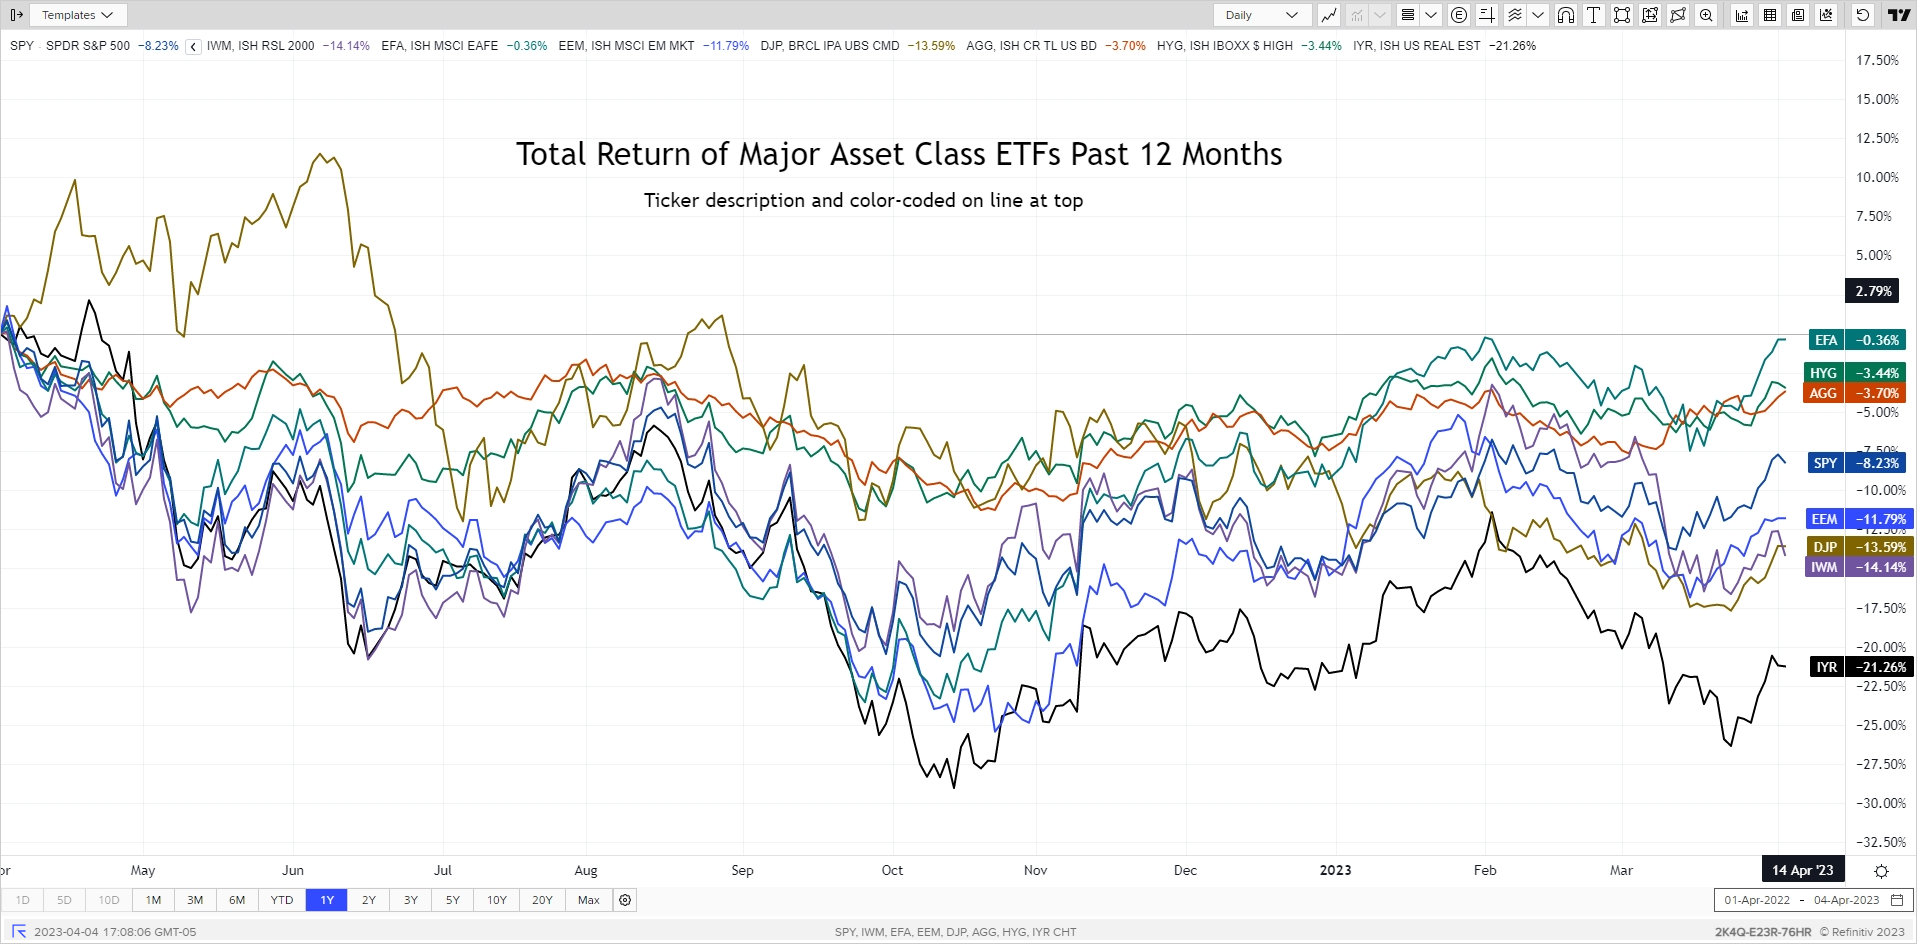
With this backdrop, looking at the graph below you can see the pullback in most asset classes starting in early March on the back of this bank news. However, it was not a deep nor long-lived pullback and most markets snapped back relatively quickly. One exception is US Small Caps which lagged due to concentration of smaller banks. The muted market reaction was indicative of the nature of the banks in trouble – centered around a few mid-size banks with a unique customer base and not widespread credit problems. International developed equities (ticker EFA) led the asset classes on a 1-year total return basis, despite having their own banking issues ending with UBS acquiring Credit Suisse. US REITS (IYR) continue to lag as commercial real estate bears watching.
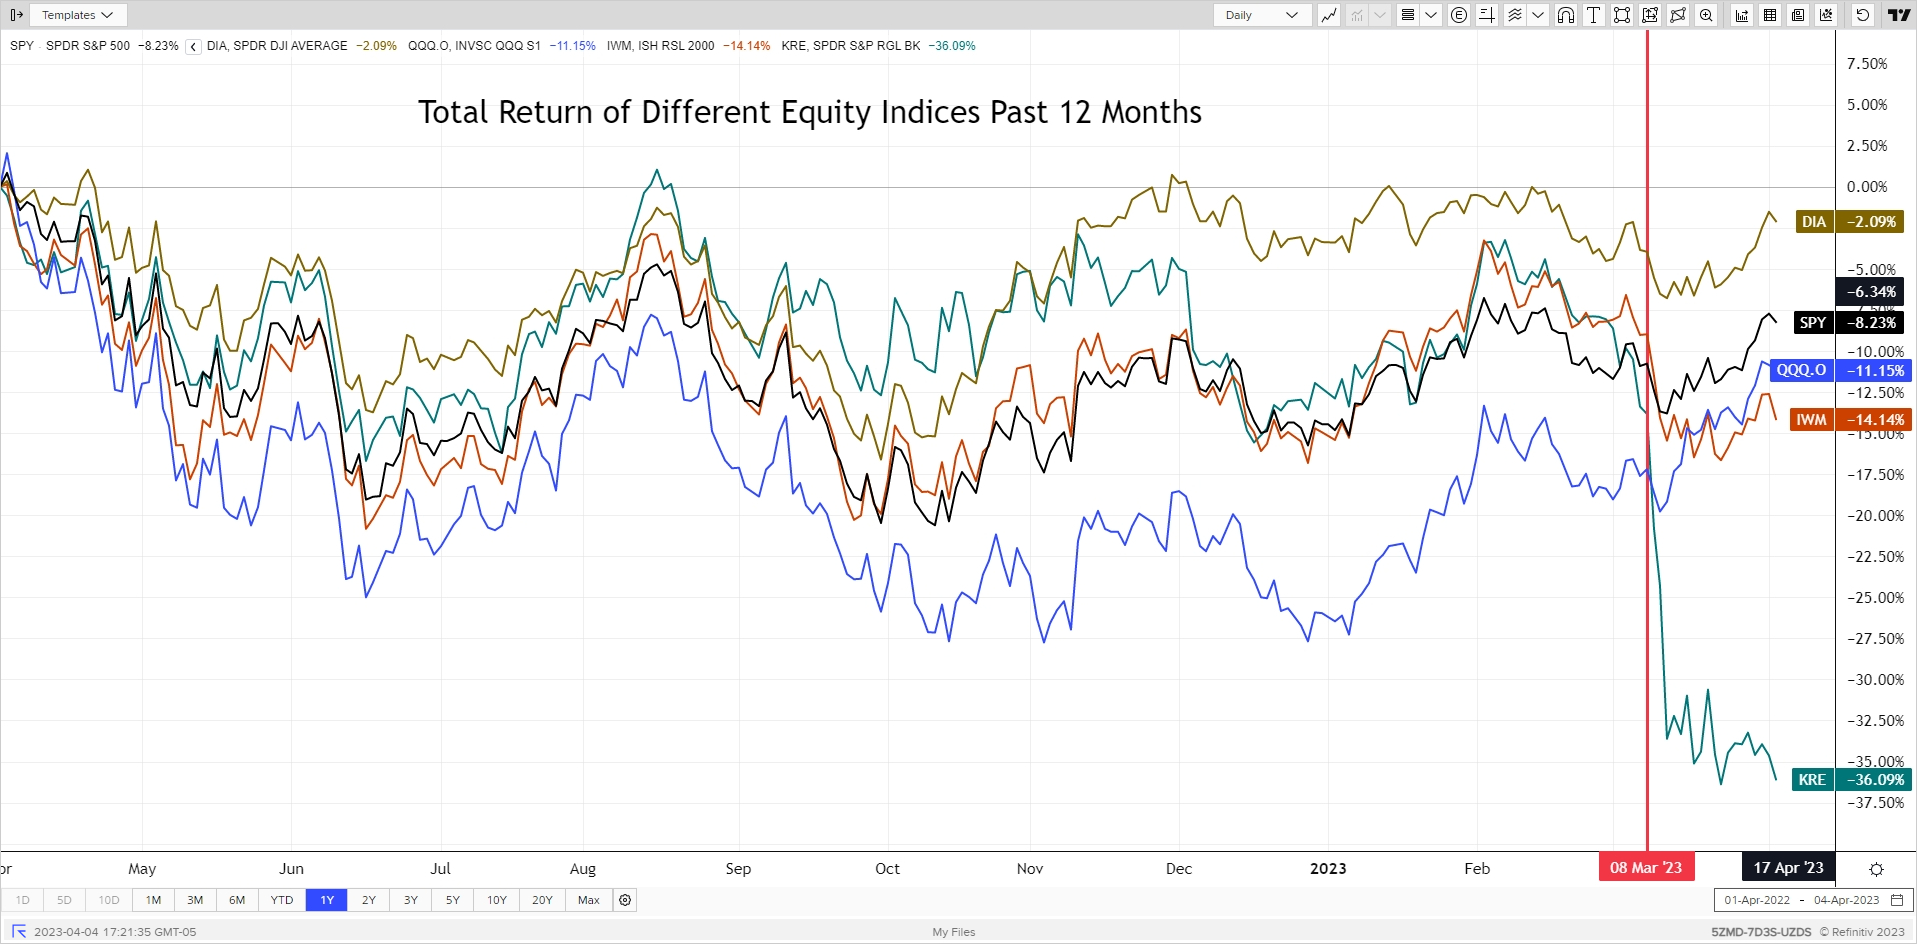
Rather than drilling into sectors, I want to point out the divergence among four popular US equity indices. Using ETFs and Refinitiv data, the YTD total return through April 4th for US equities were:
- S&P500 (SPY) = 7.3%
- Dow Jones Industrial Avg (DIA) = 1.3%
- Nasdaq 100 (QQQ) = 20.0%
- Russell 2000 (IWM) = 0.9%
The graph below shows these four indices, along with the regional banking ETF for the past 12 months. You can loosely think of Nasdaq 100 as Growth stocks and Dow Jones as Value. The Nasdaq (Growth) has been ripping this year but coming off a deep low while the Dow Jones (Value) is flat on the year but has been holding up well during the tumultuous past 12 month. Russell 2000 (small caps) have lagged other indices since the early March bank issues, but the index contains many smaller banks. You can see the regional bank ETF (KRE) got clocked and despite government and bank industry efforts, the equity of these banks continue to weigh on the market.
The usual Rates graph shows the significant rate volatility this past month. After the Fed meeting in early February, interest rates were continuing their march higher, especially short-term rates, as the market re-adjusted back to an active Fed. However, rates pulled back significantly after March 10th as recessionary concerns over the bank issues dominated. While short-term treasury bill rates remain elevated in light of Fed action (see later), the 2-year and longer yields continue to fall. The level of 2-year rate is quite at odds with Federal Reserve direction and reflects the market view of recessionary concerns vs. the inflation-fighting focus of the Fed. Will the Fed cut rates sooner or will the 2-year rate need to rise? I expect the latter. Real yields on TIPS are also falling, reflecting the market view of recessionary concerns and a rate-cutting Fed.
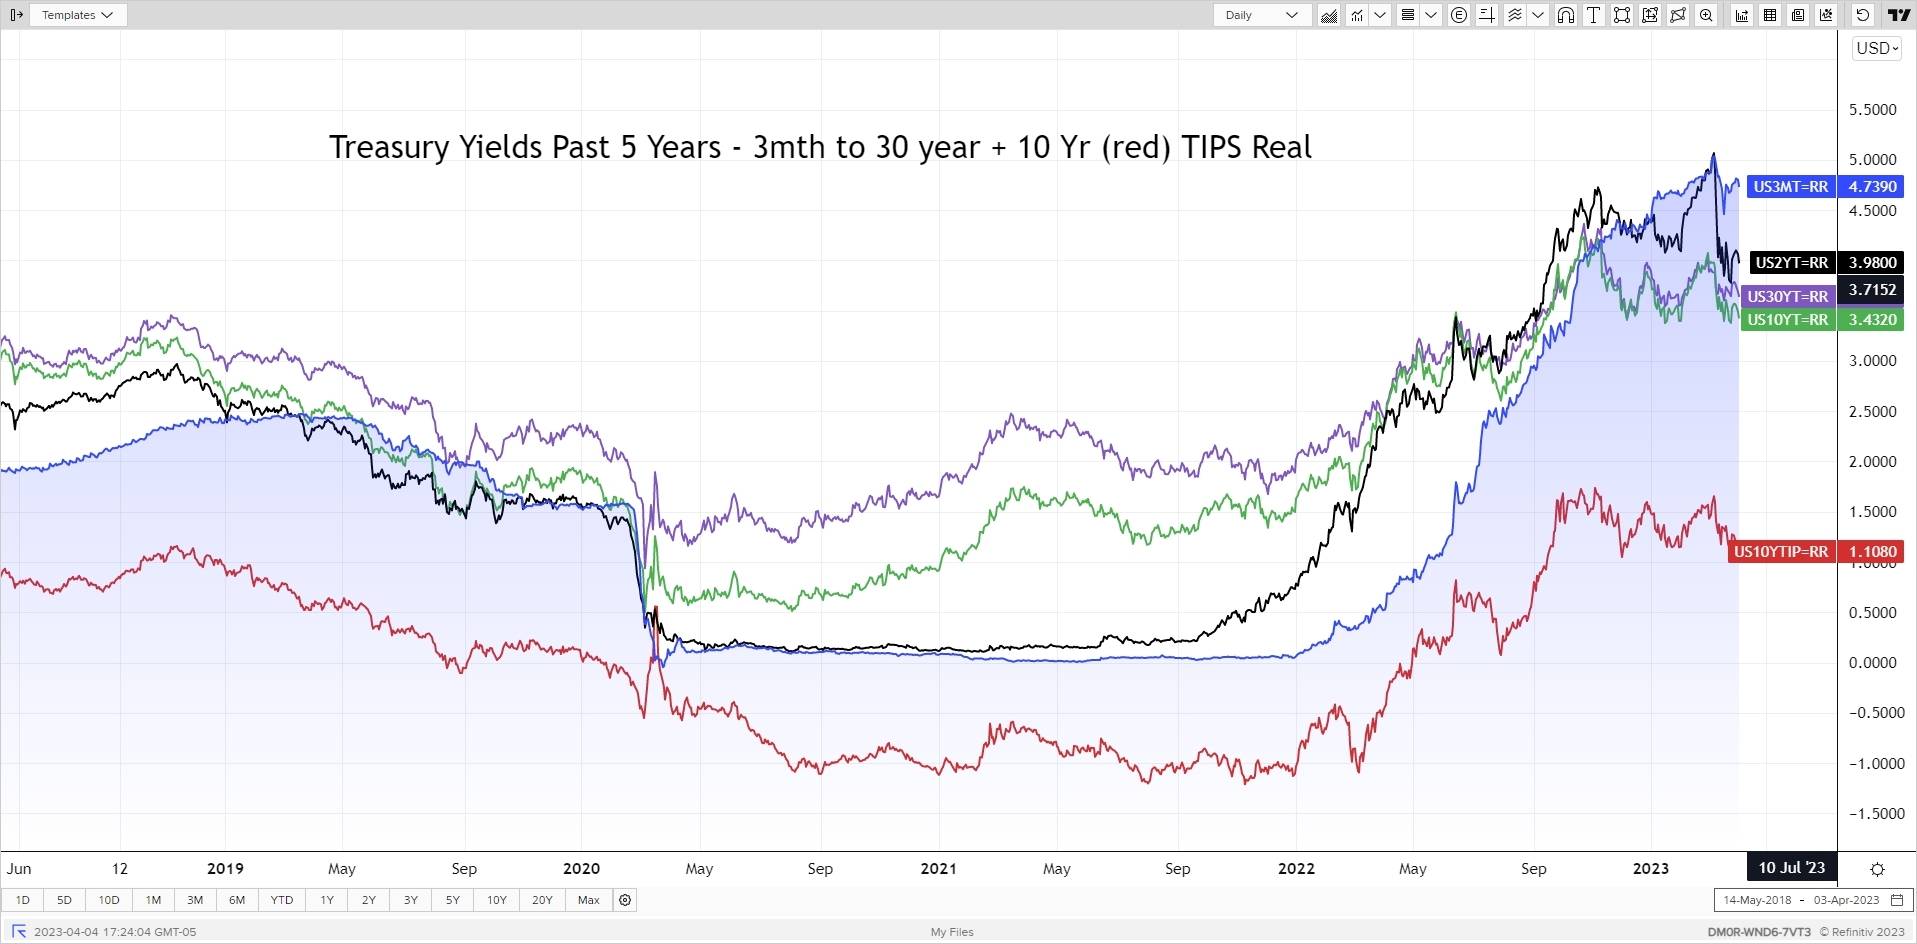
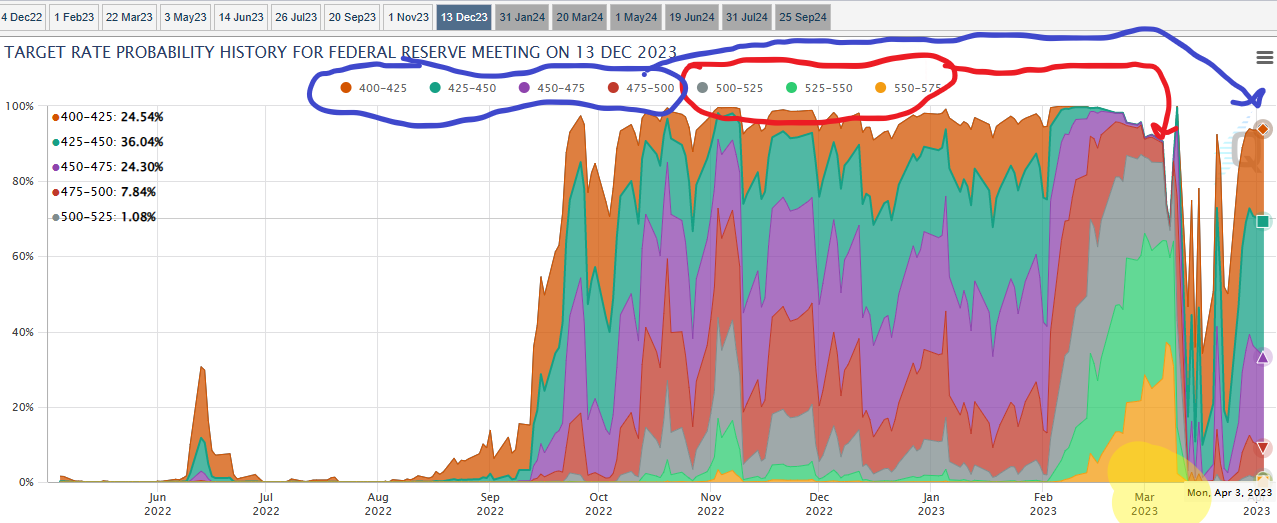
The latest Fed meeting concluded March 22nd with the Fed raising rates by 0.25% to a Fed Funds target range 4.75% to 5.00%. Immediately after the banking issues the market was pricing in potential Fed cuts by the end of 2023 of up to 1%. But after a hot CPI report, the Fed raised to continue the inflation fight but acknowledged the banking issues will likely cause some tightening in credit conditions. What’s interesting is the average Fed’s economic projections still shows a Fed Funds rate of 5.10% at the end of 2023 – one more rate hike and then holding steady in 2023. This is very different than the Fed Funds futures implying an over 90% probability of at least one 0.25% rate cut and over 50% probability of two or more. Something has to give. Next up – jobs report this Friday.
April showers bring May flowers. May the showers be warm and the flowers be vibrant!
Posted by Kirk, a fee-only financial advisor who looks at your complete financial picture through the lens of a multi-disciplined, credentialed professional. www.pvwealthmgt.com