After a slight pause in strong returns in late January related to GameStop activity, the equity markets continued their march higher. By mid-February some indices had already recorded returns that are quite respectable in normal years. In the background to these rising returns was another thing that was rising – treasury rates.
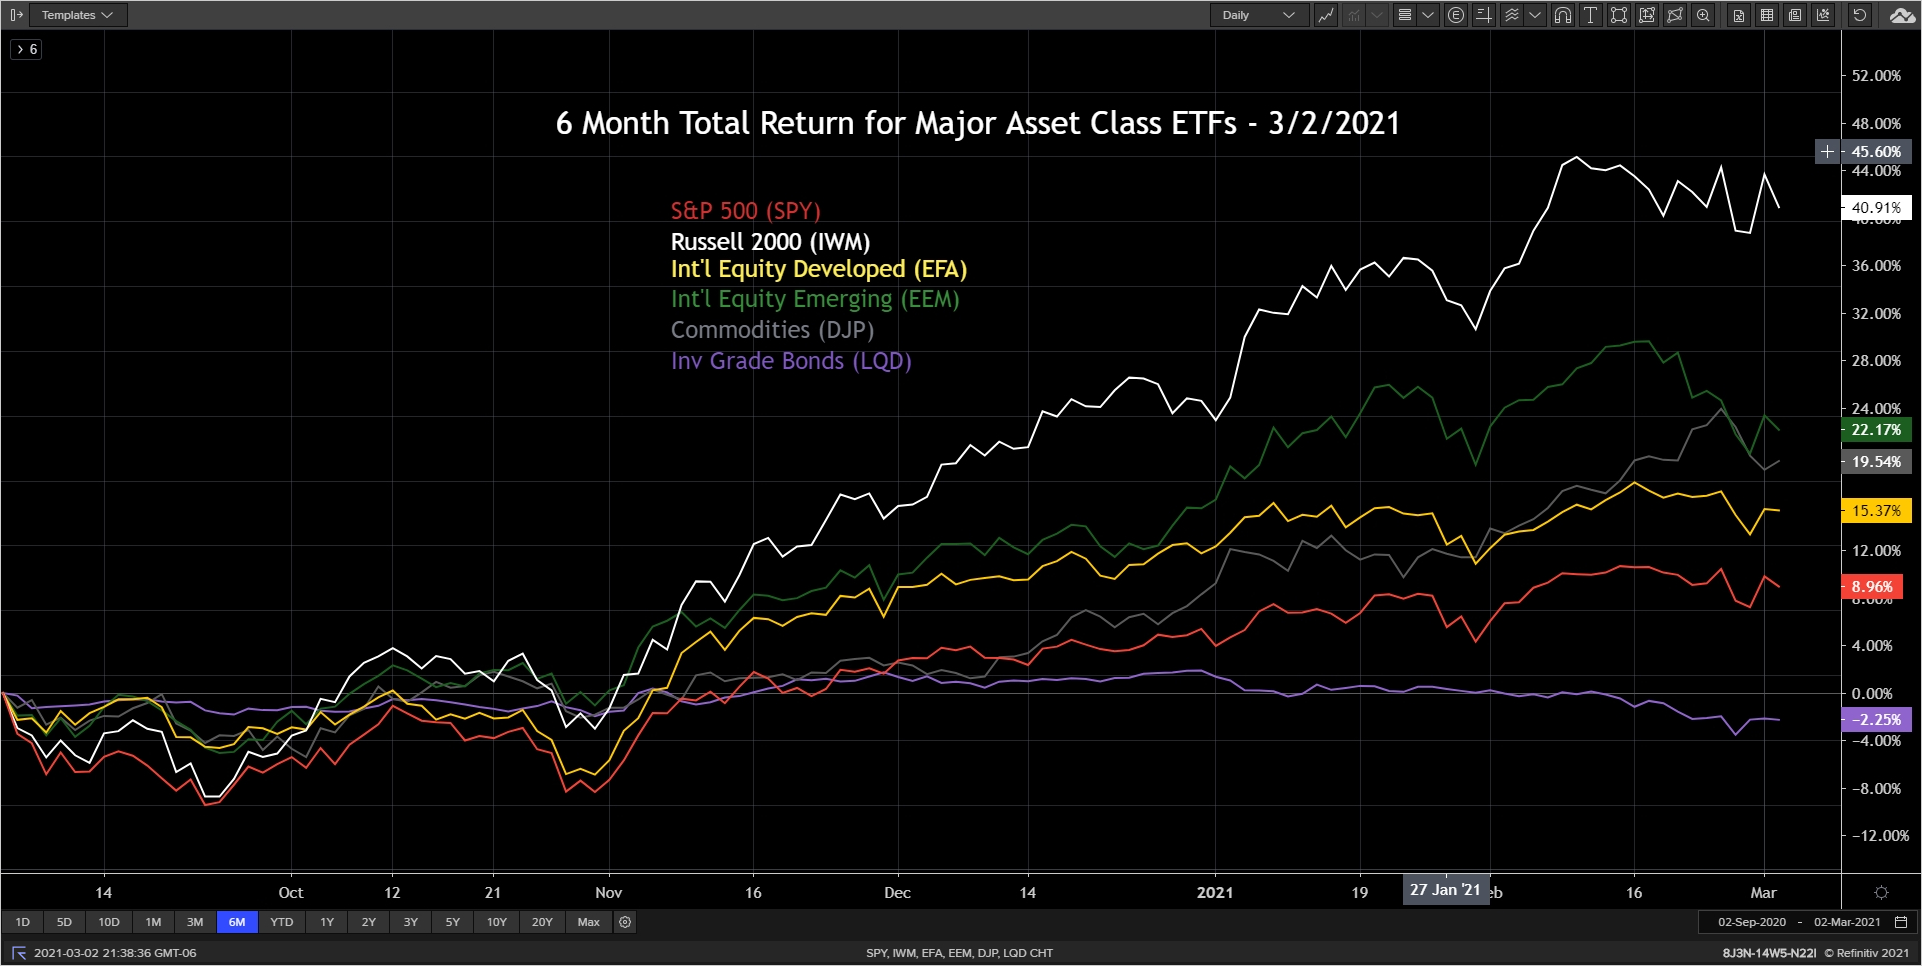
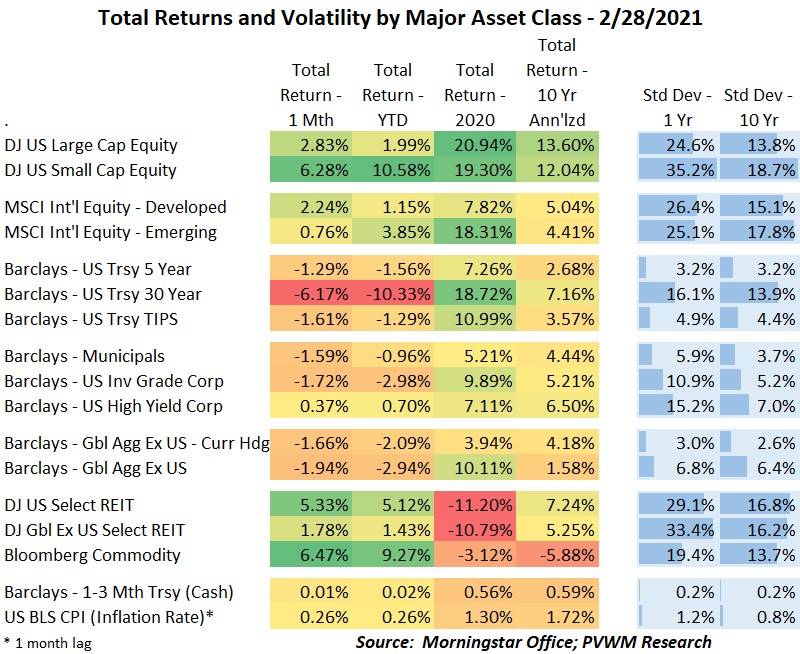
Before I get into how rising rates may impact equity, I will first show the usual major asset class return graph. Even with the slight pullback at the end of February, returns are still quite impressive, especially for small caps.
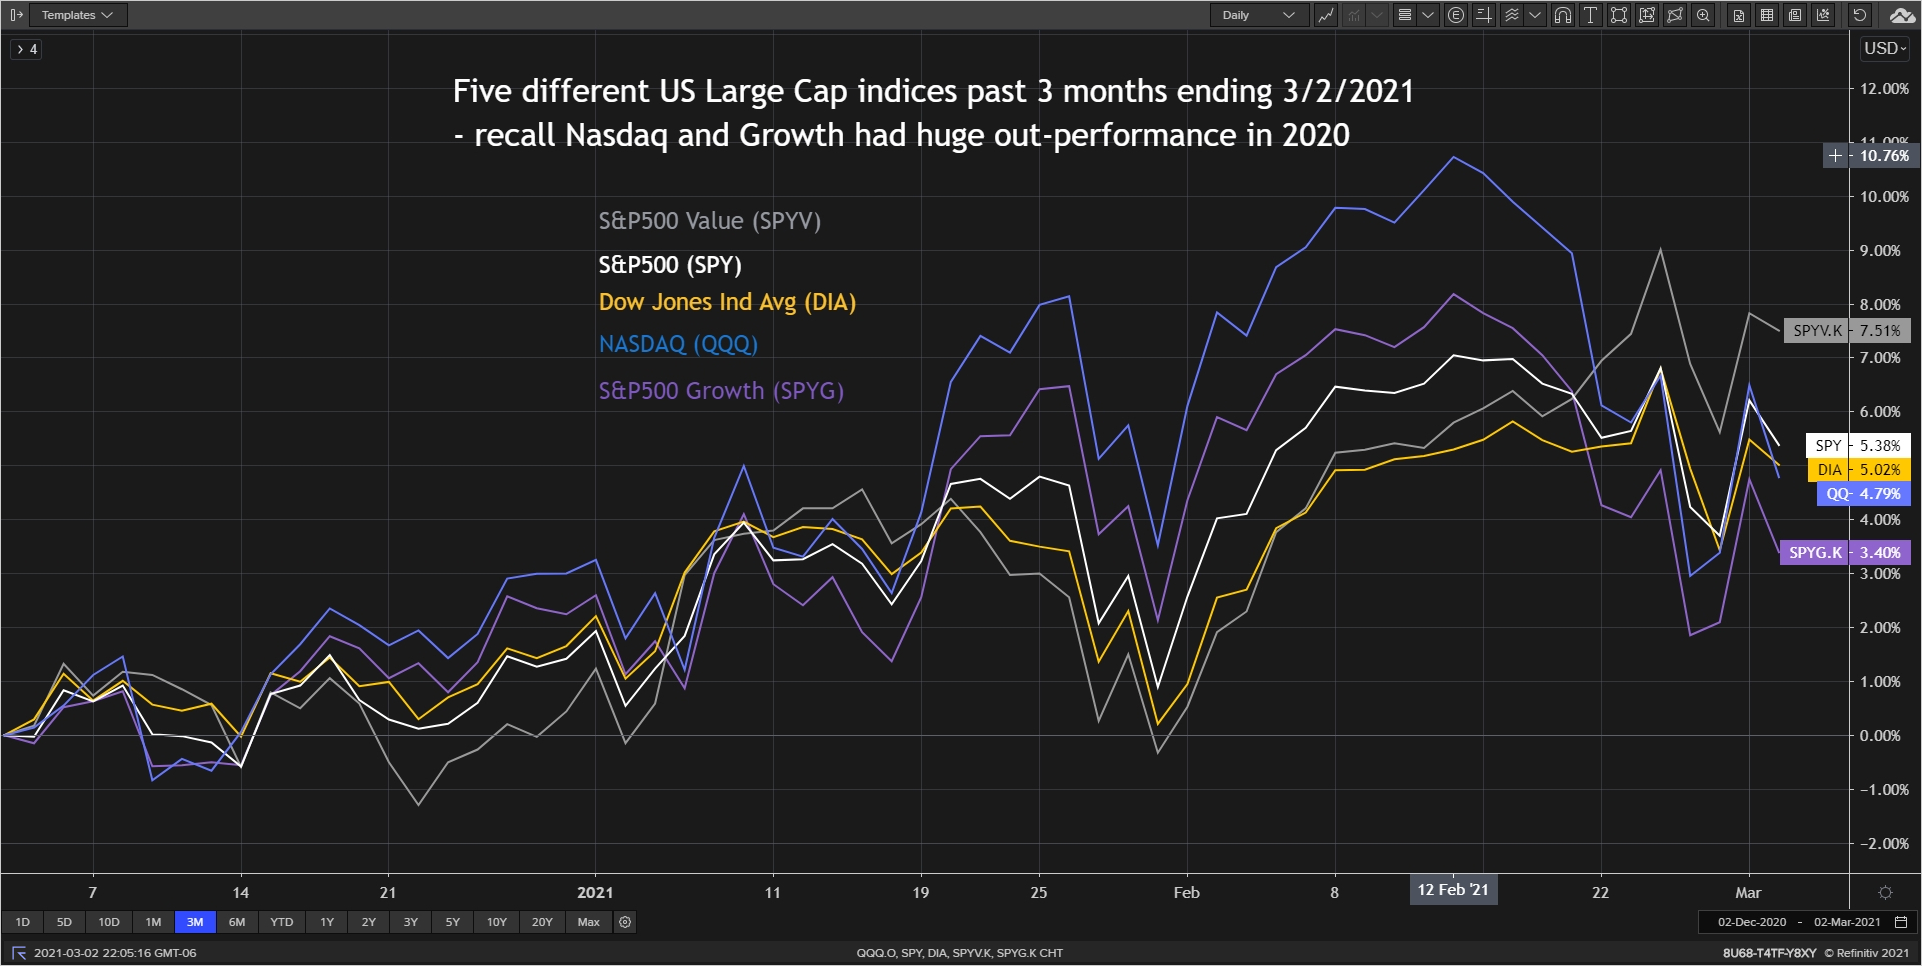
You may recall the graph from my 12/31/2020 summary showing five different indices all within the US Large Cap universe and the wide dispersion between tech/growth and value. Below is the updated graph for the past three months showing the change in leadership to Value. Two sectors leading the charge YTD within Value are Energy and Financials. Lagging sectors are Consumer Staples and Utilities.
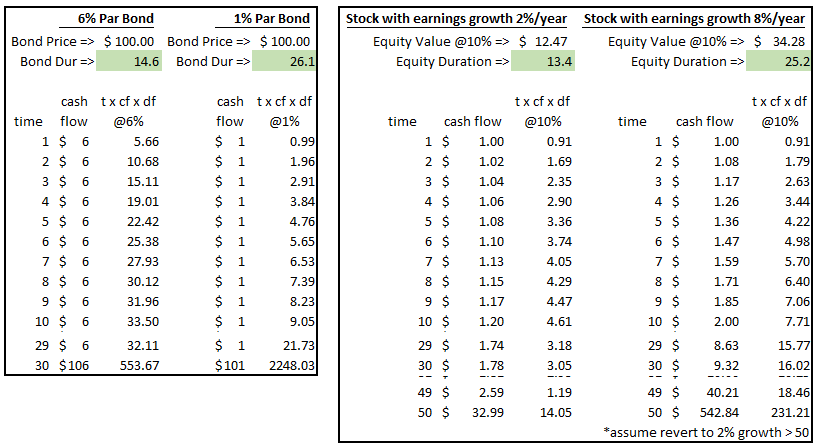
Before I show the graph of treasury rates, I want to illustrate the concept of duration and how it is magnified with lower rates. I will then extend the concept to equity duration to illustrate how rising rates can impact equities with different growth patterns. Note duration captures the approximate % change in price given a 1% change in rates. The bigger the duration, the more the price falls (rises) when rates rise (fall). There was a lot of “price rise as rates fall” in 2020 but we must focus on what happens from here.
In general, the lower the rates the more magnified the duration (price sensitivity) for securities’ fundamental value that require a discount of future cash flows. I recall one of my actuarial exams in the ‘90s asking to calculate Macauley Duration of a 10-year bond with a 6% coupon (yes that was a thing) which required some fast punching on the calculator. A few questions later it did ask for the Macauley Duration of a 30-year bond, but with 0% coupon. Some grabbed calculators but I knew the fast answer was 30.
The following table shows the duration of a 30-year bond with a 6% coupon and a 1% coupon. I then use the same duration framework and apply to stocks with different earnings growth. You can see the higher growth stock has more earnings in the future whose present value of earnings is more sensitive to a change in discount rate. When the discount rate is changed by even 1% you can see the different impact on fundamental value by looking at the different duration of each. The fundamental value of the higher growth stock has almost twice the price sensitivity as the lower growth stock. I recognize momentum may be dominating this pedestrian concept of fundamental value but worth noting the impact on home base.
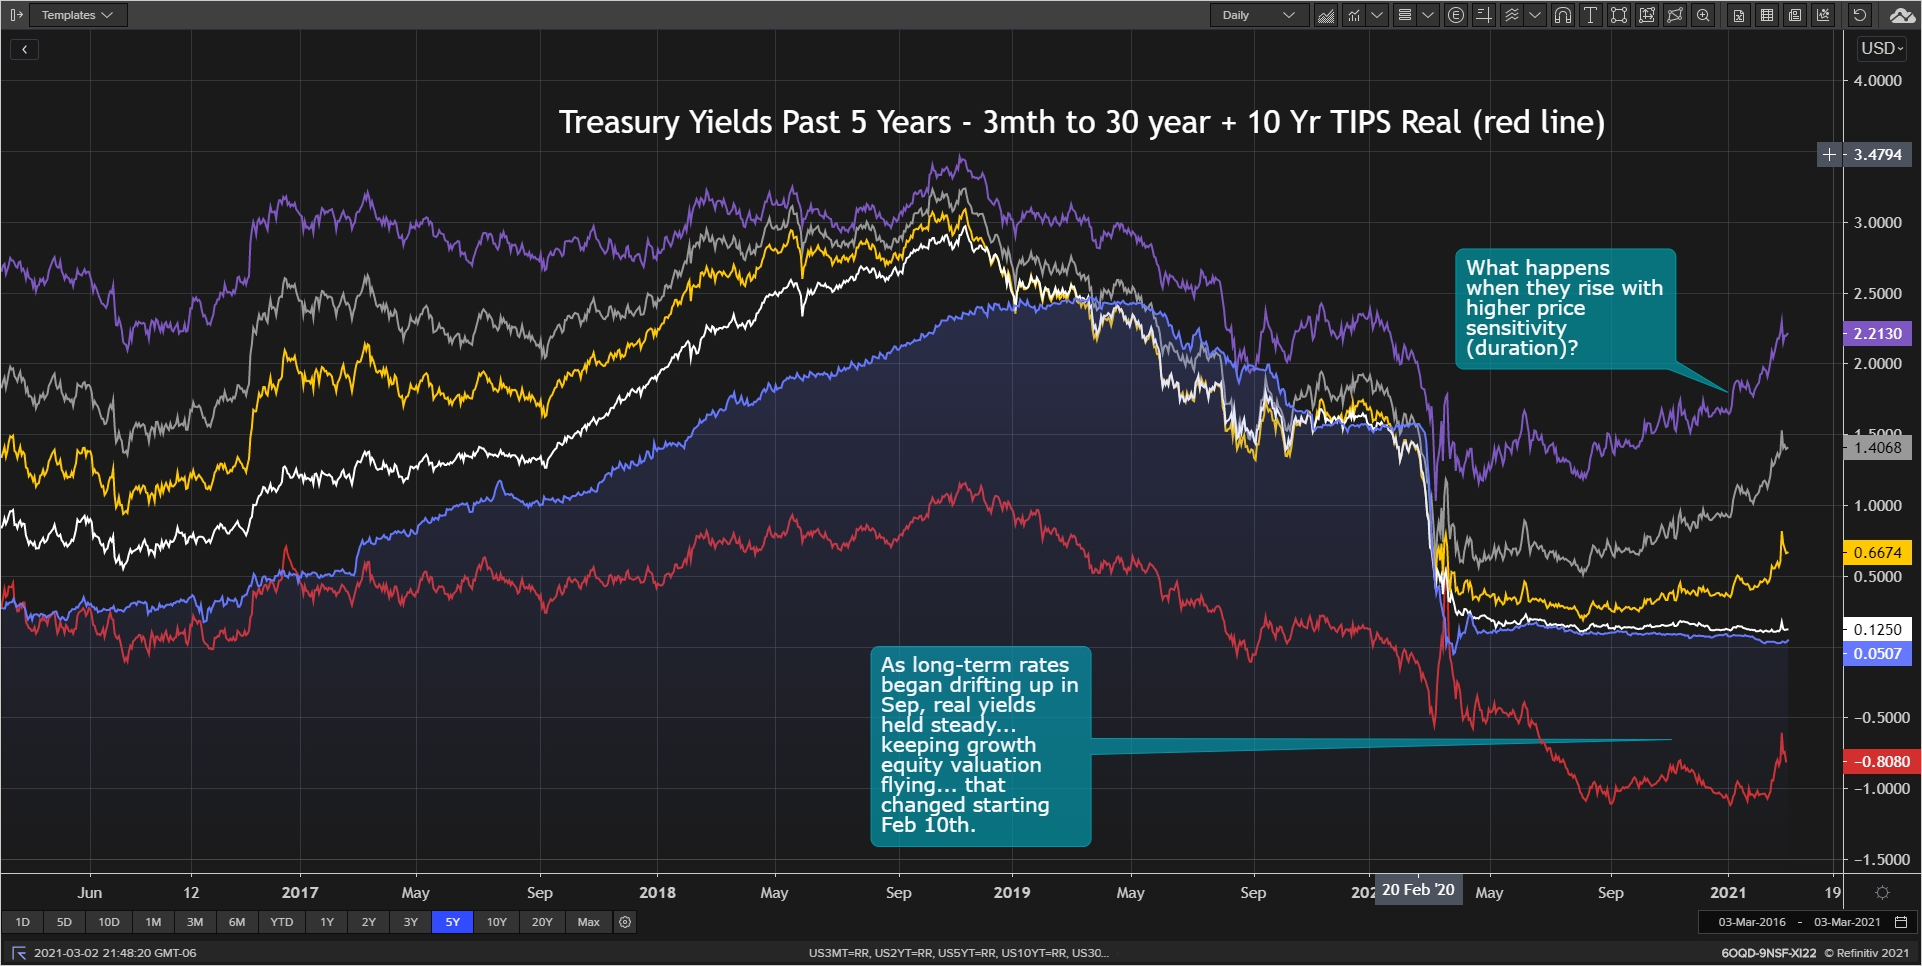
And now that long awaited treasury graph. As mentioned last month, rates began rising in early January after the Georgia elections tilted the Senate in the Democrats favor. This march higher first occurred for longer maturity bonds (+0.50 - +0.60% YTD for 10- and 30-year) and last week for the 5-year (+0.30% YTD). Note the largest loss YTD in table below is in 30-year bonds, though after huge returns in 2020. Because the Fed has told us it is on hold until inflation consistently runs above 2%, the short maturity bonds remain low and are expected to stay low for some time. Another interesting rate move was the real yield in TIPS. Up until mid-February, the real yield remained relatively flat as rates rose, implying higher expected inflation. The recent move in real yields relative to regular Treasuries (nominals) implies higher real expected growth.
Speaking of things rising, how about the temperature in the Midwest? Instead of a lion, March came in like a lamb. I’ll take the lamb… and daylight savings time in a couple weeks.
Posted by Kirk, a fee-only financial advisor who looks at your complete financial picture through the lens of a multi-disciplined, credentialed professional. www.pvwealthmgt.com