

Asset Class Returns - 10/31/2025
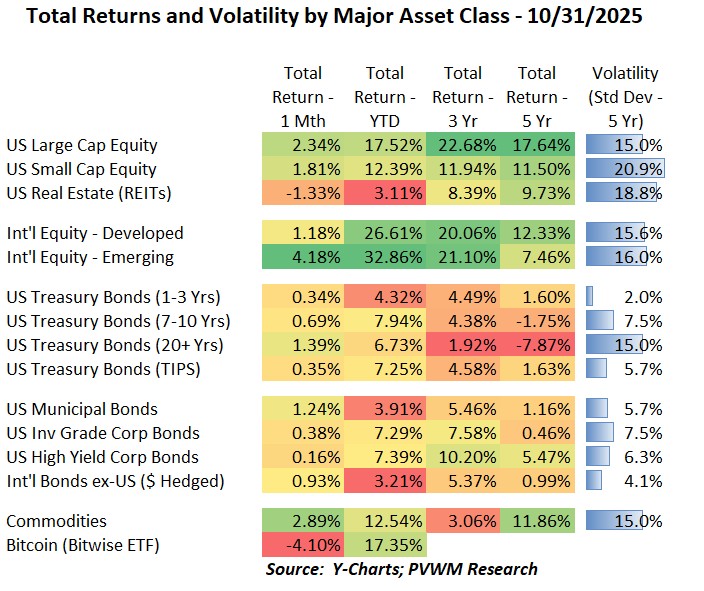
Another month, another positive return for most markets. Looking at the table above, the only negatives for the month are coming from REITs and Bitcoin - a new addition to the table this month. REITs should have received a slight tailwind with the small drop in rates, but the Office sub-sector had some tough earnings. Bitcoin is coming off a strong run and feeling some selling pressure (or lack of buying from Digital Asset Treasury Company – DATs). A few other things to note from the table:
- US equities clipped +2% month pushing up YTD returns and contributing to strong 3- and 5-year annualized returns
- Int’l equities saw divergence again this month, with Emerging Markets continuing to outperform the developed markets; a 33% YTD return for Emerging!
- Treasury bonds have impressive YTD returns with the extra price-return kicker from lower rates added to coupon income; note the volatility in the right column for longer maturities
- High Yield Corporates were positive for the month, but just barely relative to Treasuries, implying that credit spreads widened (rates up, returns down)
- Commodities were up again, with YTD and longer-term annualized returns being surprisingly high; Gold was a big contributor.
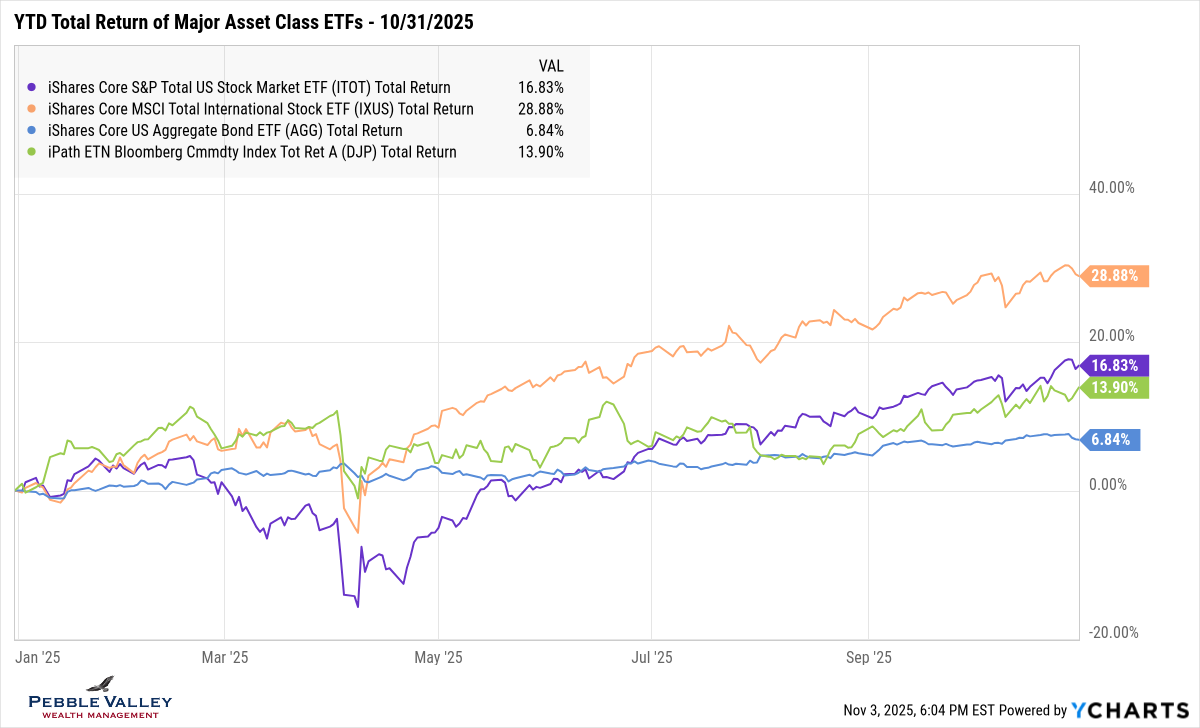
The graph below shows YTD total returns of major asset class ETFs. Recall I am only showing a combined US equity and Int’l equity, along with aggregate bond and commodities for a crisper graph. Refer to table above for asset class details. You can see the mid-month drop in markets after reacting to a Chinese tariff threat. The extent of sell-off was more a reflection of the stretched market in my view but quickly rebounded. The skittishness was telling however and bears watching.
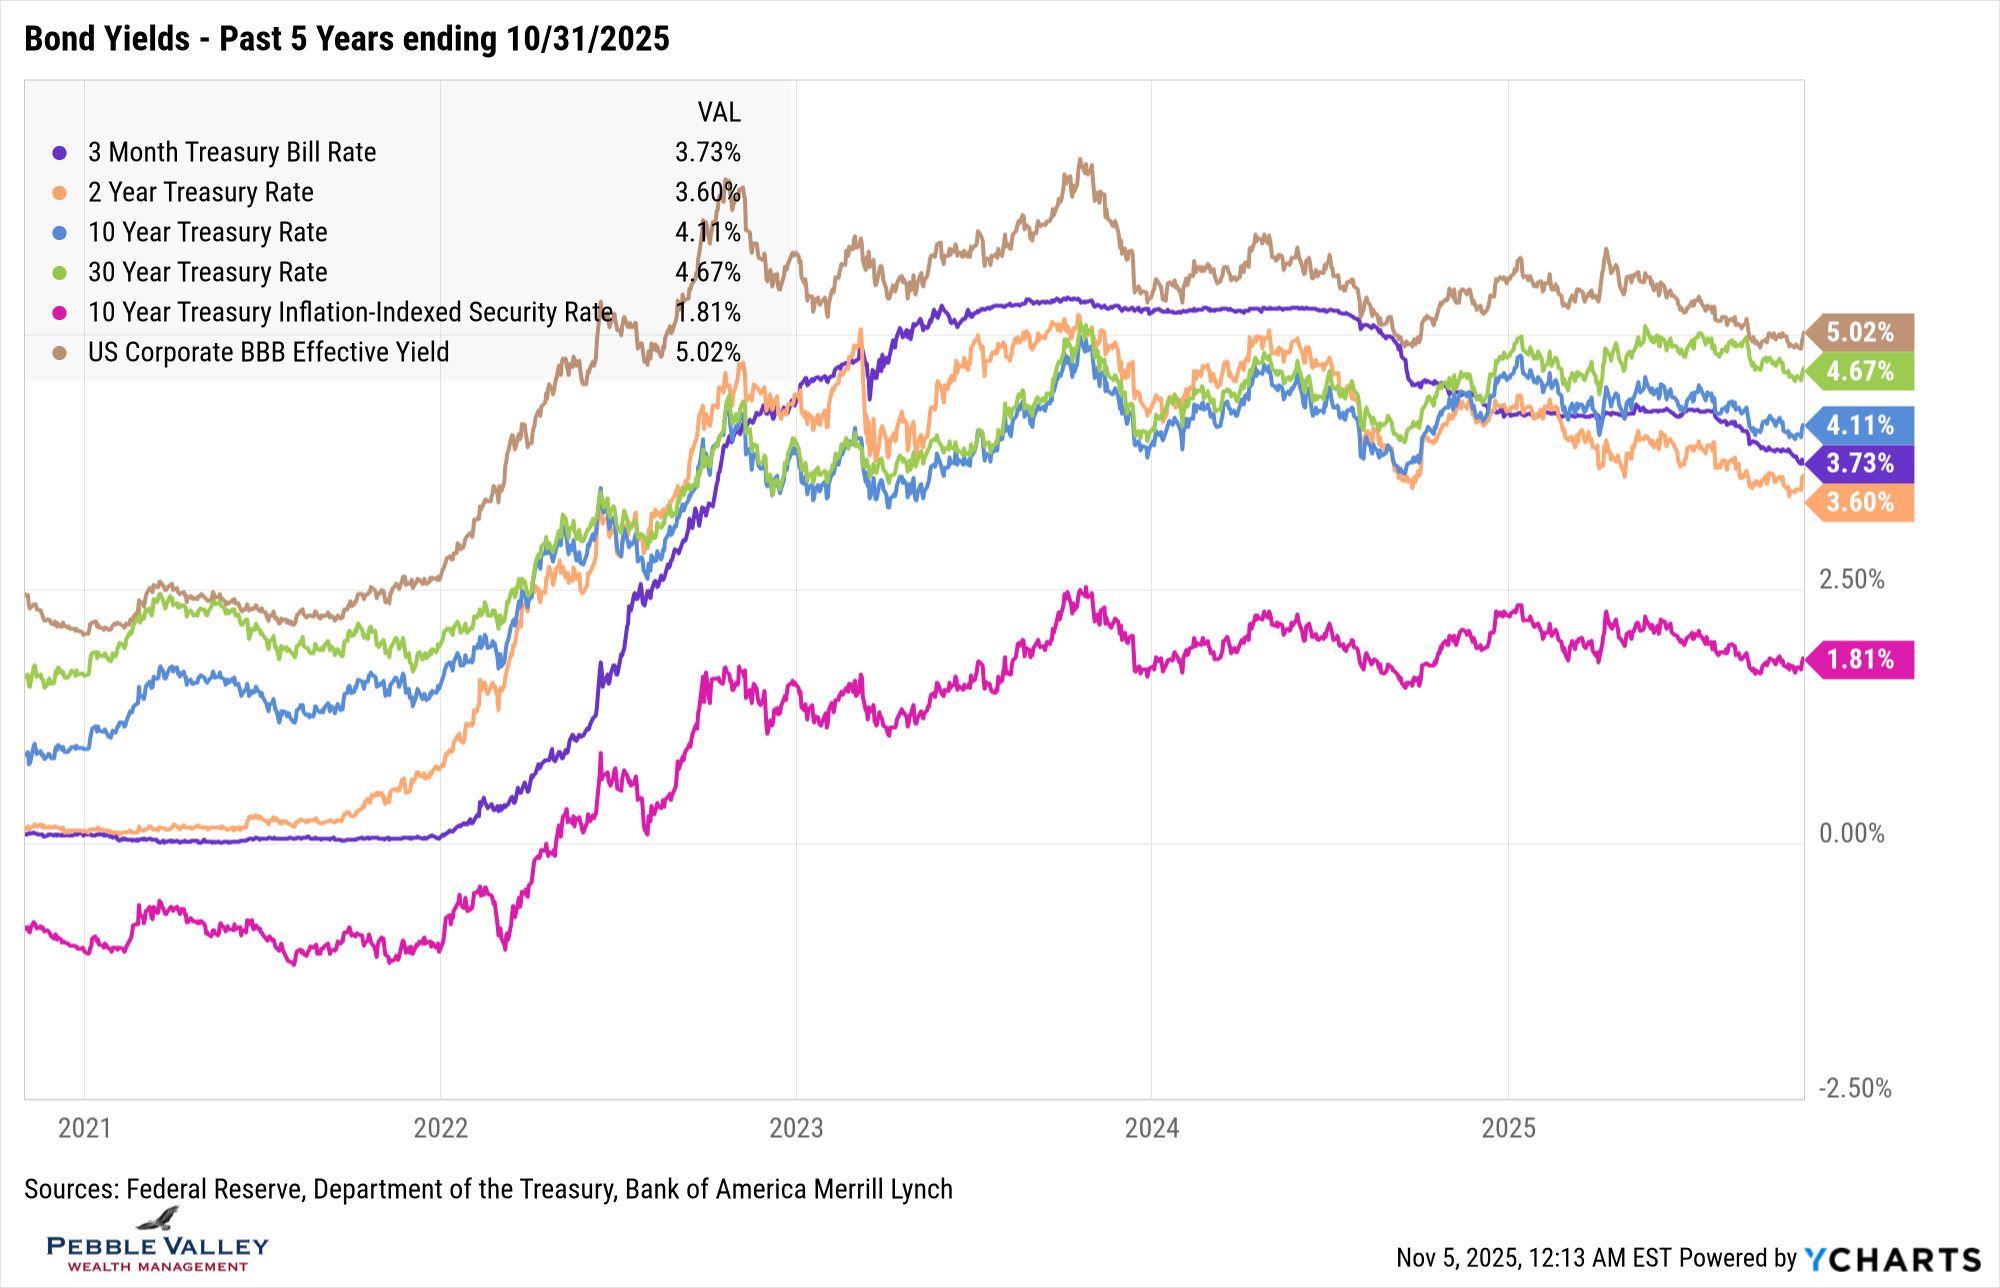
The bond yield graph for the past five years shows yields steadily grinding lower, though a slight blip up at the end of the month. The 2-year rate remains below 3-month TBills reflecting the markets expectations of continued Fed rate cuts. A 10-year yield of 4.11% seems low after seeing the recent CPI print with both headline and core inflation running at 3%. The markets are pricing in expectations the Fed will succeed in bringing inflation back down. The difference between the BBB yield and 10-year treasury (called the credit spread) remains tight. That slow drift lower in the 10-year real yield (magenta line) was also reflected in the new I Bond rate reset (see later).
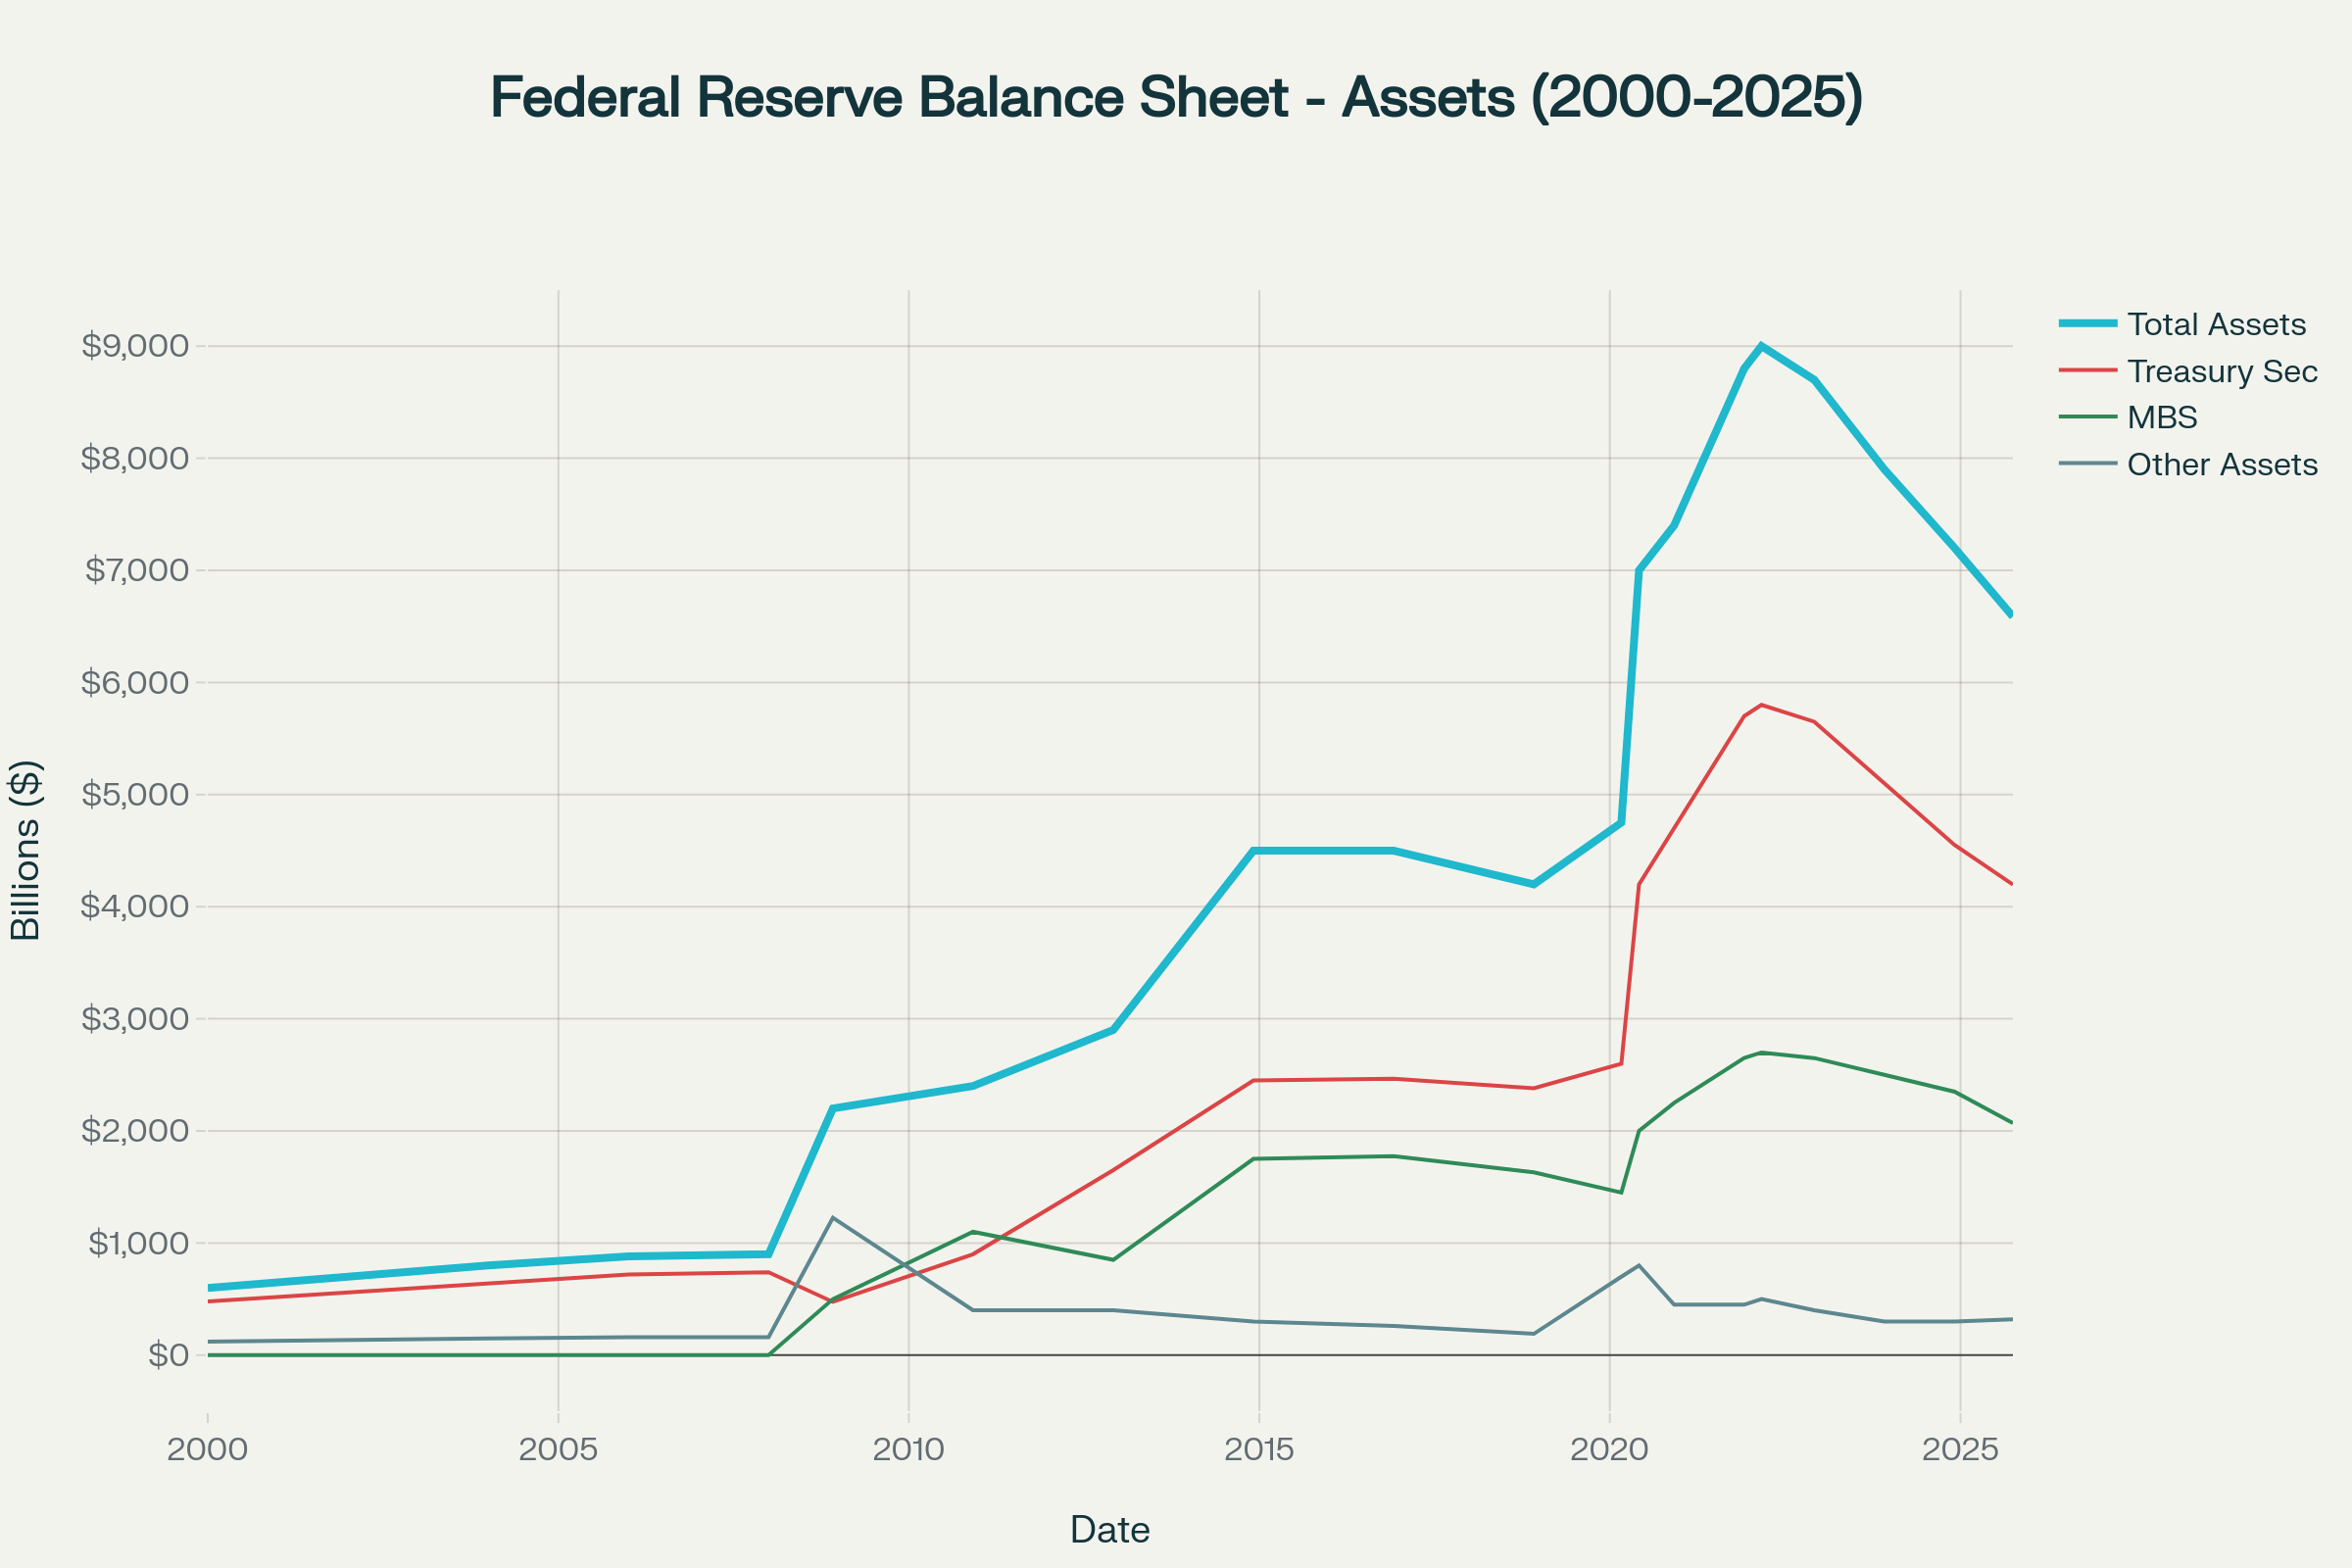
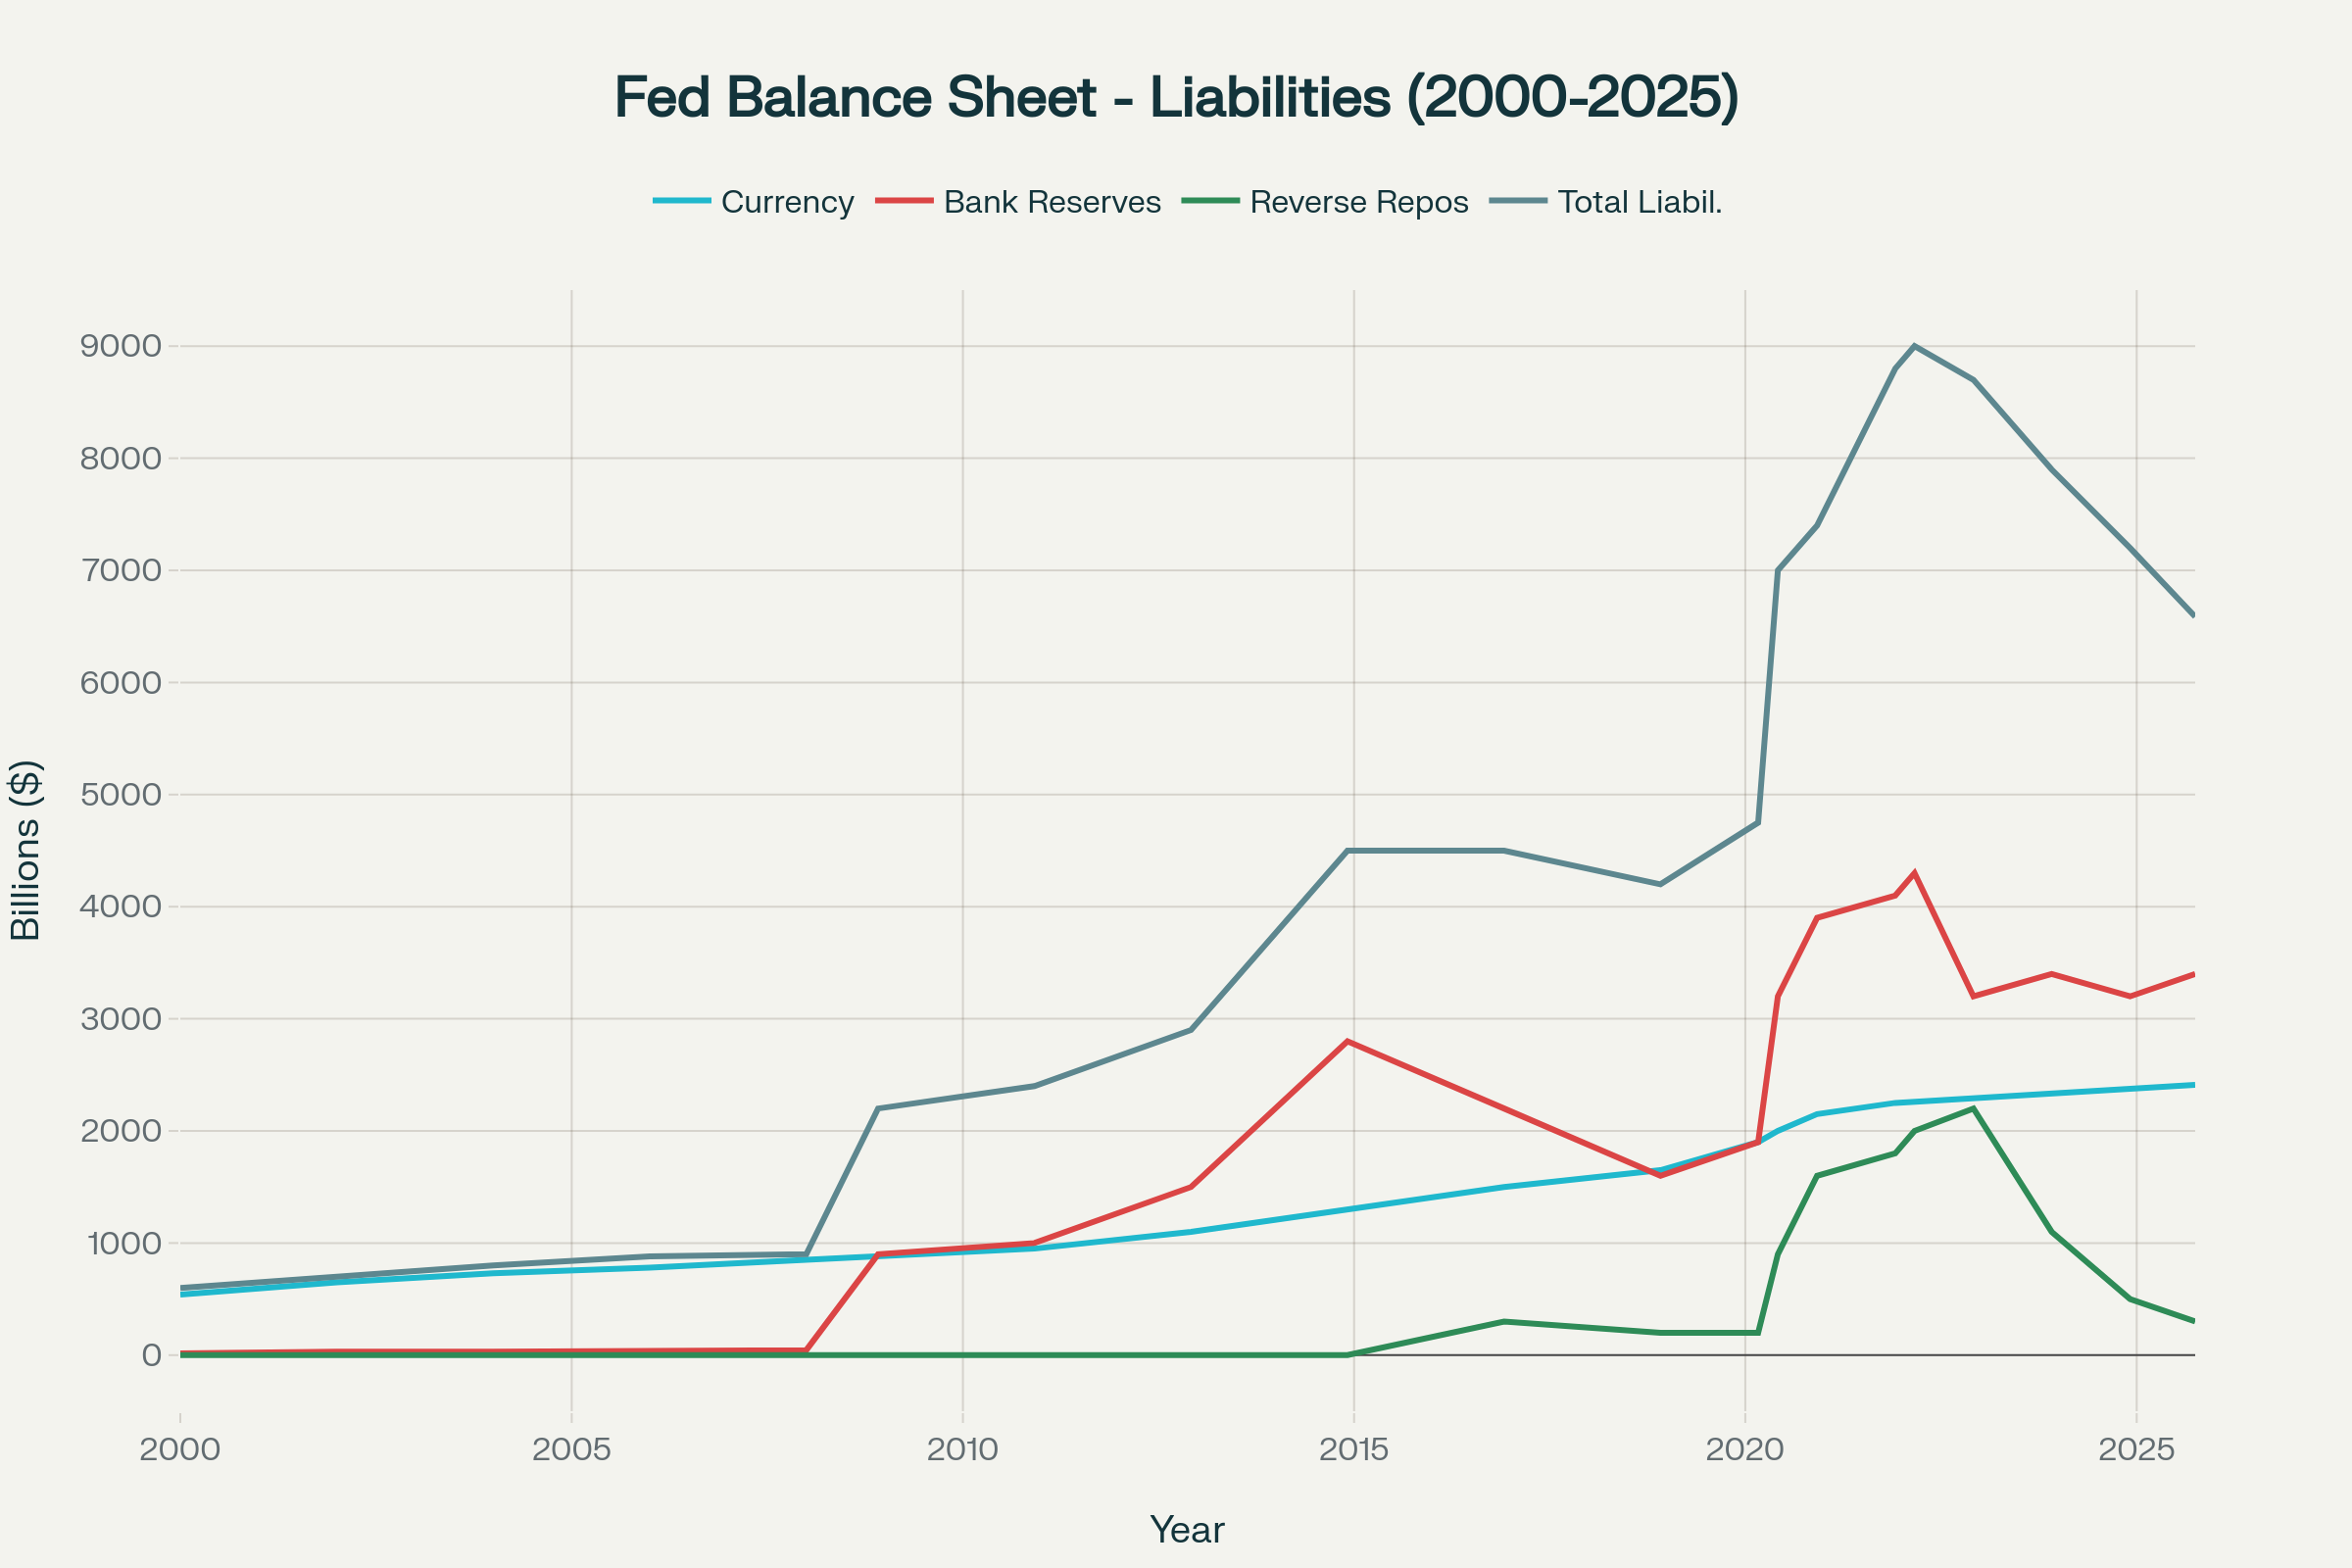
The latest FOMC meeting concluded on October 29th. The Fed delivered the expected 0.25% rate cut. Before the meeting, an additional rate cut at the December meeting was fully priced in. However, during the press conference, Fed Chair Powell stated “A further reduction in the policy rate at the December meeting is not a foregone conclusion—far from it, policy is not on a preset course.” This along with two dissents – on voting member wanted 0.50% cut and other wanted no cut - caught the market by surprise and Fed Funds futures began pricing in a possible pause in December, with implied probability about 37% at end of October (Source: CME Fedwatch). Powell also reiterated the Fed’s inflation target remains at 2%. That didn’t seem to get as much attention but it surprised me. The other Fed announcement had to do with stopping the runoff of Treasury and mortgage-backed securities starting December 1 (end of quantitative tightening or QT). Rather than letting the cash go to the open market for participants to buy, the proceeds will be reinvested in T-Bills, which is seeing a huge demand from Stablecoins. The Fed’s focus is to stop shrinking bank reserves to help move short-term funding rates lower. The graphs below show the Fed’s Balance Sheet back to the year 2000 to present (any Conan fans?). Bank reserves are a liability. Because there is no equity on Fed’s Balance Sheet (adjustments with Treasury) the Assets = Liabilities, so if assets stop shrinking the liabilities will stop shrinking. Source: Perplexity.ai PRO which used FRED data and intelligent query by user!
I have two special topics this month.
- With the official release of CPI on 10/24, the 2026 Social Security inflation adjustment was officially set to 2.8% (see last month’s blog post for how determined). The maximum wage subject to the SS portion of FICA tax was raised to $184,500. Recall Medicare has no cap and an extra 0.90% kicks in at $200k / $250k wages for single/MFJ. Note this is NOT indexed to inflation so the extra tax will keep applying to more and more people each year. Sneaky.
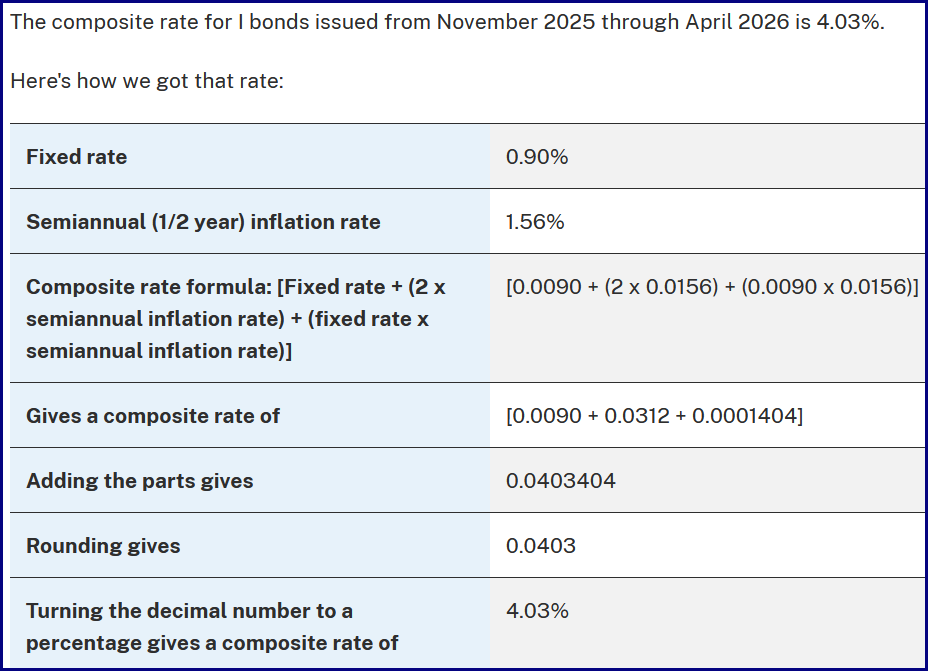
- Treasury Department set the I Bond fixed rates for new deposits over the next six months and reset the inflation component for all. The fixed rate was lowered from 1.10% to 0.90%. The inflation component was reset slightly higher and applies to all I Bonds, along with the related fixed rate depending on when deposited funds. For example, new money deposited now will earn 4.03% while an I Bond initially purchased between May 2020 through October 2022 had a 0% fixed rate and those I Bonds will earn 3.12% over the next six month cycle. See the calculations below for how the I Bond rate is determined (insert fixed rate for your particular I Bond). I will emphasize again the fixed rate component depends on when deposited funds into the I Bond and remains… well… fixed. The inflation component changes every six months.
The leaves are finally turning colors in the Chicago area. Enjoy the sights before the sun sets, which is earlier these days back in Standard Time. Darn.
Have questions? Reach out! We're happy to help.
Posted by Kirk, a fee-only financial advisor who looks at your complete financial picture through the lens of a multi-disciplined, credentialed professional. www.pvwealthmgt.com