

Asset Class Returns - 10/31/2022
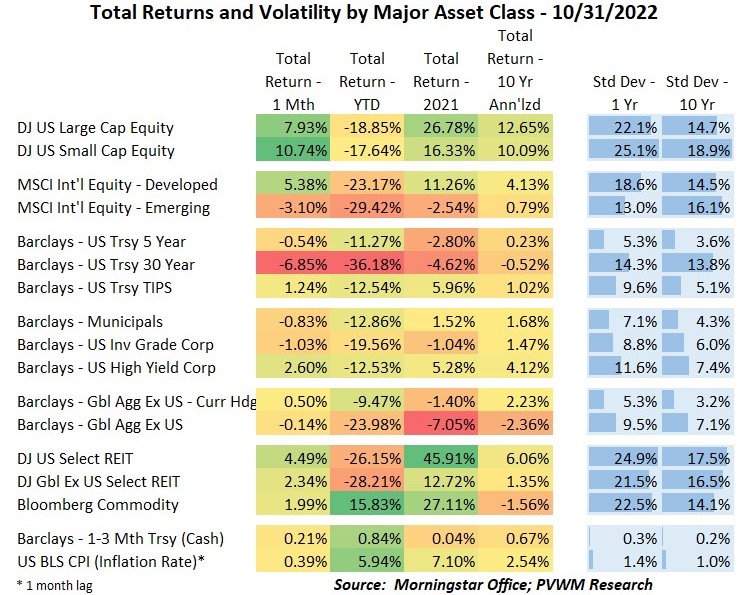
The table above shows quite the range of returns in October across the major asset classes. If you were a US-only 100% equity investor (not recommended!) you would be quite happy. If an international investor, it will depend if in developed or emerging. And what about those bonds? Long duration bonds continue to get hit hard (rising rates, falling prices) though even the higher quality investment grade index saw a loss, due to the relatively longer duration. The YTD column still looks painful.
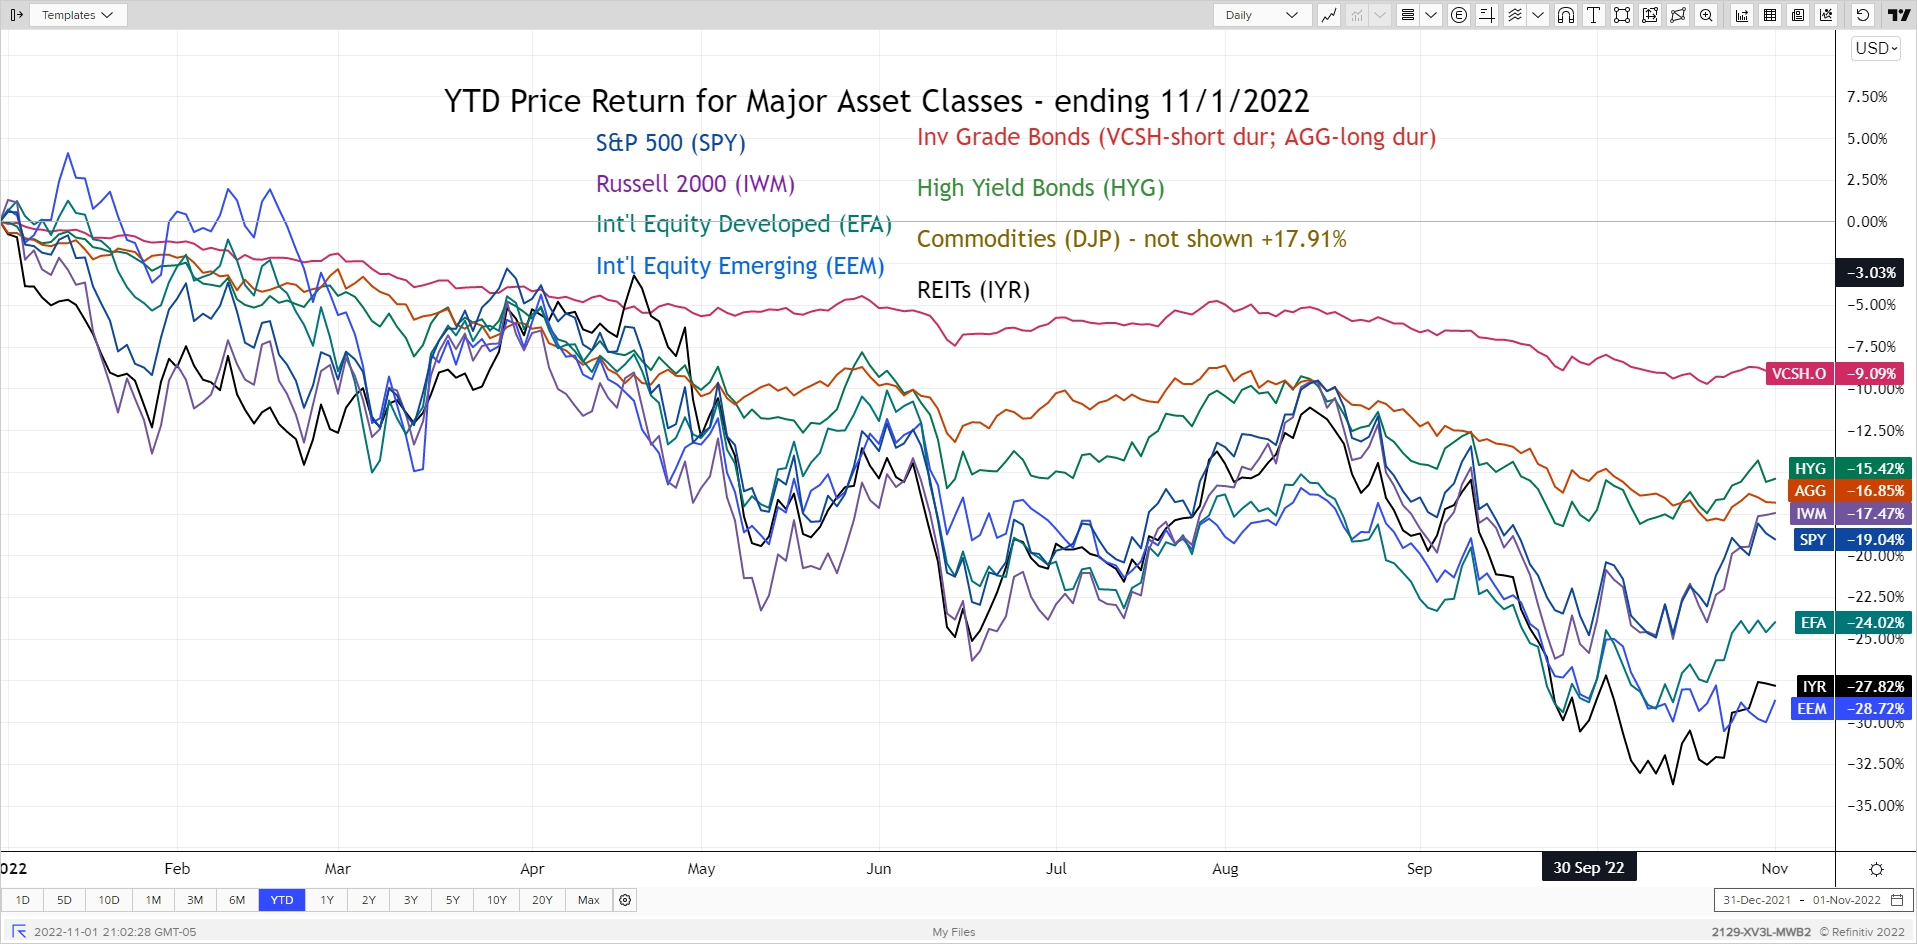
The YTD major asset classes graph below (end of day 11/1/22) once again excludes Commodities for better graph refinement for the negative-returning asset classes. After a weak start to the month, most risky asset classes rallied strongly, partially due to a change in British government leadership which caused rates to fall and eased LDI concerns (see last month’s blog post). The market also began to price in slower rate increases from the Fed, which I believe is premature. The one asset class that didn’t rally was emerging markets, mostly driven by China, that appointed Xi Jinping to a third term and continued its zero-COVID policy. While this policy weighs on expected China growth, any hint of relaxing that policy will provide a tailwind to that market. This was seen the morning of 11/1 when a headline hinted (though not confirmed) that such a relaxation is being considered and Chinese equities rallied.
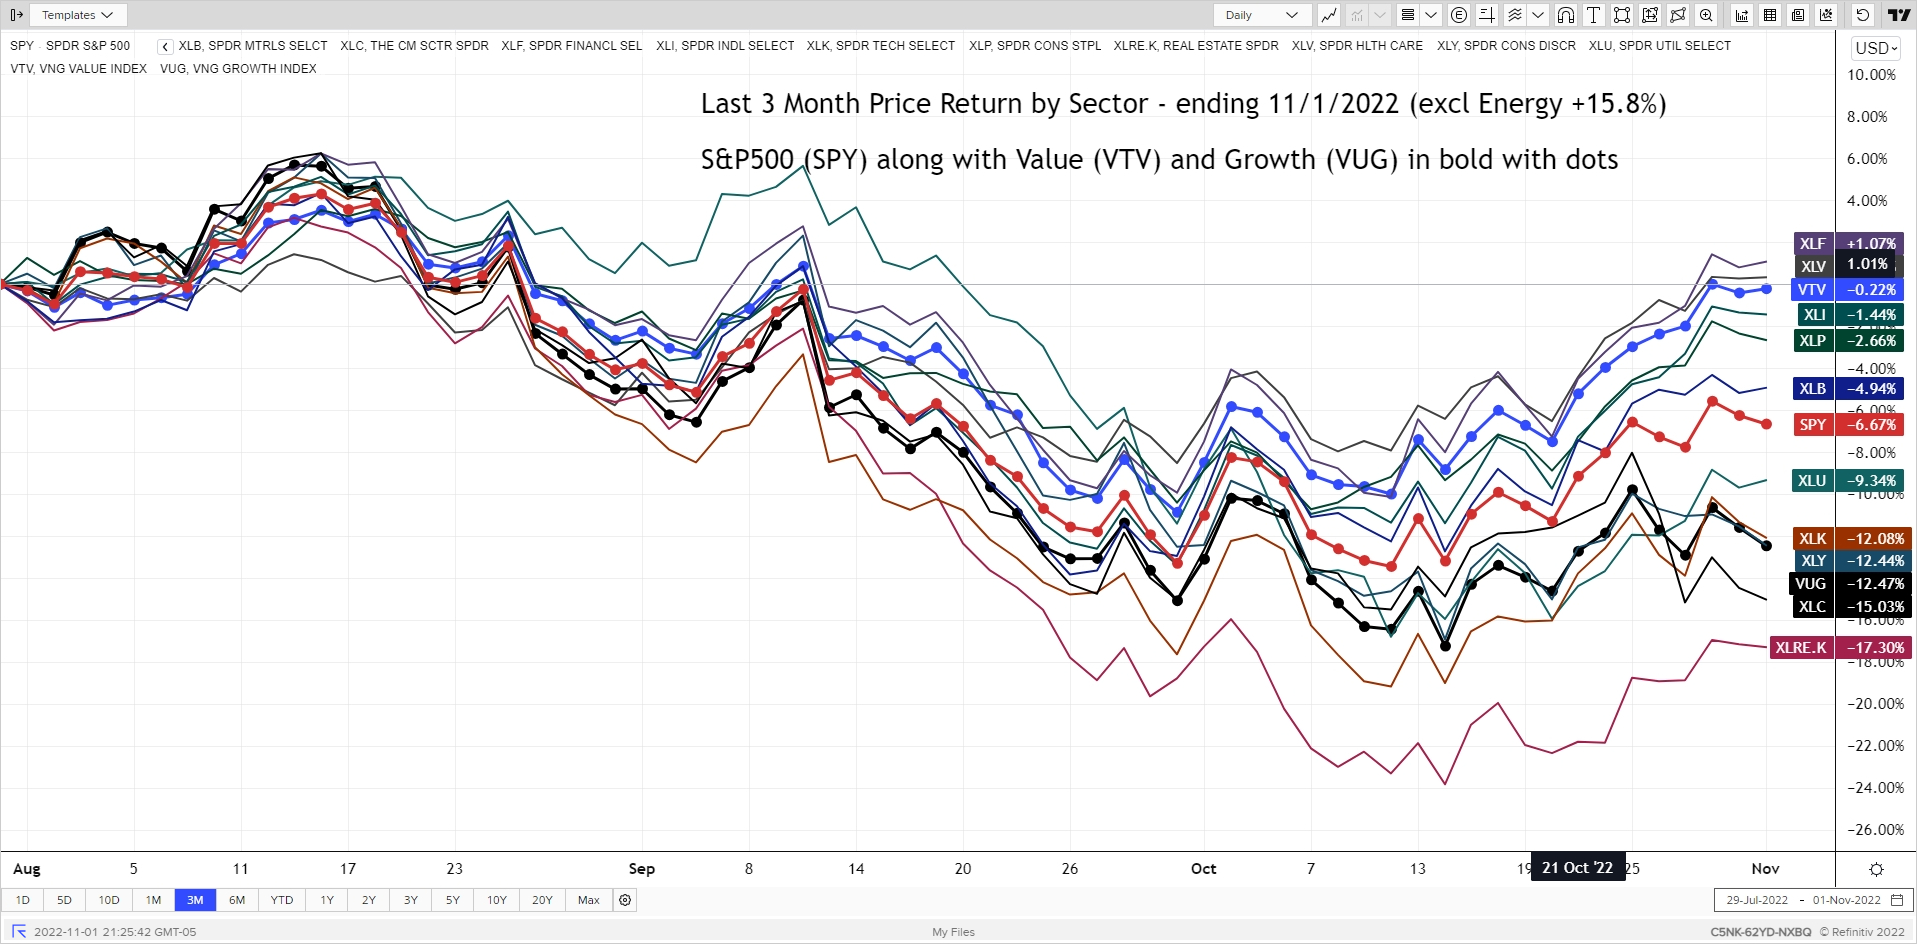
Due to the large dispersion in returns, I am showing the “growth v. value” along with sectors. It is a busy graph but I only show the past three months for context. Note the relatively flat returns for “growth” in October while “value” showed strong gains. Technology-related companies continue to lag with disappointing revenue outlooks from Amazon, Tesla and Meta (old Facebook). On the positive side, Energy, Financials, Industrials and Health Care were strong.
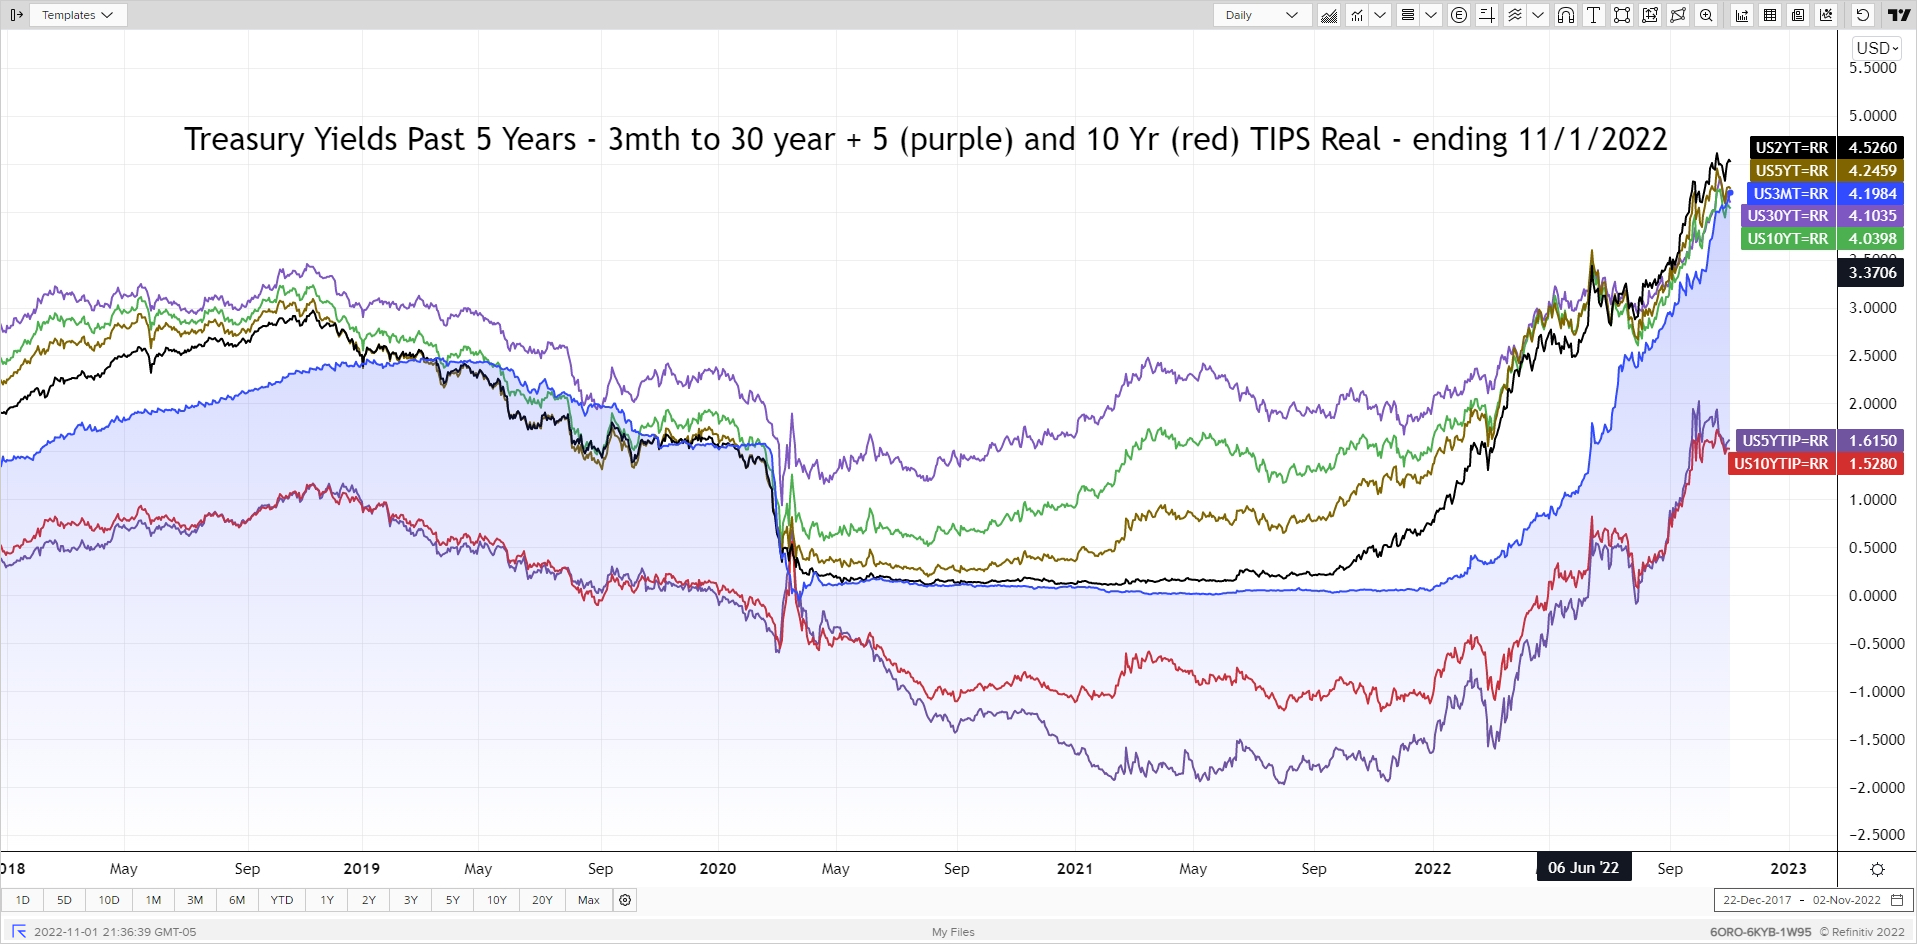
The treasury rate graph continues to deliver surprising tidbits each month. This month, notice how the 3-month T-Bill rate is now above the 10- and 30-year treasury rates. Now we are talking an inverted yield curve. The other noteworthy item is that real yields stabilized for the month as they approached 2009 levels. Over in the UK, 30-year Gilts rate (treasury equivalent for that region) settled back down to 3.6%, the level just before the LDI-driven sell-off that occurred in late September. It is good to see it settle down, but are those LDI goblins also lurking?
The FOMC concludes its next meeting November 2nd. As of end-of-day November 1 the market is pricing in an 84% chance of another 0.75% move per the CME FedWatch – bringing Fed Funds rate level to 3.75 – 4.00%. The markets are pricing in a likely terminal rate of 5.00 – 5.25% by next March and then remaining there for at least six months before coming back down. This doesn’t mean it will happen, but it does indicate what is “priced into the bond market” so you can form your position relative to that market expectation.
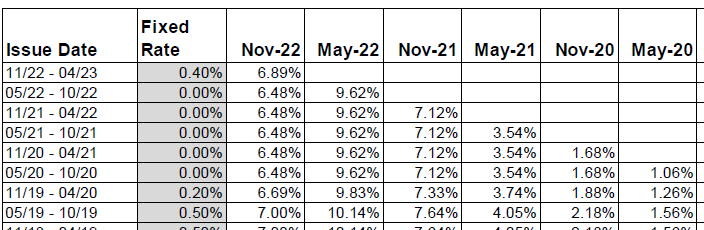
I bonds have received much attention this year due to the high inflation environment and resulting high crediting rate. The Treasury Department sets these rates every May 1 and November 1. That rate is earned for the next six months for either new deposits or existing deposit that start a new ‘6-month anniversary’ between those reset dates. This rate is based on change in CPI-U plus a fixed real rate. Prior to November 1 the crediting rate was 9.62%, all from inflation and a 0% fixed real. The new rate announced today is 6.89%. The interesting thing is this latest rate includes a 0.40% real yield. That rate will be added to each CPI-U change in the future for new contributions to I bonds over the next six months. So the drop in crediting rate isn’t as bad as first appears, given this higher fixed real-yield over time. I am surprised the real rate – which is set at Treasury discretion - isn’t higher given that open market TIPS real yields are in the 1.50% range.
To help clarify this concept, the table below shows the next six-month crediting rate for I bonds issued over different time periods. The latest six-month inflation components is 6.48%. If you deposited $10,000 into an I Bond on 5/1/2022, you earned 9.62% for the following six months but there was no real yield component. Starting today your crediting rate will be 6.48% since you locked in a 0% real yield while a new I Bond investor will get that same 6.48% plus the 0.40% real yield. Someone who started an I Bond between May ’19 and Oct ’19 will be receiving 7.00% when their ‘6-month anniversary’ comes up (not 6.99% due to rounding).
Next week is the end of daylight savings time - a joy for those early morning walkers and a dread for after-work bike riders. Whichever end you are on, enjoy the extra hour of sleep or reveling.
Posted by Kirk, a fee-only financial advisor who looks at your complete financial picture through the lens of a multi-disciplined, credentialed professional. www.pvwealthmgt.com