

Asset Class Returns - 9/30/2022
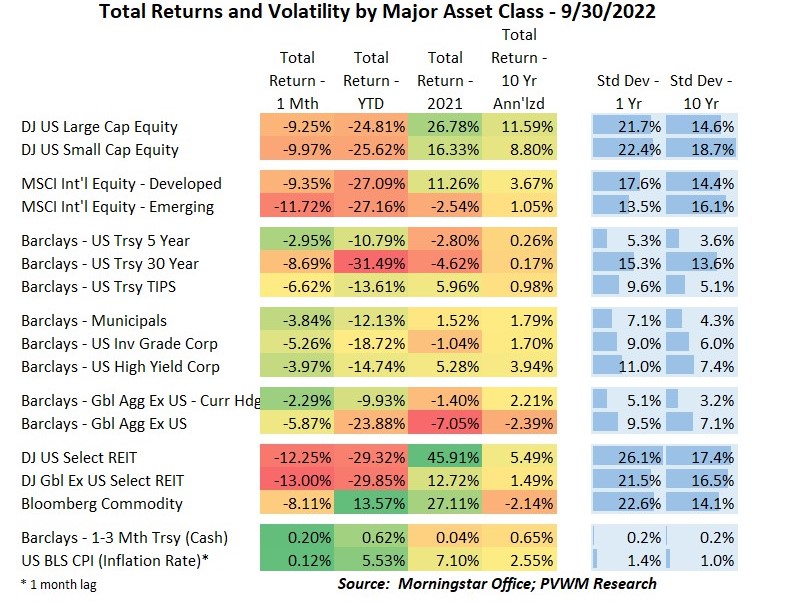
The table above shows the damage done in September. There isn’t a single positive return for the month, except for cash and inflation. Four things jump out from the table above:
- How tight (and low!) the YTD negative returns are for equities across US large and small and Int’l developed and emerging – down 25%-27%
- The largest negative YTD return belongs to treasury bonds, albeit long duration
- REITs got smoked this past month and now have the worst YTD returns after long-dated treasuries
- The strength of US dollar is highlighted by comparing global aggregate bonds with / without currency hedge – about 14% YTD return difference.
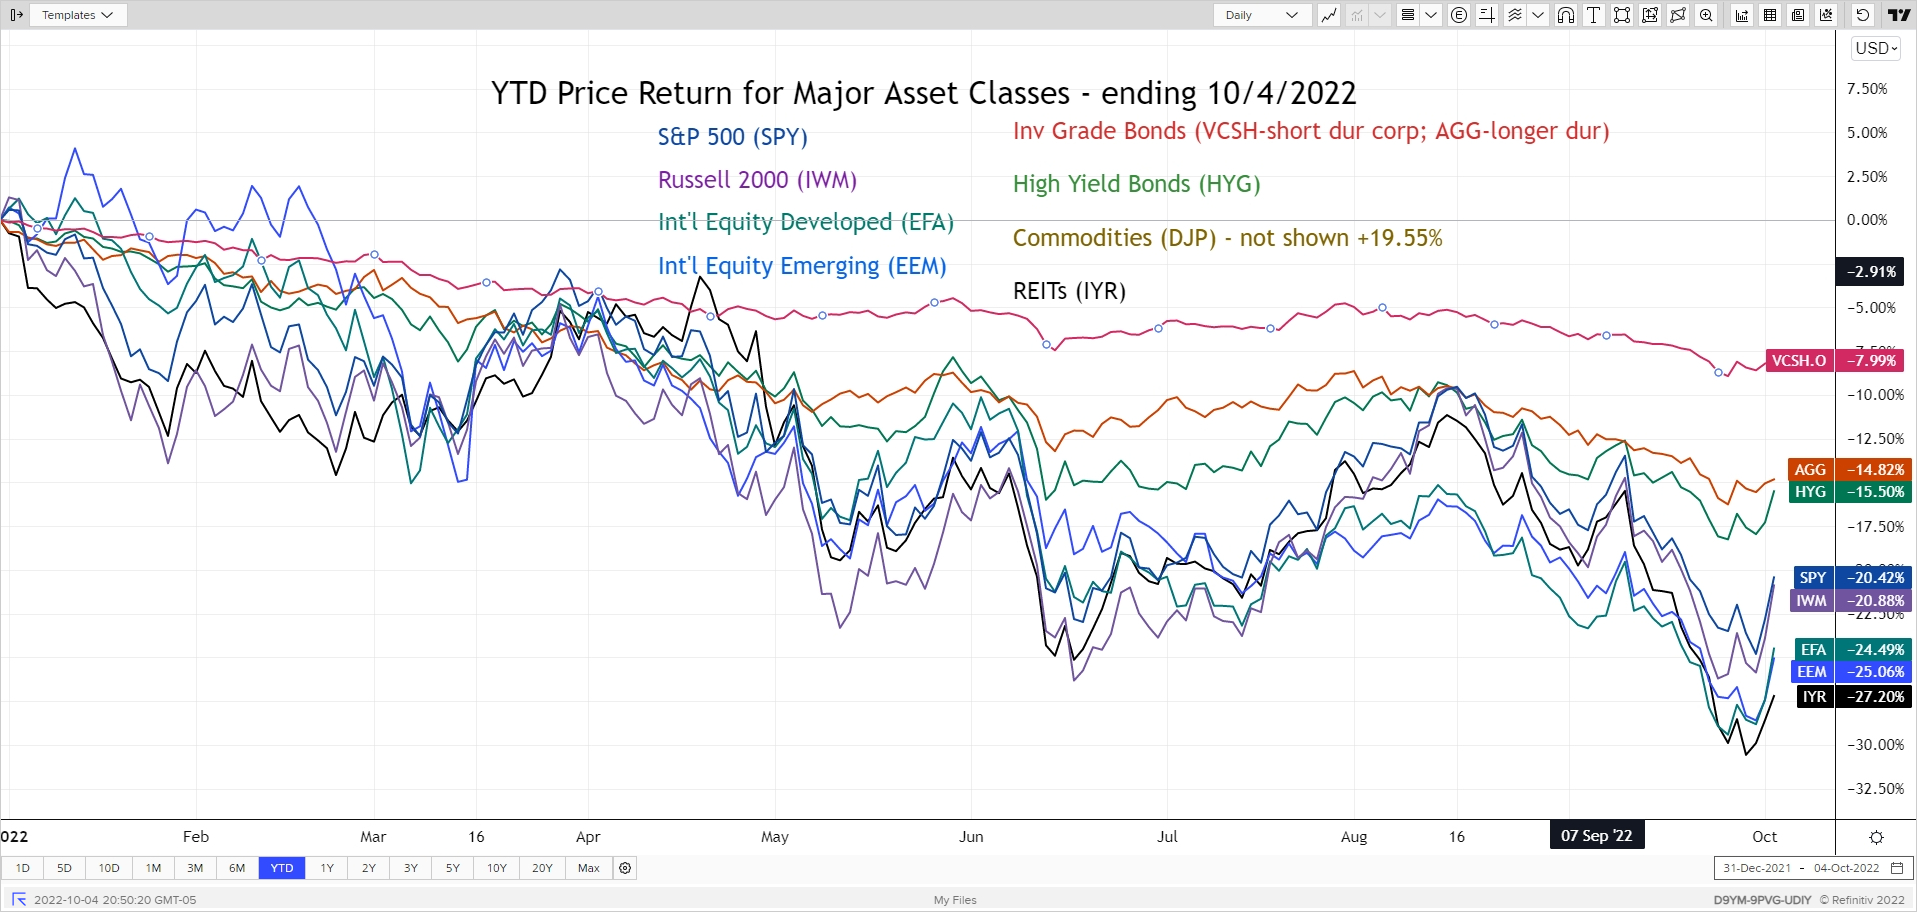
The YTD major asset classes graph below (end of day 10/4/22) shows the usual asset classes except for Commodities (large positive continues to distort the graph). The markets not only retested but broke through the lows of mid-June, ending the month with a very weak tone. The first two days of October saw a huge rally on the back of British government walking back parts of their fiscal package and some Central Banks indicating a slower pace on rate increases. Don’t be so sure. Upcoming third quarter earnings will shed more light on the markets. At the sector level, Utilities saw a large loss for the month on back of rapidly rising rates - though still lead the pack YTD with a 3.80% return. Other defensive sectors like Healthcare and Consumer Staples are also only down just over 10%.
As has been the major theme all year, falling bond prices and resulting higher interest rates again dominated September. Late this past month the UK bond market also added a little sizzle.
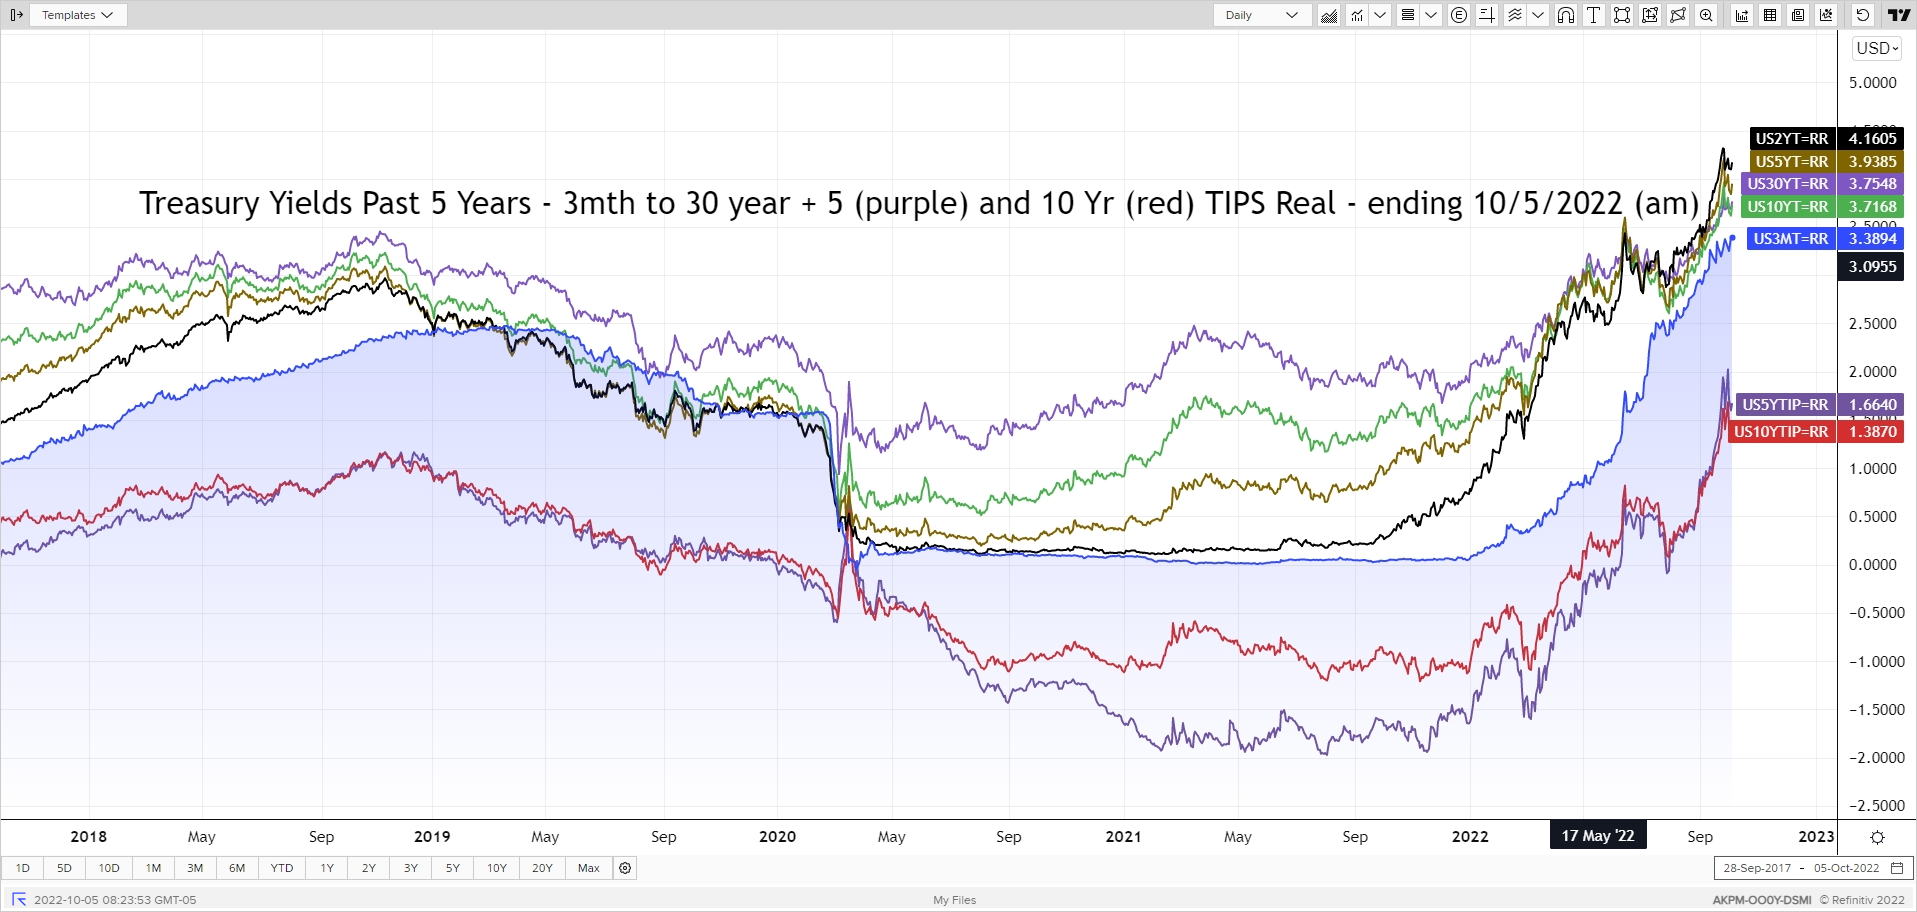
Starting with our usual graph, you will see the rising rate theme that resumed in August kept on going into September. Let me emphasize these are very substantial rate moves taking place in a relatively short period of time. Some observations:
- The boring 3-month T-Bill is now over 3.4%
- 2-year rates rose more than 0.65% for the month while 10-year rates over 0.50%
- 5-year real yield rose more than 1.0% mid-month, then settle up “only” 0.85%
- Big jump in rates Sep 22 - 27 (over 0.45% for 10-yr) were result of global rate moves after UK markets didn’t like fiscal measures; rapid reversal on Sep 28 explained later
- Not shown on graph: 30-year fixed rate mortgage keeps rising; weekly average from Freddie Mac at 6.7%; more timely Mortgage News Daily index saw levels above 7%!
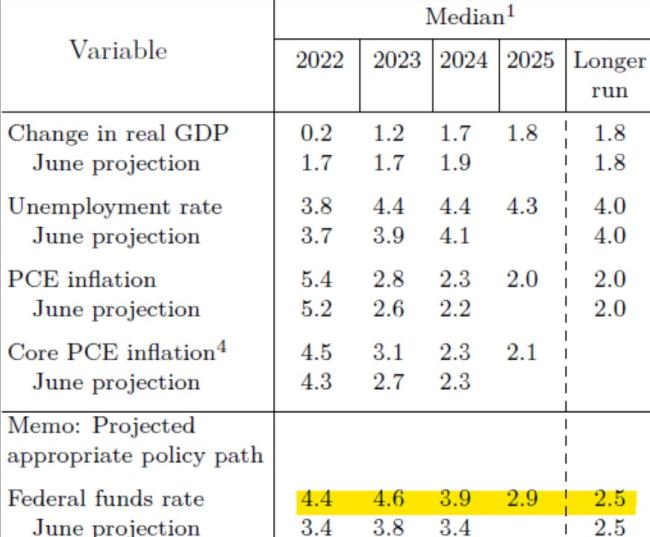
The Federal Reserve concluded its latest meeting Sep 21 and delivered on the expected 0.75% rate increase, leaving Fed Funds in the range of 3.00 – 3.25%. This meeting also included the updated “Summary of Economic Projections” (see table below) including expected Fed Funds rate (the dot plot) along with projections for GDP, unemployment and inflation (using PCE, not CPI). The big surprise was the higher expected Fed Funds rate at the end of the next four years. Not only was there a large jump for year-end 2022 (up to 4.4%) but the next couple years show an elevated level indicating no “pivot”. Surprisingly, the other economic projections looked fairly tame given this higher projected rate environment. And in case there was any doubt the Fed will continue raising rates as stated during the strong Jackson Hole speech in late August, Chairman Powell answered the first question at the press conference by first stating:
CHAIR POWELL. So, I will answer, I will answer your question directly, but I want to start here by saying that my main message has not changed at all since Jackson Hole. The FOMC is strongly resolved to bring inflation down to 2 percent, and we will keep at it until the job is done.
The next FOMC meeting concludes November 2nd. The market is pricing in a 67% chance of another 0.75% move per the CME FedWatch on 10/5/22. And as a friendly reminder, the Federal Reserve is now on their faster pace of reducing its balance sheet - $60 billion per month for Treasuries; $35 billion per month for Mortgage-backed-securities. Giddy-up!
When rates move as far and as fast as they have this year, especially in late September, something is likely to break. There were two signs of that recently.
- Liability Driven Investing – A strategy used by pension plans, especially those in England, where an asset manager uses bonds and interest rate swaps to match assets with liabilities of a pension plan. Embedded in these strategies is leverage and when rates rise quickly and bond prices fall, the pension funds have to put up more collateral to the asset managers. The rapid rise in rates after UK fiscal measures announced culminating on Sep 27th caused massive amounts of collateral requirements. Pension plans have to sell bonds for collateral which further fueled more selling/rate rises. Finally the Bank of England stepped in to buy UK bonds (gilts) in whatever size was needed to stabilize the market – which worked very quickly short-term. However, the Bank of England program ends on Oct 14th giving the pension funds time to build up cushion. We will see if successful.
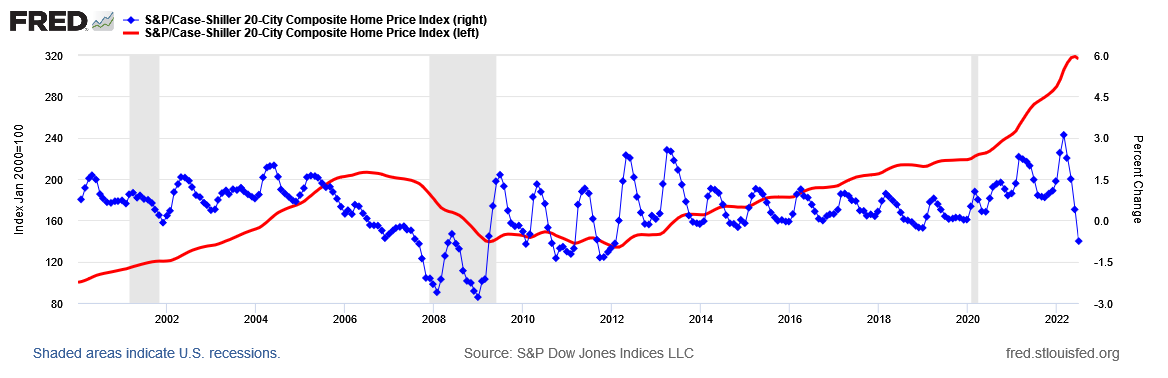
- Housing Market – The Case-Shiller Home Price Index shows average prices across major metro areas. This index reports home price closings with an inherent lag. The last few reports showed a decreasing monthly trend with the latest report showing an actual drop in prices. These adjustments are typically slow-moving and with the extreme rise in mortgage rates relative to the end of 2021, you can expect a continued slowdown. Unlike the 2008 crisis, many existing homeowners have mortgage interest rates locked in at fairly low levels so they will not be directly affected if plan to stay put. But it will slow activity for people hoping to sell and buy a new place since they will be reluctant to give up the old mortgage rate unless prices on the new home adjust down. The graph below shows the monthly change in home index (blue line, right scale) compared to home price index with a base of 100 in January 2000 (red line, left scale).
Enjoy the month of October – some say the best month of the year! For the Social Security recipients anxiously awaiting the inflation adjustment for 2023, you will have your answer after CPI released on Oct 13th. I am estimating in the 8.5% range given the first two of three CPI numbers needed for the calculation. Medicare premiums have been announced by CMS for 2023 and are going down – yes down – to $164.90/month for standard premiums. One of the main drivers was Medicare limiting use of the expensive Alzheimer’s drug Aduhelm. IRMAA surcharges are only going down slightly but at least the trigger amounts saw a nice 6.5% increase ($97k single; $194k joint for first wave).
Posted by Kirk, a fee-only financial advisor who looks at your complete financial picture through the lens of a multi-disciplined, credentialed professional. www.pvwealthmgt.com