

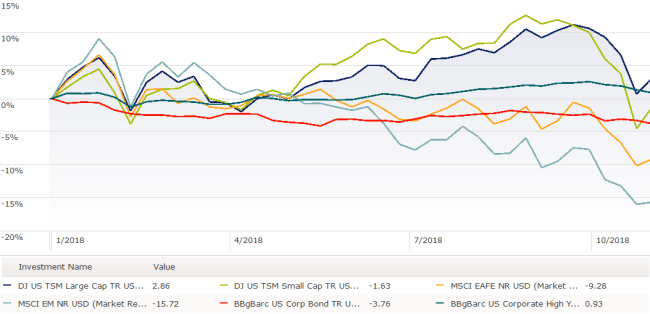
Asset Class Returns - 10/31/2018
As you are probably aware, almost all asset classes were down this past month. Even the usual favorable effects of rising bond prices didn't help except for short-maturity treasuries and currency-hedged international bonds. There was a small bounce at the end of the month in equity markets to soften the blow.
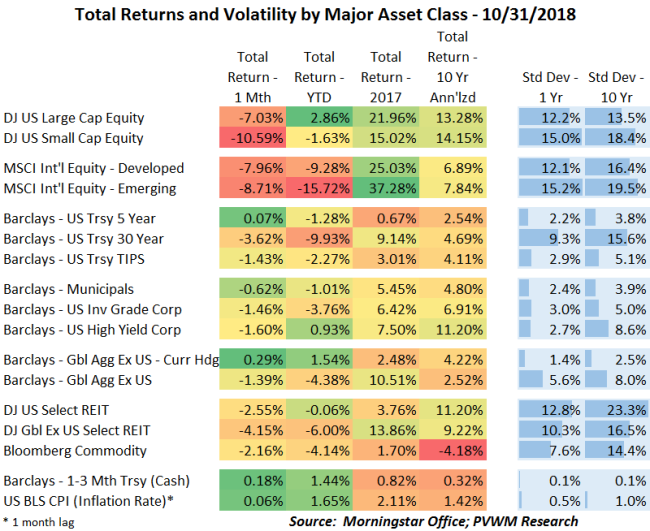
Both US and international equity markets lost more than 7% for the month and the riskier asset class in each - US small caps and int'l emerging - lost even more. For the year, US large caps climbed back late in the month to show a positive YTD return but not the small caps. The international equity markets are a long way from positive YTD returns despite their more attractive valuations relative to the US. Recall a stronger US dollar reduced returns for investments held outside the US. At the sector level, there was quite the dispersion in returns this past month. The only two positive sectors were Consumer Staples and Utilities; Energy and Consumer Discretionary were the worst performers. The technology sector also took a hit, as did growth and momentum factors in general. The DJ commodity index was down about 2% for the month and YTD, mostly driven by energy. The energy heavy GSCI commodity index was down close to 6% for the month, but up 5% YTD due to the higher energy weight.
YTD Returns for Select Asset Classes Through 10/31/2018; Source: Morningstar Office; PVWM Research
One 'positive' thing this volatile month did was put the short-term volatility closer to the long-term (as measured by 1- vs. 10-yr standard deviation). I know this doesn't feel good but it may help shake off any complacency investors may have had in historically riskier asset classes. Implied volatility as measured by VIX (the forward-looking 1-month vol) jumped from around 12 to over 25 a couple times during the month and settled around 20 as the door-bells were ringing with trick-or-treaters.
Interest rates were interesting this month. During the first week of the month, the 10-year treasury rate jumped about 20 basis points as the Fed reiterated its intent to continue rate hikes. Then with the sell-off in equities (partially driven by the rate move) rates fell with the safety trade, but did not fall back to the beginning of month levels which is telling. High yield bonds finally saw a loss this month with the risk-off trade though remain positive YTD. The media hasn't talked about the yield curve in a while with the potential recessionary signal. Using FRED, the 2s/10s curve went from a low of 18bps in late August to 35bps after the early-month rate spike and now settled around 28bps. The 10s/30s curve has been quietly drifting up since the summer as economic growth continues and tax-deductible pension demand slows. If you want to see pictures click here and scroll to a bottom graph.
Finally, in case you missed it, the Social Security inflation adjustments are out for 2019. Those receiving benefits will see a 2.8% increase; higher income earners still paying FICA taxes will see the max salary subject to the 6.2% tax go up by 3.5% to $132,300. See my recent blog post for details. Medicare Part B premiums are going up a $1.50/month to $135.50/month if MAGI from 2017 is below $85k single-filer, $170k joint-filer. For those subject to the higher premiums - IRMAA- your premiums will be going up more than $1.50/month. Look for my future blog post with all the details.
Posted by Kirk, a fee-only financial advisor who looks at your complete financial picture through the lens of a multi-disciplined, credentialed professional. www.pvwealthmgt.com