Asset Class Returns - 09/30/2020
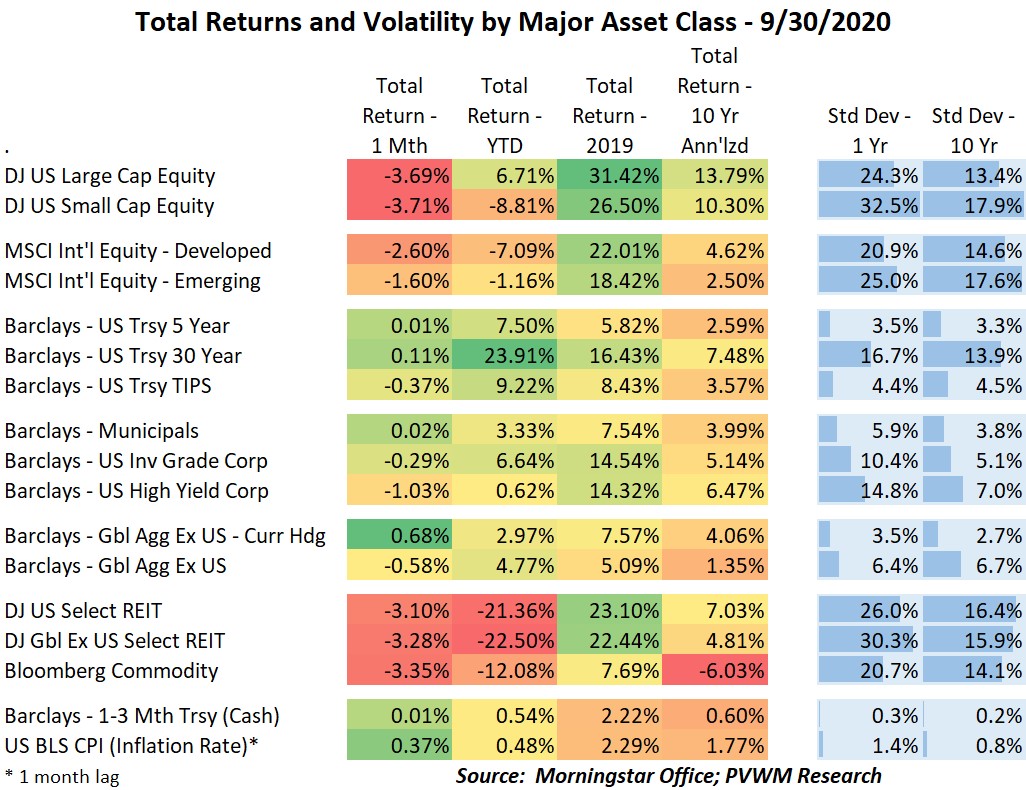
Recall last month’s blog post noted the red-hot markets, in particular the technology sector. That changed in September as most risky asset classes pulled back through mid-month. The term ‘correction’ even came back in market chatter as the NASDAQ fell more than 10% from its most recent peak on 9/2. Even the broader US equity indices, both large and small caps, were very close but did not exceed a 10% drop. But don’t forget that strong run in August which created quite the peaks. The major equity indices are still higher than July 31st. The growth vs. value differential narrowed about 8% mid-month though ended the month only 3% tighter.
Some of you may have heard about Softbank being the big whale moving technology stocks with levered derivatives in August. One market volatility specialist believes Softbank wasn’t the only (and not primary) driver but rather the cumulative collection of many retail accounts following along on similar trades. Here is a recent podcast published on 9/14 for those interested in a deeper dive. NOTE: the strategy described is NOT how I use options.
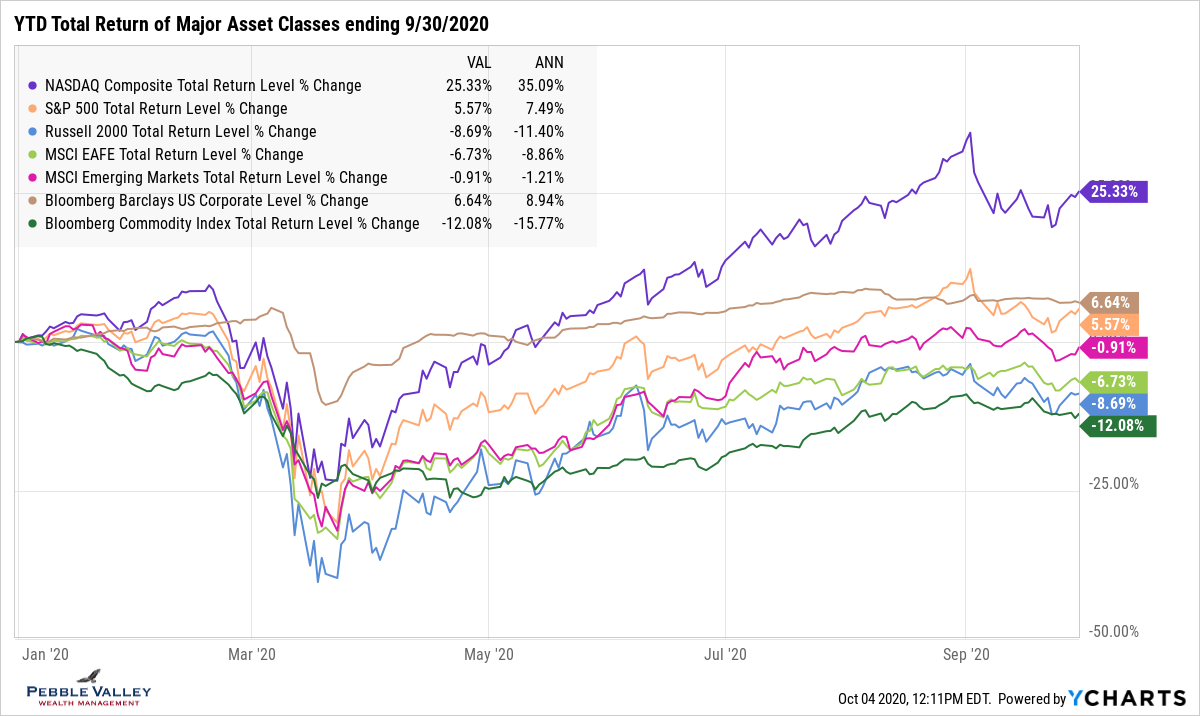
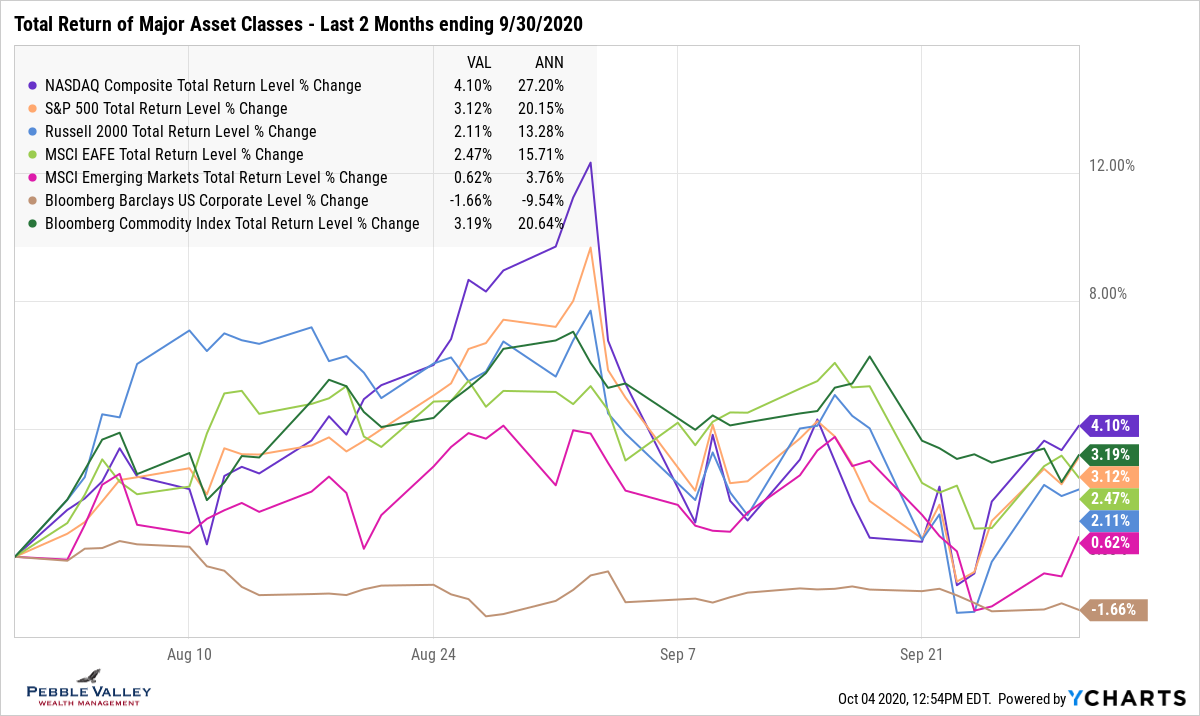
There was also a noticeable positive shift toward end of month after the bipartisan Problem Solvers Caucus proposed a $1.52 trillion (with a “t”) framework for the relief/stimulus bill the previous week. I follow the usual YTD graph of major asset classes with a two-month view to see this dynamic. Also note the negative print for this time period from the corporate index. Treasury rates were flat during September after rising (prices falling) in August. These rates bear watching, with potential for further rising if the current relief bill is passed, results of the election which may impact future spending plans, and the Fed’s intent to let inflation run above 2% for some time (see later).
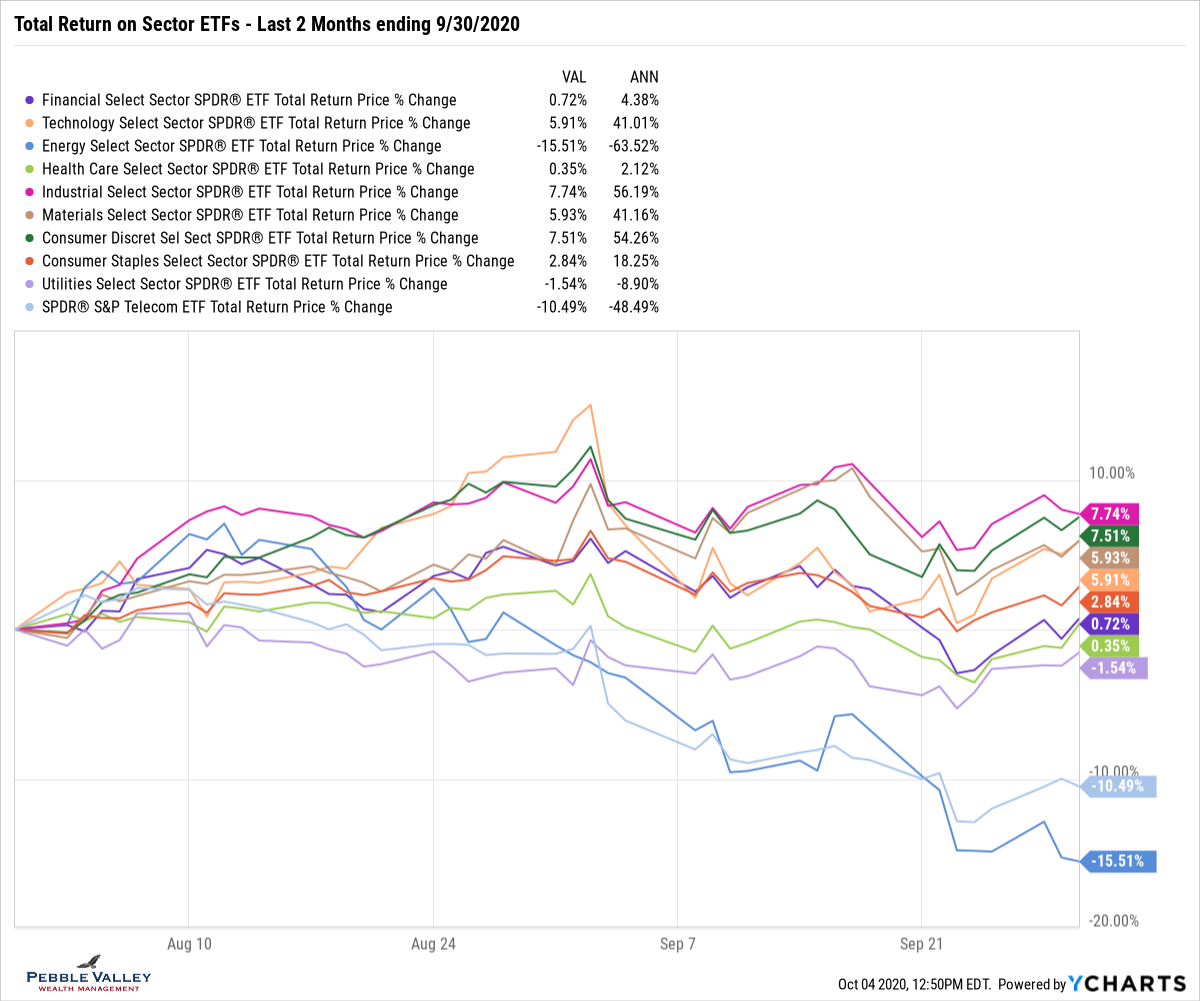
On the sector front, using the same two-month view for focus, energy took another leg down in September as global growth and a stronger dollar provided headwinds. Financials were replaced by utilities and telecom as the other negative sectors. Most of that damage was done in August with higher rates.
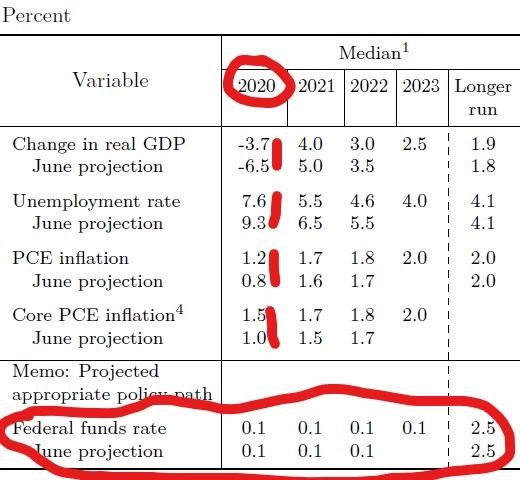
Speaking of rates, the FOMC meeting that concluded 9/16 included an update to economic projections which were more constructive for 2020 than the June projection. There was also reinforcement of the intent to keep short-term rates near 0% for a long time (see table below). The Fed also clarified its 2% inflation target framework. “With inflation running persistently below this longer run goal, the Committee will aim to achieve inflation moderately above 2 percent for some time so that inflation averages 2 percent over time and longer-term inflation expectations remain well anchored at 2 percent.” And while the Fed will continue to purchase bonds at the current pace, there was no mention of a rate cap on longer bonds. This may lead to higher rates for longer maturities while short-term rates are anchored near 0%.
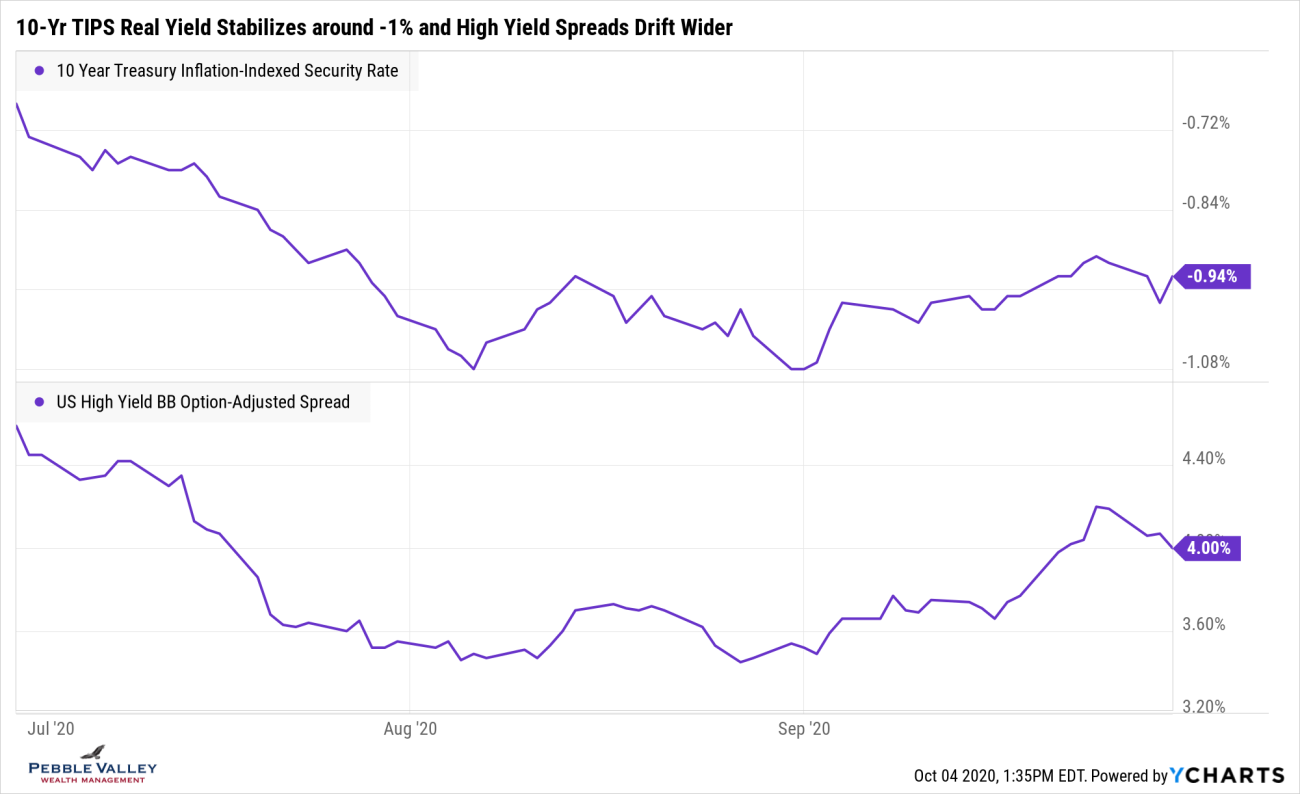
What else is on my mind? 10-year real yields from the TIPS market remains around -1% but has not fallen beyond that the last couple months and high-yield spreads widened in September along with the equity pullback, but not a major move. Some market strategists point to the negative real yield as a driver to higher equity valuations of longer-term growth stocks.
Enjoy the fall season and hopefully some form of trick-or-treating at month-end.