

Asset Class Returns - 07/31/2020
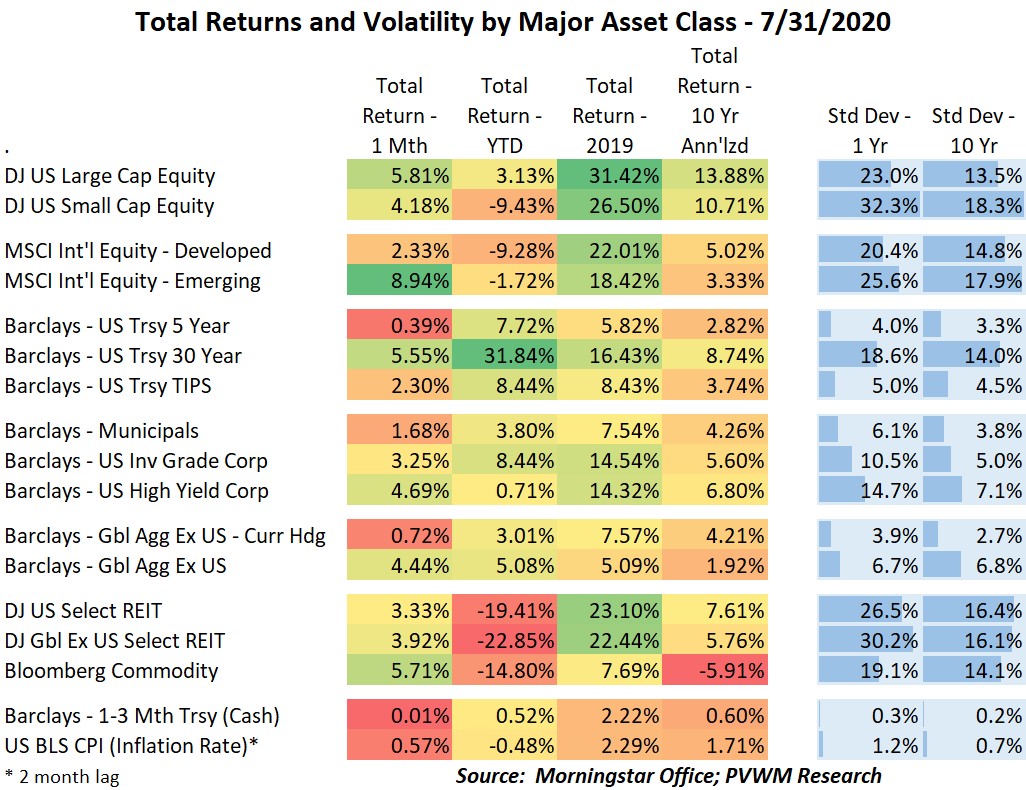
This month I will start by showing YTD total returns for key asset classes, then drill into more detail on a few. Equity markets continued their march higher from the March lows, deviating further from the underlying economy. US Large Caps are now positive on a YTD basis (with dividends) and the corporate bond index continues to receive the Fed kiss.

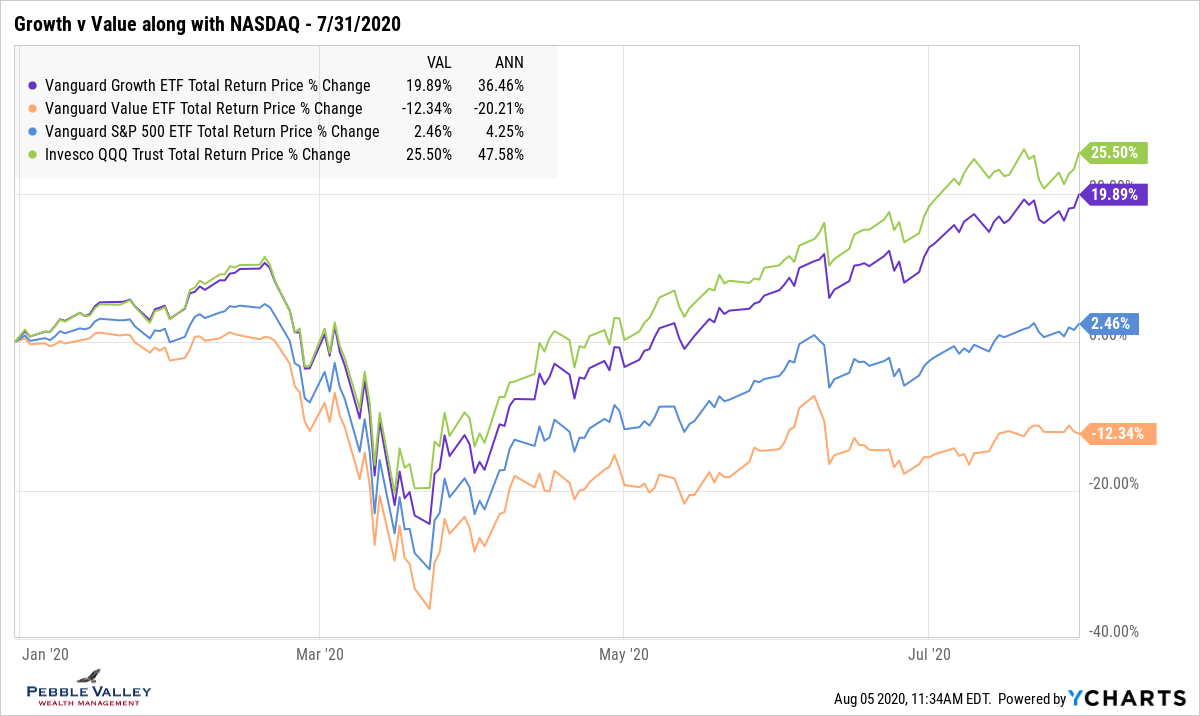
Within US large caps, growth stocks – and technology in particular – are leading the charge. This next chart uses ETFs to show US large caps (VOO) along with tech-heavy NASDAQ, Growth and Value ETFs. The tech sector recouped the YTD losses in late April and has continued to power ahead. The more traditional "growth v. value" has diverged substantially this year and while there are more than tech stocks in "growth", it is a key driver. Energy and Financials are two sectors in "value".
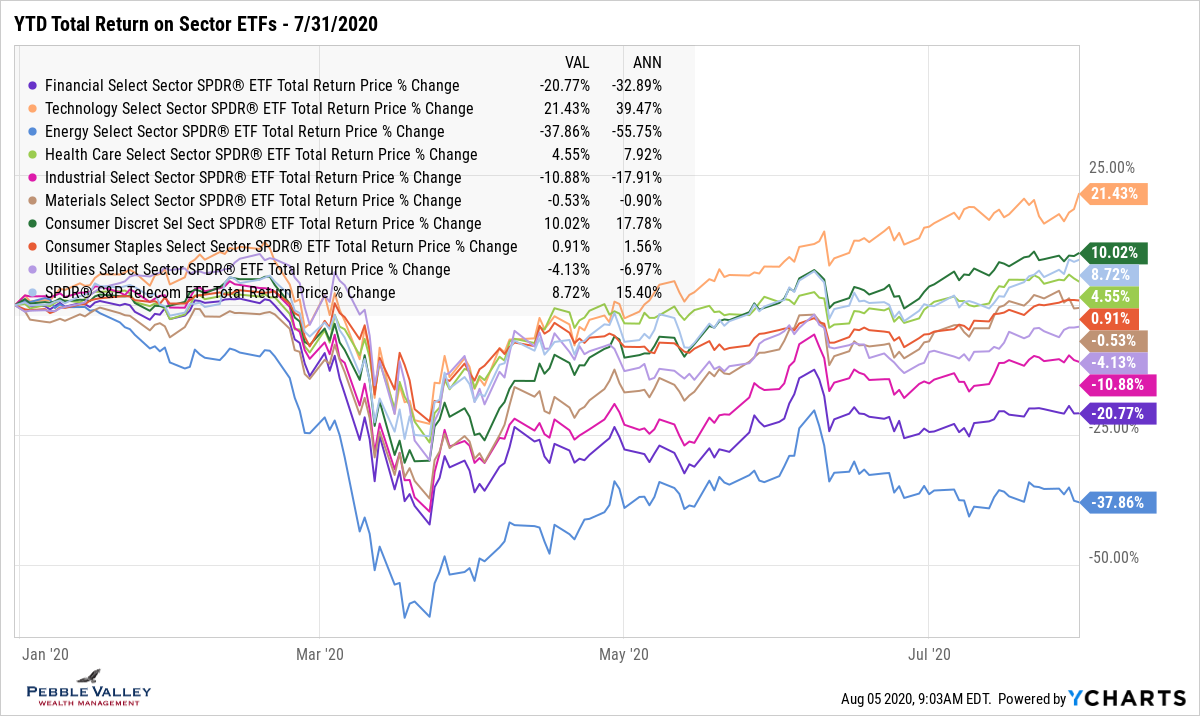
Taking a deeper dive into sectors, there are three sectors outside the pack - Technology to the upside and Financials and Energy to the downside. If you have a "mean reversion" bias to your investing and want to do in lower risk fashion, options can be interesting (hedging tech gains with collar spreads; cash-secured puts with lower strikes if looking to add energy and financials). The other interesting comment is the sector's weights as % of total S&P500. The Technology sector makes up an eye-popping 27.5% and that doesn't even include Amazon (just under 5% weight) which is part of the Consumer Discretionary sector. The next largest sector is Health Care at 14.6% (Source: S&P Dow-Jones Indices website: QuickFacts - 7/31/2020).
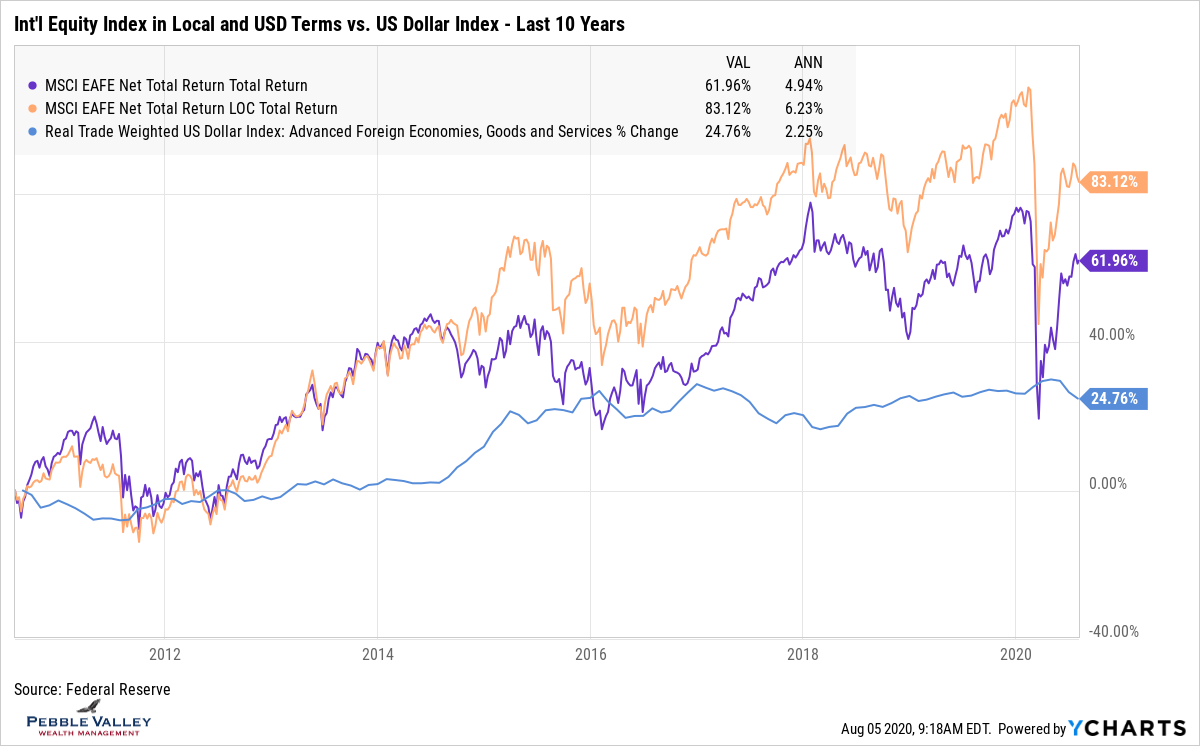
Rather than showing YTD total returns for international equities, I want to highlight the impact the US Dollar has on returns experienced by a US-based investor. The graph below shows the MSCI EAFA Index (Europe, Australia, Far East - developed mkts) in both local currency (LOC) and converted to US $'s. I also show the % change in US $ index. You can see when the US$ strengthens the returns experienced in the US lags. A similar impact will occur if the US $ weakens. This can be seen in the table at very bottom by comparing the monthly return of Global Bond index with and without currency hedge after the recent dollar weakening. Currency movements are impacted by many factors but a predominant factor is flow of funds. With the Fed stating that rates are on hold for a while and a growing US debt as % of GDP ratio, a potential weaker dollar can bode well for international investments, all else equal.
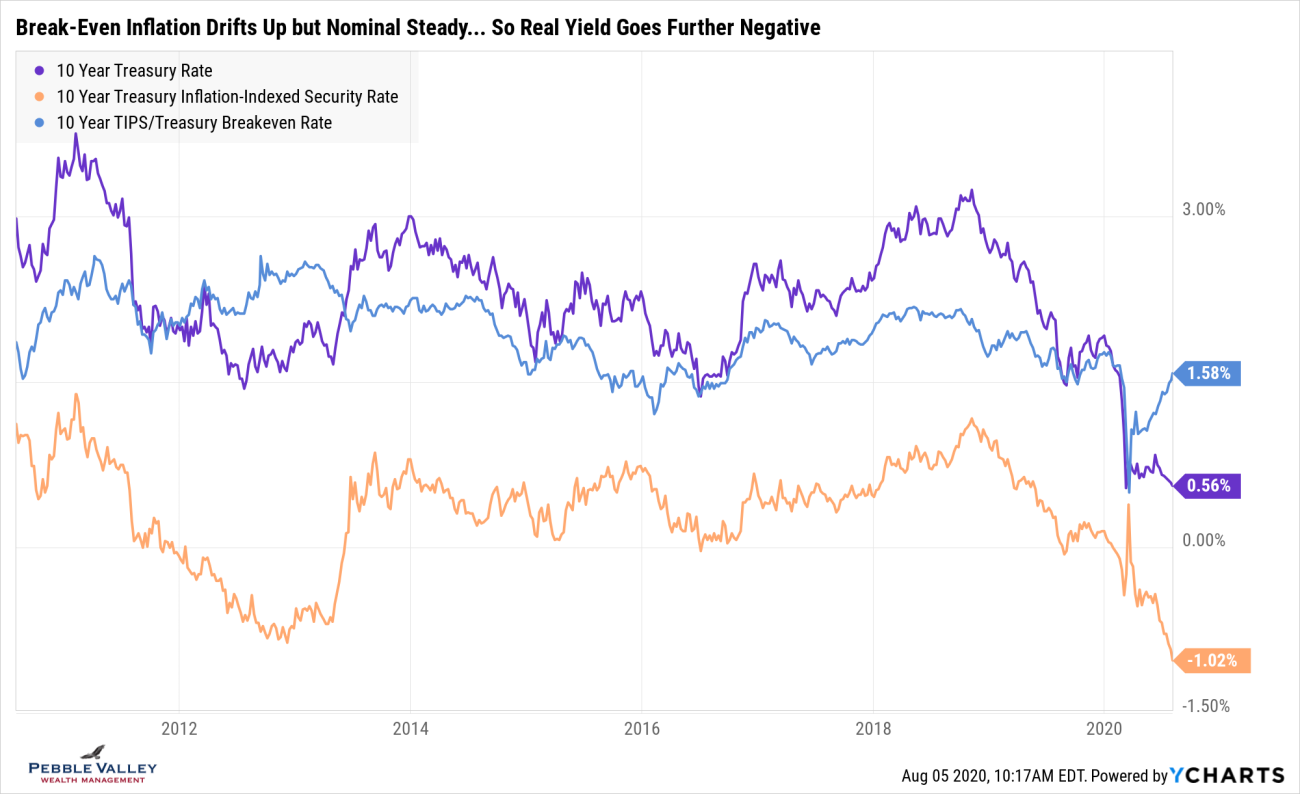
The final graph I share is from the Treasury Inflation Protected Securities (TIPS) market. Using the 10-year maturity, I show nominal yields (purple line - familiar treasury rate - though not so low!) vs. the real yield from the TIPS bond (orange line). The difference between the two is the market implied break-even inflation rate over the next 10 years (blue line). If you think actual inflation will be lower, favor nominal treasuries; if higher favor TIPS. Nominal rates remain low given Fed action and lack of global growth. However, the market is pricing in more inflation and if nominal rates don't move, the real yield offered by TIPS goes down (and TIPS bond prices go up). So if you think the market is not pricing in any inflation given low treasury rates (nominal), you would be wrong. The Fed is very committed to seeing higher inflation. From a 'paying off large debt perspective', the Treasury and US taxpayers may not mind either near-term but it can easily get out of control.
Enough of the drill-in on data. The monthly jobs report is out this Friday but you can also watch the weekly initial and continuing jobless claims every Thursday morning for a more real-time gauge. The 2nd quarter GDP number was very low as expected, reported at -32.9%. As a friendly reminder, the headline numbers is quoted on a annualized basis. The second quarter GDP change for the quarter alone was -9.49%. The reported annualized number assuming the next 3 quarters also has a same drop is (1 - .0949) ^ 4 - 1 = -32.9%. In case you are wondering why some European countries only saw about a 10% drop in their GDP... they report quarterly change. ... math.
It is still summer and I'm sticking with my "enjoy the sun and ice cream" theme. GO!
Posted by Kirk, a fee-only financial advisor who looks at your complete financial picture through the lens of a multi-disciplined, credentialed professional. www.pvwealthmgt.com