

7.65% of paycheck goes to Trust Funds. How are they doing?
Every year the Social Security and Medicare Trustees released a report updating the financial health of the Trust Funds. These programs provide a very important financial base for retirees. The primary source of funding is the payroll tax (FICA) of 7.65% (double if self-employed). Additional individual savings and pensions (if any) augment these social insurance benefits to make up one’s standard of living during retirement.
So how are these base social insurance programs doing financially? Not so well. Let’s take a deeper look.
I provided an in-depth financial overview of the Social Security and Medicare programs in a previous blog post including how they are financed and the financial status. I encourage you to review the previous post for a base understanding which is presented in a Q&A format with multiple graphs to illustrate the points. This blog post will provide updates based on the latest Annual Trustee Report released on June 5, 2018. This is an important topic since, according to the Trustee report, “Social Security and Medicare together accounted for 42 percent of Federal program expenditures in the fiscal year 2017” and are projected to “experience cost growth substantially in excess of GDP growth through the mid-2030s.”
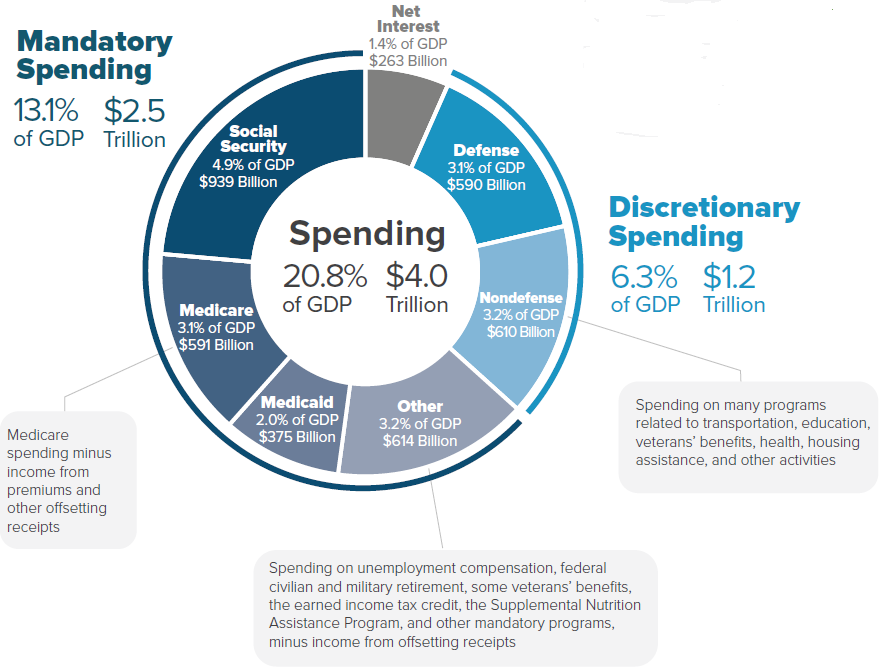
The first graphic (Source: CBO, March 2018) puts the 42% of the federal budget in context. Note there is a lot of discussion about discretionary spending yet very little on the 67% mandatory spending which includes Social Security and Medicare.
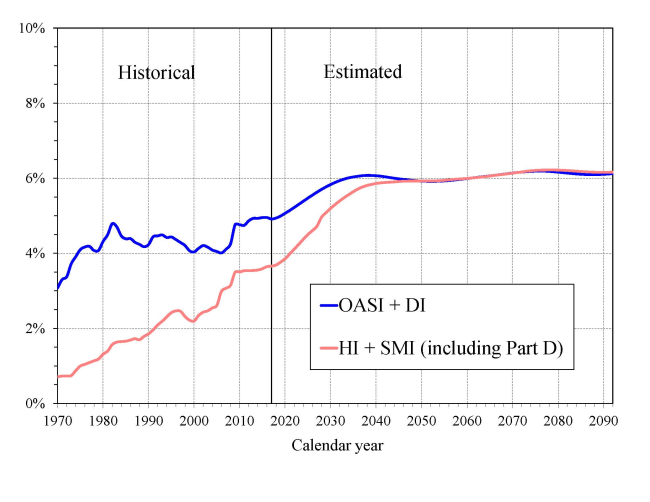
This graphic (Source: Summary of Trustee Report, 2018) captures programs' spending as a % of GDP, including the rapid projected growth of Medicare. After viewing, refer back to the graphic above and double the Medicare slice. What other pieces of the pie will this consume? Probably not the interest expense.
Social Security is made up of two trust funds:
- Old-Age and Survivors Insurance (OASI) Trust Fund – pays retirement and survivor benefits (including payments to the family if a covered parent dies at an early age)
- Disability Insurance (DI) Trust Fund – pays disability benefits
- Both are funded by 6.2% of the payroll tax (plus another 6.2% from employer)
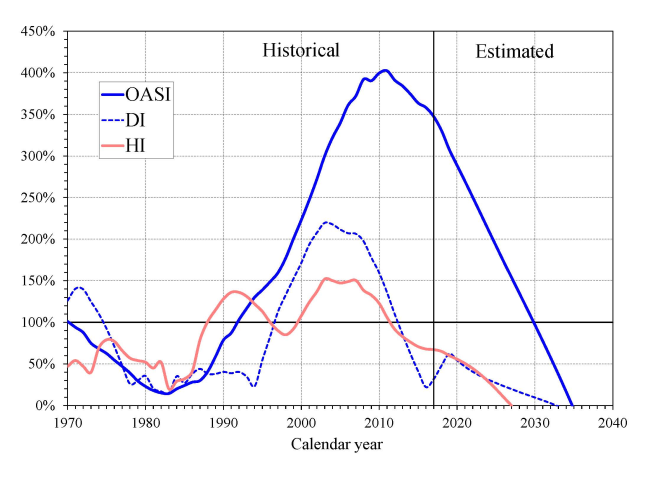
These funds are projected to be depleted in 2034 and 2032 respectively. This is one year sooner than last year’s projection for OASI but four years later for DI due to favorable trends in lower applications and existing recipients recovering from their disability. After 2034, only 75% of the costs can be covered based on projected revenue. This is also the first year since 1982 when the total payout of benefits will exceed the total income (payroll tax plus interest) as was expected from previous projections. This means the programs have to start spending the principal to cover benefits, which kicks off depletion of the reserves. The graph below (Source: Summary of Trustee Report, 2018) shows the assets of the trust fund as a percentage of annual benefit costs, including the years when the reserves are depleted to $0 and the benefits paid will only come from current revenue.
Medicare is also made up of two trust funds:
- Hospital Insurance (HI) Trust Fund – aka Medicare Part A - pays for hospital stays, limited home health AFTER hospital stays and hospice care
- Supplementary Medical Insurance (SMI) Trust Fund – aka Medicare Part B and D – pays for physicians, outpatient care and subsidized drug insurance
- HI is funded by 1.45% of the payroll tax (plus another 1.45% from employer) + extra 0.9% of income and 3.8% investment income for high-income taxpayers
- SMI is funded 75% from general tax revenue and 25% from Medicare premiums – NOT by the payroll tax
The HI Trust Fund is projected to be depleted in 2026 – three years earlier than projected last year – at which time it can cover 91% of the cost, decreasing to 78% in 2039 (see chart above). The SMI Trust Fund “will remain adequately financed into the indefinite future because current law provides financing from general revenues and beneficiary premiums each year to meet the next year’s expected costs.” This is a fancy way of saying the government will use general tax revenue to cover 75% of the costs as needed and adjust Medicare premiums accordingly to cover the other 25%. That’s right, Medicare premiums only cover 25% of full costs for Part B. Thank the general taxpayers for covering the other 75%.
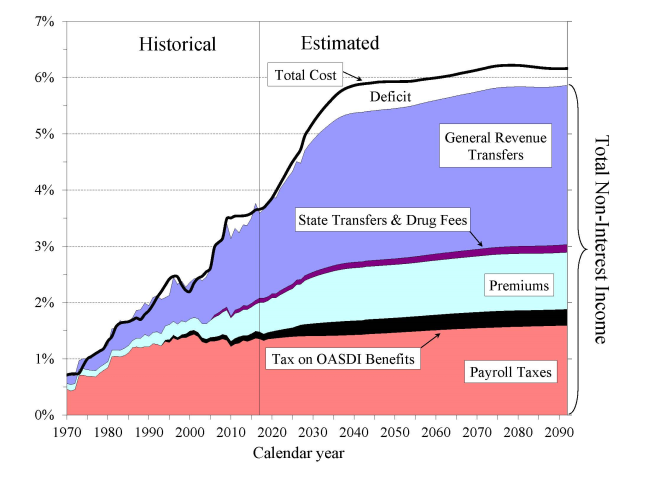
As a % of GDP, the total Medicare costs (both HI and SMI) were 3.7% of GDP in 2017 but projected to grow to 5.8% of GDP by 2038 and drifting slightly higher beyond. The graph below (Source: Summary of Trustee Report, 2018) shows the total Medicare cost line along with the different funding components previously mentioned. Note this is only for Medicare. The program even uses the tax revenue from a taxable portion of Social Security benefits (OASDI) to cover some of the Medicare costs. Peter, meet Paul.
The report concludes with a simple message that is extremely difficult to implement politically - until they are out of money.
“Lawmakers have many policy options that would reduce or eliminate the long-term financing shortfalls in Social Security and Medicare. Lawmakers should address these financial challenges as soon as possible. Taking action sooner rather than later will permit consideration of a broader range of solutions and provide more time to phase in changes so that the public has adequate time to prepare.”
I will conclude with the same sentence from my earlier blog post on this topic: It is important to be aware of the issue to not only help plan your retirement but also to engage in a thoughtful, well-informed debate about the best path forward for these important yet financially troubled programs.
Note: For the title purists, you are correct after $128,400 of income the payroll tax drops to 1.45% until it hits $200,000 for single / $250,000 for joint filers when it jumps to 2.35% of income. There is also an additional 3.8% of investment income for these same high earners.
Posted on 6/18/2018 by Kirk, a fee-only financial advisor who looks at your complete financial picture through the lens of a multi-disciplined, certified professional.