

Inflation Update
Inflation has been a key focus of the markets – both bonds and equity – since the large increase in inflation starting in March of 2021. The Federal Reserve raised short-term rates in response to focus on price stability. After a relative peak in inflation in mid-2022 (Core peaked in the fall) inflation has been steadily falling. Note this doesn’t mean prices are falling, just not rising as quickly as before; prices are still up and will remain so. As the inflation rate moves back to the Fed’s 2% target, the Federal Reserve Open Market Committee (FOMC) plans to reduce interest rates. But the last FOMC meeting on January 31st made it clear that more data is needed before the easing process can begin. This was reinforced by the slight uptick in the most recent CPI print on February 13th.
This blog post will provide graphs of different inflation gauges for context. The common index is the Consumer Price Index (CPI) but the Federal Reserve focuses on Personal Consumer Expenditure (PCE). I will show both, including the headline and core (excluding food and energy) along with the recent blip up in the most recent CPI data which impacted markets. We will also look at inflation for Goods and Services component as well as Wages to see the trends. We will conclude by viewing the market reaction to this data and expected Fed rate cuts, which also impact equity valuations. I last provided a dedicated inflation update in my August 2023 blog post.
While mostly negative, there can be a few silver linings from inflation to offset some of the impact:
- Savings accounts are now earning a noticeable interest rate
- Tax brackets and maximum IRS limits were adjusted up nicely for inflation
- Social Security benefits saw relatively large increases recently
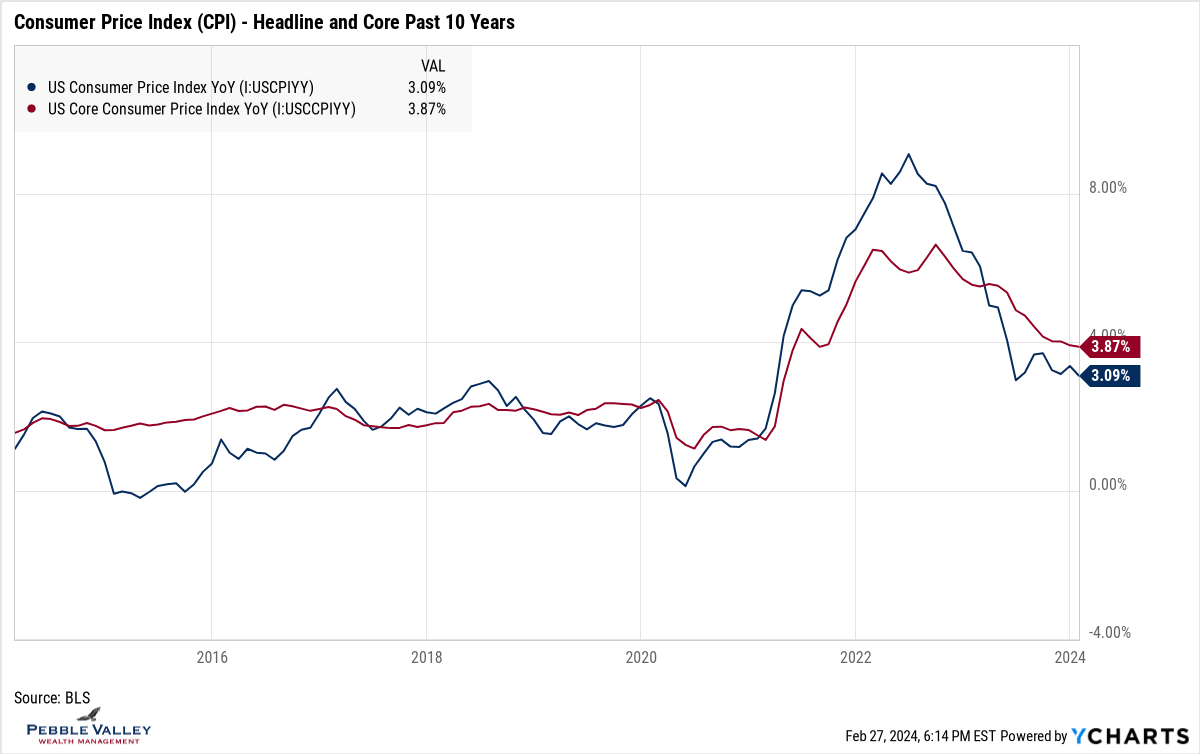
Consumer Price Index (CPI) - Headline and Core
The most common inflation gauge is the Consumer Price Index (CPI) published monthly. There is also a Core CPI which excludes the more volatile Food and Energy components and is used by economists as a more stable gauge to monitor trends. I show both these indicators in the graphs below. The first graph goes back to 1965 for context relative to the extreme inflation readings of the ’70s. Notice how inflation retreated in the early 70’s only to reverse course quite violently. The second graph shows the same indices over the past 10 years for more granularity. The headline inflation has dropped quite rapidly but has been relatively muted since.

Before the January 2024 CPI release, many market observers were noting that the last 3- or 6-month inflation on an annualized basis was dropping quickly and they expected this path to continue. However, the January CPI came in a bit hotter than expected which has raised concerns. The graph below shows the same inflation indices over the past 10 years, but on a month-over-month basis. You can see the recent blips up in the data. The markets will be watching for a similar trend in the PCE data (which we turn to next) this Thursday, Feb 29th. Hopefully the data won’t “leap” like the day!

Personal Consumer Expenditure Index (PCE) - Headline and Core
While most people recognize CPI as their inflation gauge, the Federal Reserve uses the Personal Consumer Expenditure (PCE) index. In general, CPI uses a narrower definition of urban expenditures made directly by consumers, while PCE considers expenditures made by urban and rural consumers as well as some business expenses. The PCE typically runs lower than CPI as shown by comparing the red line (PCE Core) vs. gray line (CPI Core) below. The Federal Reserve target is 2% for PCE. While Core CPI may have been running just above that over the past decade, Core PCE has stayed well below until recently. And while PCE inflation has also come down substantially, we will see if there is a blip up in the most recent data. We must also recognize “the last mile” back down to 2% will take more work than coming off the heated peak.

Goods vs. Services vs. Wages
Overall inflation can be broken out into various components. I show the Core Goods vs. Services breakout next to the overall Core PCE (thick black line) below. These trends were important the last few years due to disruptions in the supply chain and consumer demand shifting heavily to Goods (blue line) early in the pandemic, then later to Services (gray line) after restrictions were lifted. The first time I saw this graph I was surprised by how much lower Goods inflation was to Services inflation, driven mainly by globalization. Goods inflation has returned to the lowest reading among the list but the Services component remains quite high.
In addition to continued demand for experiences and less “stuff”, Wages plays a key driver in the Services component. I show that in the red line as captured by Business Compensation index. Recall the Federal Reserve has two mandates – price stability and full employment. The jobs market continues to run strong with a very low unemployment rate. The resulting higher wages is one driver keeping inflation elevated, resulting in the Fed holding rates higher in restrictive territory. We will turn to the Fed next.

Inflation Readings and Fed Reaction
Whether the Federal Reserve raises rates again and how long they will remain high depends heavily on how inflation plays out. This was reinforced by the Fed at their January 31st meeting when they stated more data is needed to confirm the inflation trend. This tone was more in line with previous Fed meetings excluding the December 2023 meeting which saw a very dovish Fed Chair Powell and has proved to be the outlier. After that December FOMC meeting, the markets began pricing in aggressive rate cuts by the Fed for 2024 – more than six 25bps cuts at one point starting as soon as the March 20th meeting. However, after the heat cooled into the new year along with Fed speeches - and then the blip up in CPI on February 13th - the market has backed off substantially in rate cut expectations.
The graph below from the CME Fedwatch tool on 2/27/2024 shows the changing market sentiment to potential rate cuts. The probabilities are based on the December 2024 meeting. The first red vertical line shows the market was expecting more than six rate cuts by the end of 2024 just before the FOMC meeting. After the second red line – the hotter CPI print – the market shifted closer to four cuts and now about a 65% chance there are only three rate cuts in 2024. This has caused longer-term interest rates to rise again after falling substantially late in 2023 (and causing bond and equity prices to rise!) About half of the rate drop has been retraced. And while the red-hot equity markets have cooled, they have not reacted as much to this higher rate environment. This bears watching. Now that earnings season is mostly over, attention will turn to inflation readings (PCE, CPI) and the jobs report. This will inform the next Fed meeting on March 20th which includes an update to the Summary of Economic Projections. Fun stuff.

2024 is off to a fast start. For those in the Chicago area, we got an early taste of spring in late February! And for those who feel the year is going too fast, you have an extra day in February this year to slow things down!
Posted by Kirk, a fee-only financial advisor who looks at your complete financial picture through the lens of a multi-disciplined, credentialed professional. www.pvwealthmgt.com