Who is FRED?
Have you ever heard an economic statistic on the news and wondered how that number has changed over time? Would you like to have graphs of key economic indicators sent to you automatically? Would you like to do your own research on the relationship between different economic and market indicators?
There is a tool for that called FRED. And it's free. It stands for Federal Reserve Economic Data and is created by the St. Louis Federal Reserve. See page 1 of my recent presentation to my local library for some of the cool things you can do with FRED. Here is a link to the FRED website to get started.
Many graphs I use on my website and blog will be from FRED. It's such a powerful tool I wanted to make you aware of its functionality.
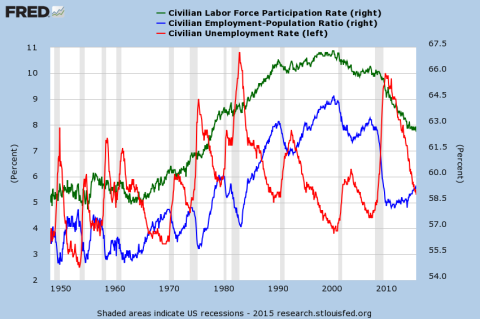
As an example, here is a graph showing the components of the unemployment rate so you can see the impact the falling participation rate has on the improving headline number you hear or read in the news. Unemployment Rate = 1 - (Employment Rate / Participation Rate). When creating graphs, you have control over the time period included.