

Social Security: Yes it will be there ... most of it
One of my research papers in college was on the funding of Social Security. One feature that surprised many of my fellow actuarial students was the pay-as-you-go funding. I continue to watch the funding status of the program using the annual OASDI Trustees Report to answer a common question from my clients – “will it be there for me?”. The Trustee Report contains many tables and graphs capturing the funding and different aspects of the program. Here are a few to note.
Note: Social Security is technically separated into two funds – the Old-Age and Survivors Insurance Fund (OASI) and Disability Insurance Fund (DI). Medicare is a separate program with its own Medicare Trustee Report and not discussed in detail here.
Will there be any money left to pay my social security benefits?
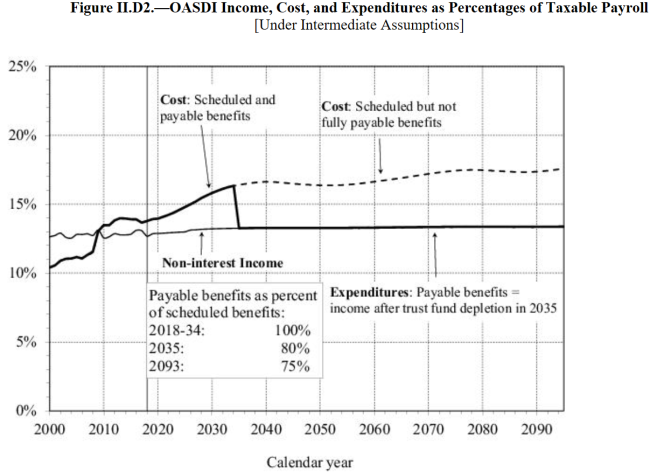
Yes, but very likely not 100% of what has been promised unless changes are made to the program. However, it will be far higher than those who say nothing will be paid. In fact, each year the report estimates when 100% of benefits will no longer be met and what action would need to be taken to make the program viable for the next 75 years. This year’s answer: in 2035 either a) scheduled benefits need to be reduced 23%; or b) payroll taxes increased an extra 3.65% of covered payroll; or c) some combination of the two. If action is taken now on future recipients only the benefit reduction would be about 20%. Here is a nice summary chart.
2035 isn’t that far away. Is the trend getting worse?
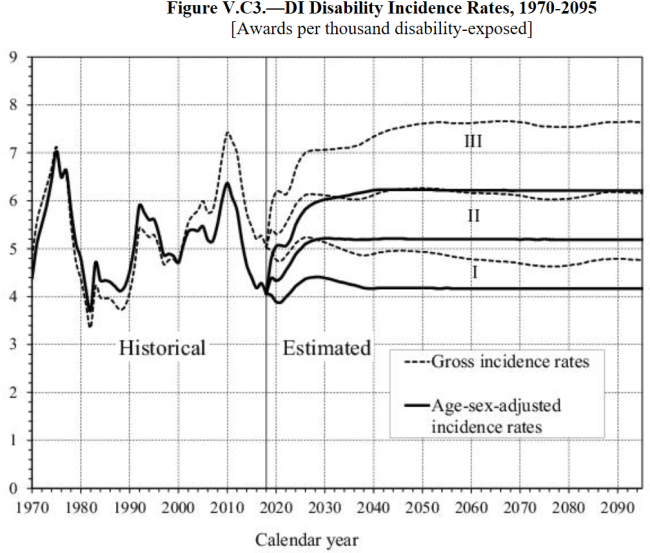
In general, yes. The latest report did project the benefit adjustment will be needed one year later. However, the improvement was driven by the recent drop in Disability Insurance claims which typically increase after a recession and then drop off as the economy improves and some with less severe disabilities find jobs. This can be seen on the left side of the graph below where the blips up correspond to recessions. The OASI program had the same 2034 projection last year but the DI program increased from 2032 all the way to 2052, partially driven by examining the DI claim approval process in higher approval % areas. The benefit reduction estimate last year was also 23% if action was delayed until 2034.
The last major changes were implemented in 1983 to shore up the finances. Using the Long-Range Depletion Dates table in the report (Table V1.B1. on page 165 for you gamers), the trend for the year of reckoning was as high as 2051 in 1986 after these changes, moving down to 2029 in 1997, jumping back up to 2042 in 2004, then reversing course again ending at 2035 this year.
What is the pay-as-you-go-funding concept?
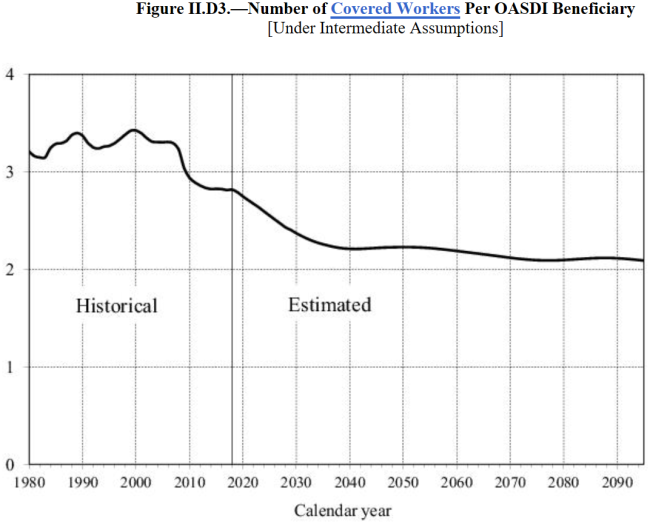
In a personal retirement plan, you put money aside now that grows with interest to pay future bills during retirement. The money saved is earmarked for later years and retirees draw on their savings to help pay the bills. This concept does not apply to Social Security. Instead current workers pay a payroll tax of 6.2% – called FICA – and their employers also contribute an additional 6.2% (the extra 1.45% from each is for Medicare; total combined FICA is 15.3%). This revenue is not invested for any individual but rather used to pay current retiree benefits. There may be years of surplus funds but the predominate funding of benefits going out is from payroll tax coming in. In 2018 over 91% of the income needed was from current year FICA taxes. A key driver is the number of workers paying taxes vs. the retirees collecting benefits. That number was above 5 in 1960 but is now at 2.8 and projected to fall further.
What is the average and maximum Social Security benefit? How much is paid out each year?
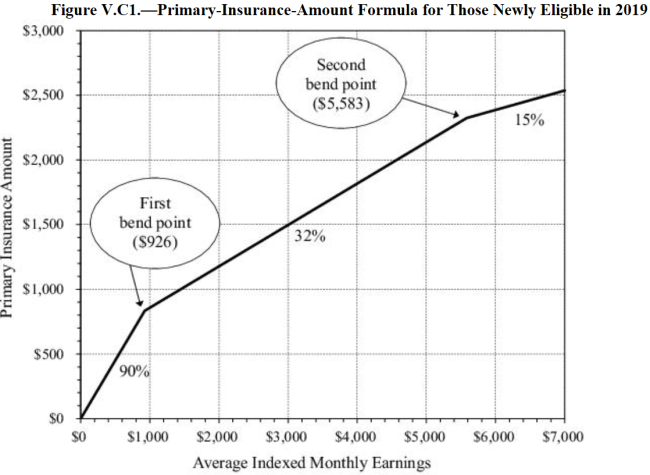
The monthly benefit is based on an individual’s earnings history. Earnings above a certain amount are not included – nor taxed ($132,900 in 2019). For 2019, the average Social Security benefit if claim at your "full retirement age" is $1,461/month or $17,532/year. The maximum benefit for someone whose earnings were at the top threshold of the best 35 years would receive $2,861/month or $34,332/year (that number jumps to $45,240 if wait to age 70!). Spouses receive up to 50% of the "full retirement age" benefit and step into 100% of actual benefit upon the first passing (subject to nuanced age when claim). Past earnings are adjusted to today's value based on historic wage growth to arrive at "average indexed monthly earnings". Then the initial benefit is calculated off this value but higher credit is given at lower wages through a concept called ‘bend points’. This gives lower earning beneficiaries higher benefits relative to taxes paid, with a weighting of 90% for low earnings but only 15% for high earnings (see graph below). The ‘marginal progressive scale’ is handled on the benefit side, not the tax side. Future benefits grow with consumer price inflation as described in my previous blog post and continue for life. The total outlay of benefits paid for the OASDI program (excluding Medicare) in 2018 was $1 trillion dollars. That’s a big number.
Cut benefits? Raise taxes? Both? Don’t forget the original intent of the program.
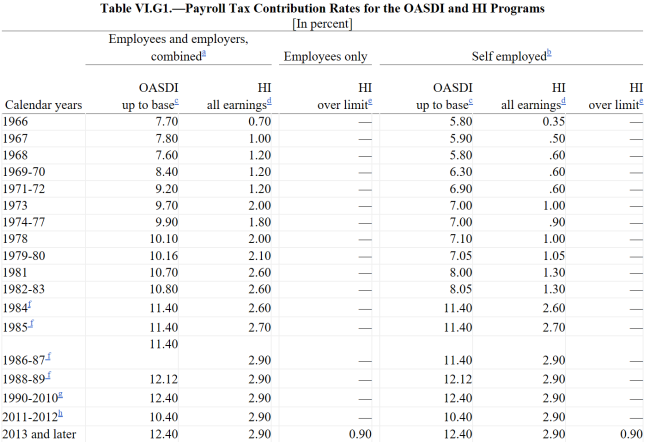
It is important to remember the original intent of the Social Security program was to establish a floor income to keep retirees out of poverty. It is not intended to fund the entire retirement. One must save on their own during the working years to supplement. During periods with excess workers and a surplus, politicians couldn’t help but to raise benefits. However, once someone has a benefit, they don’t want it reduced. The initial reaction is typically to raise taxes, starting with the wealthy by raising the income threshold applied to taxes. But be aware the program is already quite progressive in the way the benefits are calculated using bend points mentioned above. Also remember the combined payroll tax is already 12.4% (and an extra 2.9% for Medicare + extra 0.90% for high earners starting in 2013). That number has crept up over the years as the benefits expanded. It was as low as 6.15% combined for the self-employed just over 50 years ago (8.4% for corporate employees). That tax is now about double for top earners at 16.2% of payroll (this includes Medicare; see table below).
As an aside, when the Social Security program started all benefits were tax-free. Starting in 1983 a portion of benefits became taxable, but only for those with high incomes defined back in 1983 as $25,000 for single filers and $32,000 for joint filers. Those thresholds today - $25,000 and $32,000. That’s right, it is not adjusted for inflation. If adjusted for say a 4% wage growth, the values would be $102,600 and $131,300 respectively. In effect, what was originally a social safety net program with tax-free benefits is now a safety net plus cushion, with the related higher taxes – both payroll and now on benefits - to pay for the extra promises. Further note the new 0.90% Medicare tax for high earners applies if over $200k for single filer and $250k for joint. Some of you may not care since income is below those levels. But make sure your kids know... these thresholds also are NOT adjusted for inflation.
Social Security is a great program that needs to be adjusted so it remains financially viable over the long-term. Economic growth and the resulting higher payroll tax will help, but small tweaks to the benefits, not just higher taxes, can keep the original intent of the safety net in place for years to come.
Posted by Kirk, a fee-only financial advisor who looks at your complete financial picture through the lens of a multi-disciplined, credentialed professional. www.pvwealthmgt.com