

“Savings Generator”, not a Budget
An important component in financial planning is understanding how much a person saves and spends each year. Capturing this data for major categories - housing, medical, food, transportation, entertainment, taxes and others – can then be used to adjust which amounts are likely to increase, decrease or stay the same during retirement (along with inflation of course).
It sounds easy enough, but to many people that sounds like a budget, and that sounds awful. But it’s not… and remember, you have to measure to manage.
While the task may seem daunting, I first remind people to think of it as a “savings generator” rather than a budget. Then with the right mindset, find a tool and process that matches your style and level of detail. This doesn’t mean tracking every penny. It should be flexible enough to allow for life to unfold in the uneven way it does but also provide a framework to prioritize where money goes and recognize the tradeoffs.
I recommend breaking the process into two phases – initial set-up and ongoing monitoring. You may use an app (see later) to help inform estimated spending by category, but the initial phase likely needs to be done outside the app to establish an overall framework, break out paycheck details likely not available in the app, and account for money in = money saved + money out.
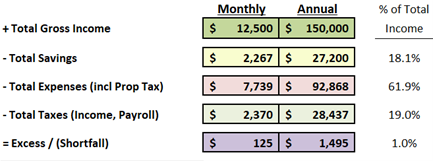
The first initial-phase step is to start with gross income, not your net paycheck, so you can capture items like 401k savings, health insurance premiums and taxes (including 7.65% payroll taxes). Then think of the major types of outflows – savings, expenses and taxes. If there is a shortfall, adjustments need to be made. This may involve tapping savings to pay for one-off items but if it happens regularly, other adjustments may be needed. If a loan is used for a purchase (like a car) the monthly loan payments should be included in the expenses. Here is an example of the major types.
The next initial-phase step is to set your “Savings” goal. Pay yourself first! The first number is likely found in your paycheck deductions to a 401k but also add non-401k savings. Be aware of non- vs. tax-deductible accounts (Traditional vs. Roth, Health Savings Accounts, 529s, brokerage/bank) which may help lower “Taxes”. That topic alone has a lot to cover but it won’t happen in this post – but be aware. Within “Taxes”, don’t forget your buddy FICA if still working and any State taxes. More reasons to start with gross income and look at deductions on your paystub. Yes it exists electronically if your paycheck is automatically deposited.
The final initial-phase step is to drill into “Expenses”. A common stumbling block is determining what categories to track and how detailed. I suggest starting high level and have a ‘Miscellaneous’ category. When the ‘Misc’ category becomes too large (over 2-5%) break out the next largest category. You may also have an important category you track even if relatively small. Some categories warrant their own subcategories, like FOOD-groceries and FOOD-dining out or HOUSING-mortgage/rent and HOUSING-furnishings. With the cost of mobile data and streaming, UTILITIES is another prime candidate for subcategories (how much is that mobile phone bill?!).
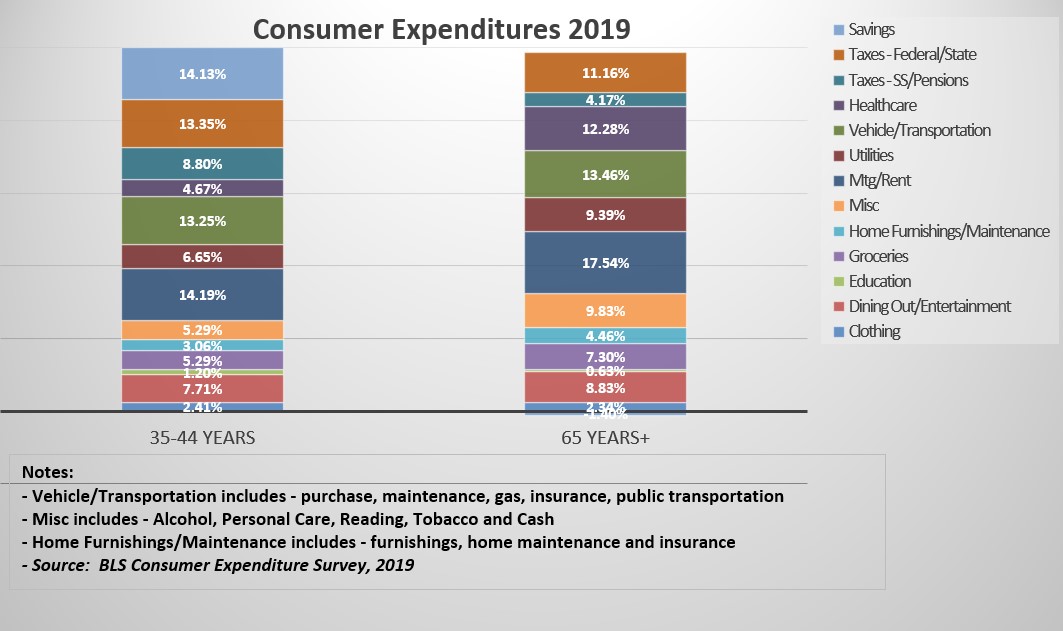
Once you have dollar amounts by category, a common technique is to express the dollars as a % of gross income and make sure that is where you want to prioritize your spending. The graph below shows the % of gross income spent by major categories for two different age groups. There is a table below showing these age bands and a two income brackets for further details. Your %’s – aka priorities – will be different and is a function of gross income, but this provides a reference point.
For the ongoing-phase, it is necessary to monitor actual spending relative to these category targets. Which tool is best? The one that works for you. How often? Don’t beat yourself up, but I suggest at least quarterly initially. Just do it.
I provide clients a tool as part of the PVWM Portal that automatically categorizes the spending after linking bank accounts and credit cards. Budgeting apps are also popular; find the one that fits your style. Here is an AAII article from last fall comparing nine different apps ranging from free to annual fees of $50-$120. Others may prefer Quicken, a spreadsheet or paper and pencil. A spreadsheet is very helpful establishing targets and summarizing output of these tools for a big picture review, but it’s best to have an automated tool do the heavy lifting.
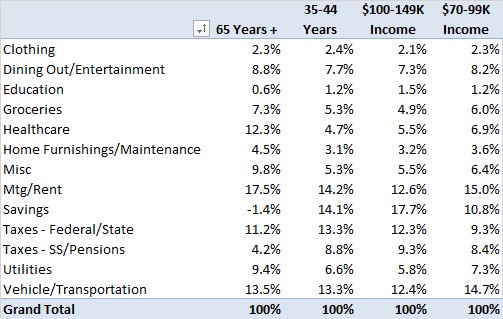
Below is the detailed table I mentioned including some income range breakouts along with a link to the full BLS report. Some %’s may appear high for those in higher income brackets since spreading a fixed cost over a higher gross income base. Others may seem incorrect for your circumstances. The main point is to create your own %’s by categories that work for you.
See… that wasn’t so bad. Happy saving!
Posted by Kirk, a fee-only financial advisor who looks at your complete financial picture through the lens of a multi-disciplined, credentialed professional. www.pvwealthmgt.com