

Monitor Illiquid Asset Values for Impact on Estate Planning
Estate planning is an important part of a financial plan. The term can mean different things depending on one’s perspective. Some may believe it is only needed by the wealthy to manage estate taxes, but in fact all people should have a plan for their estate. The level of complexity will vary by wealth and intentions. For some it is simply making sure a guardian is specified to care for their children; others may establish different trusts for seamless ongoing management, a complex distribution to heirs or to provide extra creditor protection.
Whatever the purpose or reason, it is important to review one’s plan in light of not only changing laws – federal exemption amounts have risen substantially and future tax plans may repeal completely – but also changing values within the estate, especially those less liquid assets whose price cannot be observed on a monthly statement or computer screen. One example is the price of real estate.
Today’s investor takes for granted the ease in finding a historic price chart on a given stock or index – whether on Bloomberg.com, WSJ.com Data Center, Yahoo! Finance or other. One graph that is not easy to find is a historic price chart on regional farmland, though you can find state averages in some regional Federal Reserve reports. Some states, however, provide information broken down by regions within the state and different land types – irrigated, dryland and pasture among others.
One state report I look at in detail is Nebraska. The data source is the Nebraska Farm Real Estate Market Highlights report. There is a summary at the beginning of the report but the real nuggets of data are found in the various tables within the report, showing averages for both land values and cash rent. For various reasons over the years I have followed these reports and created my own database of values from the area of Nebraska where I grew up - Pebble Valley - sound familiar:).
I have also added the price of corn and beef to the database but relied on the global price of each from the Federal Reserve Economic Database rather than local values (so the price scale will look different to some). There was a tremendous increase in the value of land as the amount of grain produced per acre increased along with demand from global trade and domestic ethanol. The rapid rise in land values had a pattern similar to housing prices during the early 2000’s when economic conditions were favorable and demand was high.
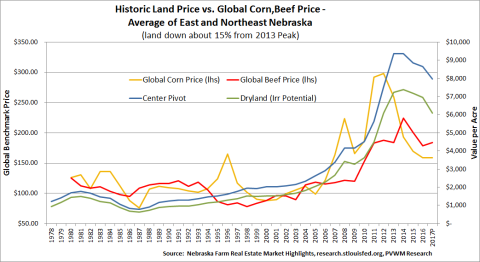
Land values have decreased recently on the back of lower grain values. From the 2013 peak, values are down around 15% for this region in Nebraska based on the preliminary release for 2017. Here is the link for the preliminary 2017 report. The full report is due to be released in June. Here is the link to the historic reports.
For some this graph might capture more than just passive interest. It can impact their estate planning, not only the amount of estate taxes due but also the source of liquid funds to pay both estate taxes and to distribute the estate to multiple heirs while keeping the tracts of land together for operations. For those who are directly impacted, I encourage you to look at your state’s report and note the long-term trends for context and implementation of your estate plan.