

It's Working: Context for COVID-19 Data
Before I jump into background, numbers and projections, I want to acknowledge the pain, suffering and for some, death, of those infected. To all the medical professionals treating them, helping them recover and being with those in the end – thank you.
I have been following the COVID-19 pandemic developments and Task Force press briefings closely. Timely, informative data is also available from Johns Hopkins site for latest cases and IHME for the latest projections which is important (sources listed at end). Not yet widely available are hospitalizations with recovery or the true number of people infected with no symptoms. This post will summarize the projected deaths data, normalize it on a per 100,000 population basis, and show the differences between select countries and states. For context, I also show the US numbers relative to the flu. To be clear, COVID-19 appears to be much more contagious, vicious if contracted for some, and no vaccines versus the flu, but I believe it is important to keep the magnitude of deaths in proper context and how society has reacted in the recent past to large flu outbreaks.
Early on, the focus of COVID-19 was the number of cases reported, resulting deaths and to which countries it was spreading. As the pandemic went global, focus shifted to the potential number of those infected, the strain on medical resources (beds, ICU beds, ventilators, equipment, people) and resulting projected deaths. Given the early projections, lack of therapeutics and the speed of the disease from contraction to death, focus was put on slowing the spread between people to reduce the number of people hitting the hospitals at once - “flatten the curve”. The only way to do that near-term was social distancing. In the intermediate-term (weeks or months), therapeutics and better testing – including antibody tests - will allow the beginning of return to normal. Long-term, a vaccine will be created (year or longer).
I am impressed by many things that give me confidence in addressing the pandemic:
- Government and private industry resources being directed at this problem
- Wisdom, expertise and data-driven focus of Dr. Birx and Dr. Fauci to help inform where resources are needed and near-term benefit of social distancing while work is done toward a broader solution
- Use of military precision and discipline in implementation logistics and ability to distribute resources where needed; overall the needs have been met, even when demands (based on high-range projections) may not have been met
- Speed of private industry and government in adapting manufacturing, trial testing and regulations to speed the time toward solutions
- COVID-19 testing (to see if HAVE it) continues to grow in more efficient manner without requiring full-on protective gear and days for results; as of 4/9 over 2,000,000 tests have been done and now over 115,000 tests daily
- Antibody testing (to see if HAD it) have NOT been done but are expected to begin soon
- 19 therapeutic trials are being conducted; many great minds and resources are searching and they will find a solution
- 2 vaccine trials are under way and more being considered; to help minimize the time for mass distribution, government and private industry and foundations will begin unique manufacturing of the most promising candidates now to get a jump start and turn off the ‘losers’ as trial results develop.
Now that we are in this crucial month for the US, I want to summarize the different data points available and how I interpret (sources listed at the end of post). I believe this is important as the discussion begins to consider the framework to begin re-opening our country - very likely not the same everywhere, but an opening. With expanded testing in place (including antibody) and on the downward slope of the curve, the strategy can shift from social distancing to testing, tracking those infected (contact-tracing) and isolation of those as necessary. For the data I summarize below it is important to note the following:
- Total number of those infected is not known due to continued evolving of testing; I express all numbers on “per 100,000 population” for solid frame of reference
- Full cycle = {infected > symptoms > testing positive/negative > home/hospitalized > recovery/death}
- Time from testing positive to death can be 2-3 weeks so important to recognize deaths can be peaking while hospitalizations are dropping (appears to be happening in New York now)
- Countries and states begin the cycle at different times and speeds (function of social distancing) so important to know where in cycle and how far from peak deaths when comparing data
- Early on only the number infected and deaths were reported; recently projections of deaths based on models were publicly released and are very informative
- Models are informed by actual data periodically which captures the trend – currently positive!
- In comparing across countries and states, very important to use the projected deaths since some may still be going through cycle
- I recognize demographics of a country or state can impact results; that is not accounted for here
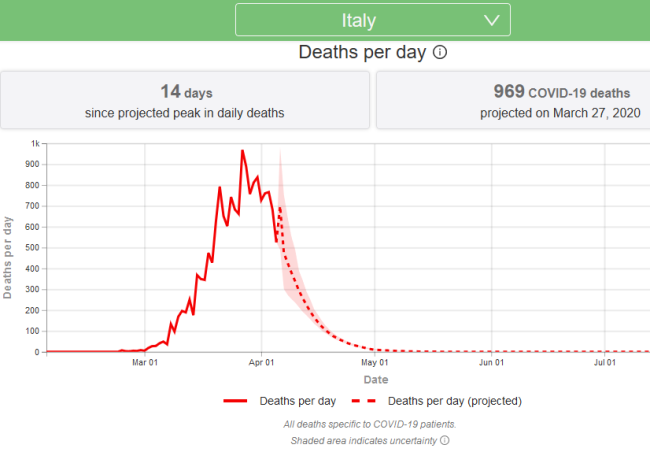
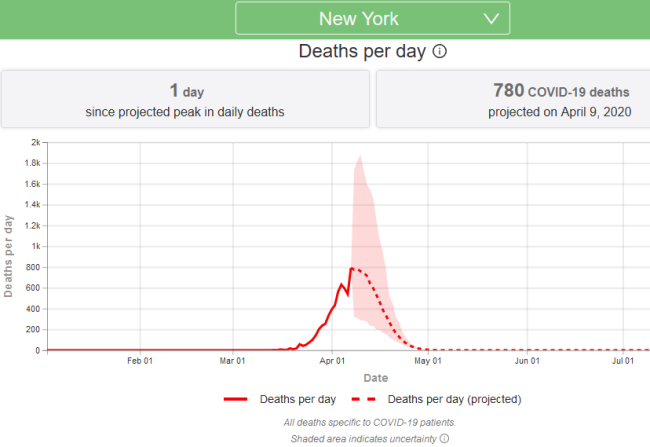
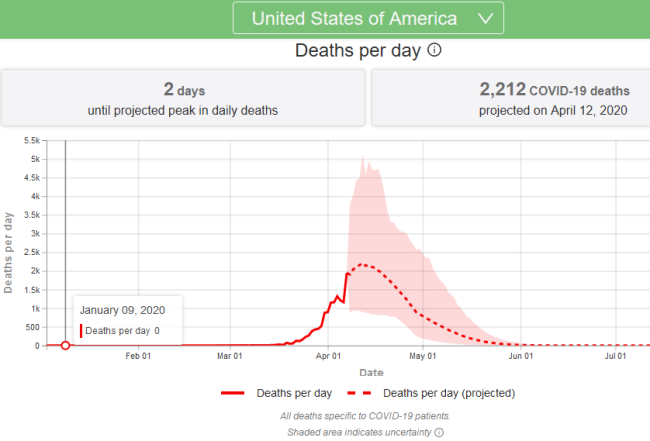
For a visual of the “peak” and “getting to the downward slope of the hill” here are the projected daily deaths for Italy (past peak), New York state (at peak) and US in total (approaching peak). The projected total deaths are a sum of these daily totals in the graph - an integral for you math minds. Following that are a few observations.
Observation #1 – Estimated US deaths continue to fall; projections show about 1.5x greater than flu
- Initial estimate of US deaths IF NO ACTION taken was 2,200,000 people – yes, just in US
- Due to social distancing, initial revised estimate range of 100,000 – 240,000 deaths
- Latest estimate on April 8 was about 60,000, with range of 31,000 – 127,000
- For context, I also show the US Flu death this past season based on CDC data; current projections show COVID-19 about 1.5x greater deaths than flu; yes I know COVID-19 is more vicious and aided by extreme social distancing, but important to consider as a society and how we have dealt with the flu in recent past

Observation #2 – Compared to other countries, US deaths per 100,000 is projected to be lower
- NOT ALL COUNTRIES SHOWN; I selected major countries with large cases and reliable data
- Italy was getting a lot of press on the severity; Spain is slightly worse and UK is projected to be almost 3x greater (but data may evolve)

Observation #3 – Within the US, some states are hit much harder than others
- NOT ALL STATES SHOWN; I selected states with large cases, large states with very low rates, states on the “watch list”, and a state that produces amazing beef
- NY and NJ are very high; main focus on news recently; tight living region
- Early on Washington state caught our attention but is projected to be quite low; California also remains on the very low end
- Some states like Illinois (specifically Chicago) are currently projected to be lower than average but trends are monitored closely; other states closely watched are Michigan (Detroit), Louisiana (New Orleans) and Pennsylvania (Philadelphia)
- Some state like Nebraska have current low number of cases but are projected to peak later; on per 100,000 basis they are higher than I expected

Observation #4 – over 75% of those tested – and currently only testing those with symptoms – are negative
- Over 2,000,000 COVID-19 tests have been done to date, but only on those with symptoms
- % testing positive varies by age (Dr. Birx; Task Force briefing 4/9)
- 11% positive for ages <25; 17% ages 25-45; 21% 45-65; 22% 65-85; 24% > 85
- In a reinforcement of men less likely to see a doctor, but when they do something must be wrong
- 56% of tests on females with 14% positive; 44% on males with 23% positive
- 56% of tests on females with 14% positive; 44% on males with 23% positive
- Again these are tests to see if HAVE COVID-19; antibody tests to see if HAD not done yet but coming soon
If want to see numbers instead of pictures, here is the table of data which feeds the graphs above plus more. I highlighted in red the “Expected Peak Death Date” that is past or upon us. I also highlighted the expected date when 90% of the projected deaths will have occurred. There will be deaths beyond these dates for sure, but this is very important to realize how quickly “down the curve” we may get and the ability to shift to the next phase of strategy on resuming some activity. Also note for the FLU I show number of medical visits as closest comparison to confirmed cases since currently only those with COVID-19 symptoms are tested. It is also true the number of COVID-19 cases will continue to grow as testing expands. Again, this is why my comparison metric was on projected deaths per 100,000 population for now. Further metrics and summaries are needed after robust data becomes available.

Finally, just a few quick comments on the economic data – specifically those related to jobs (weekly unemployment claims and monthly payroll report) and economic growth (GDP).
- The COVID-19 data is more important near-term than economic data
- Unlike past recessions, this was an immediate forced shutdown of many areas of the economy, not a slow bleed of uncertainty and slowing of activity
- The stats will create shocking headlines but think about what happened; would you be shocked by “Student Attendance Drops 100%; Schools Forced to Close and Teachers Stay Home”?
- GDP estimates are quoted on an annual basis; 2nd quarter GDP estimates of say -40% means they expect GDP to fall 10% in 2nd quarter due to shutdown but that is quoted as -40%
- Be sure to read the estimated GDP forecast for 2nd half of the year from the same forecaster
- Because government recommended the closing of many areas for the greater good of society and public health, there are very large fiscal policies being implemented to assist like the recent CARES Act (increased unemployment benefits, $1200 direct payment, etc.)
- The Federal Reserve is also implementing extremely large monetary polices with Treasury to provide a financial bridge and support a robust recovery. The latest action was this past Thursday morning with an expansion of debt support
- It is important to have a view of what the economy looks like on the other side - how soon it begins, how long it takes to ramp up, what % of previous run rate we hit; one must also recognize the amount of fiscal and monetary aid being infused until we get there, which again is quite different than past recessions.
Be safe. And Happy Easter.
Sources:
Johns Hopkins - https://coronavirus.jhu.edu/map.html
IMHE - https://covid19.healthdata.org/united-states-of-america
Worldometer - https://www.worldometers.info/population/
CDC - https://www.cdc.gov/flu/about/burden/preliminary-in-season-estimates.htm
Daily COVID-19 Task Force Briefings – covered on some channels; usually around 4-5pm CDT
Posted by Kirk, a fee-only financial advisor who looks at your complete financial picture through the lens of a multi-disciplined, credentialed professional. www.pvwealthmgt.com