

Inflation - Putting Recent High Print in Context
You have likely heard about various inflationary pressures recently - increase in Social Security benefits, high 6.2% CPI print, ship backlog at ports in LA or the extra cash needed at the gas pump and grocery store. The volume on these stories is quite high but here are some graphs and explanations for context. The graph history will be over longer time periods for this post. As for the $64k question - will it be transitory? The FED still says yes though acknowledged supply chain bottlenecks will be with us into the first half of 2022. I don’t believe it will be transitory, but I also don’t think we will continue to print 6+% CPI changes either.
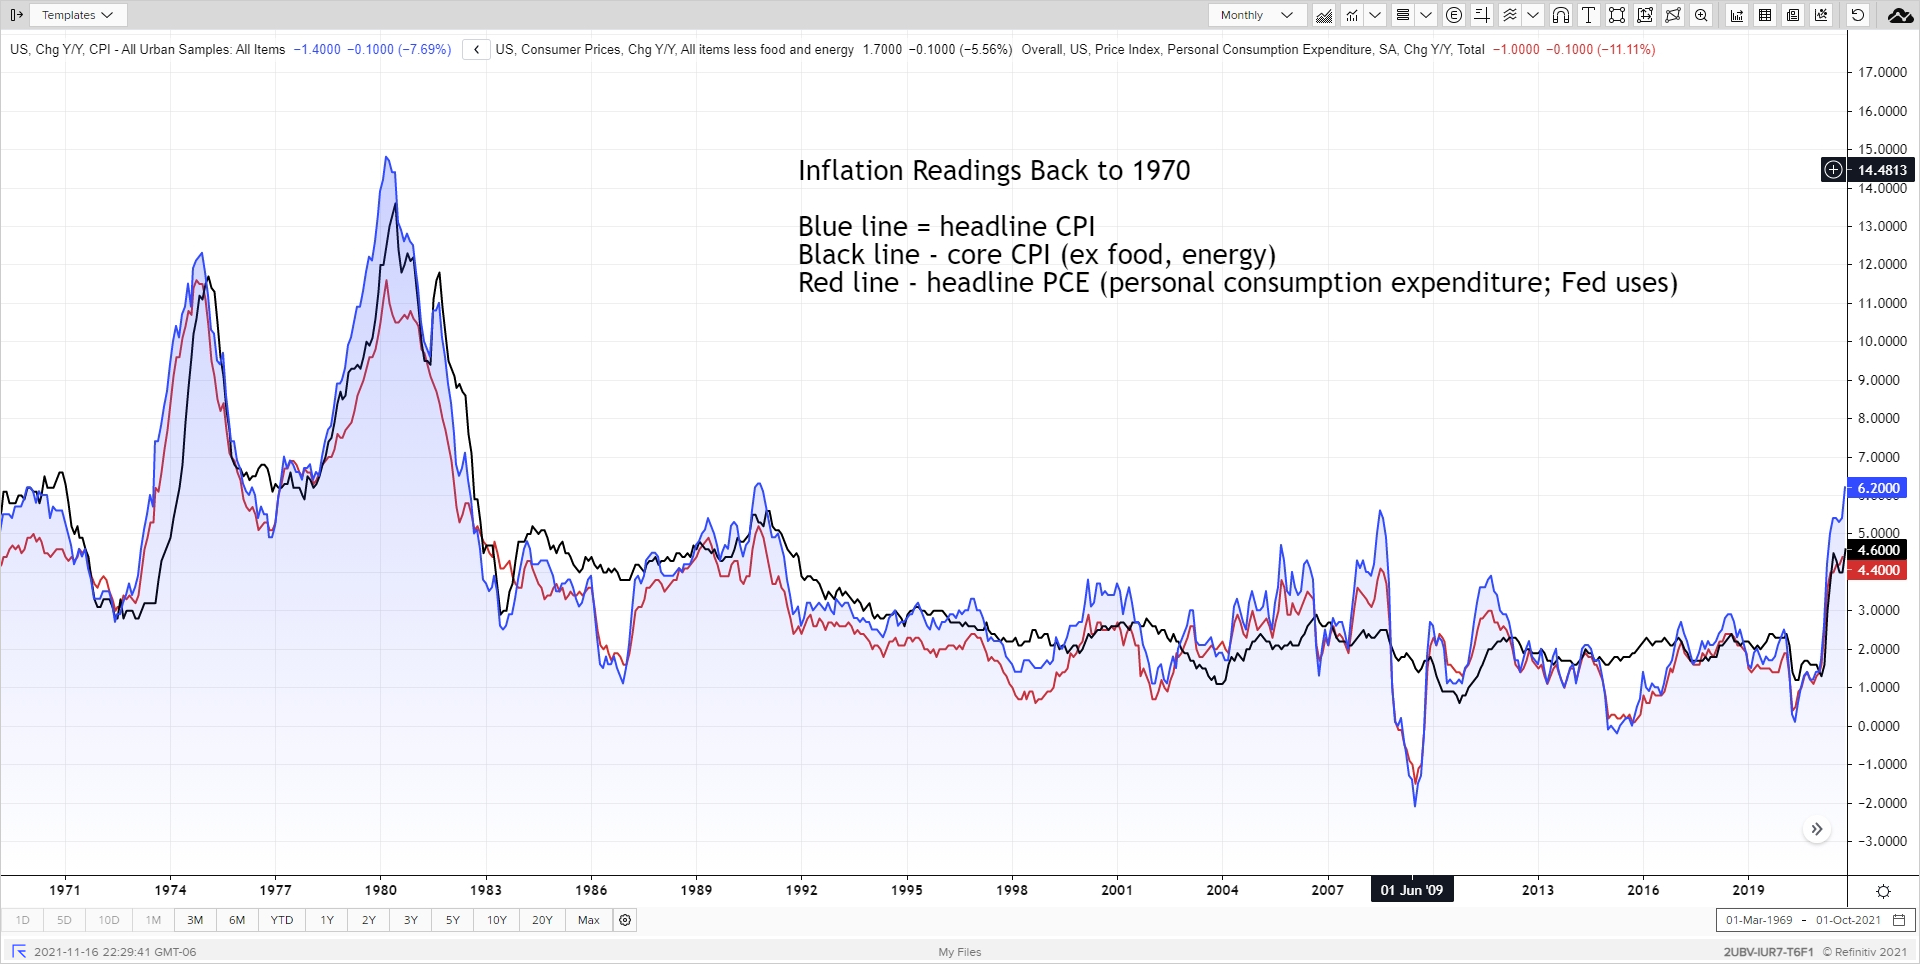
So how high is 6.2% historically?
Pretty high. The graph below shows Consumer Price Inflation (CPI) for both headline and core along with the Fed’s preferred Personal Consumer Expenditure (PCE) index. You have to go back to 1990 to find headline CPI prints higher. Prior to that is the high inflation of the late ‘70s and early ‘80s, which I do not think we are heading toward.
Are all items increasing the same?
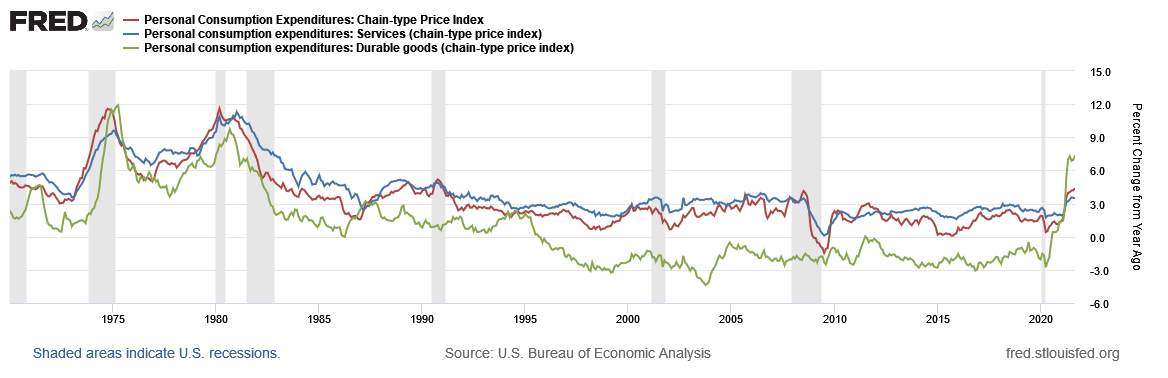
No. There are many CPI categories you can drill into to see which items are driving the headline CPI. Check out this cool interactive chart from BLS. Bringing it up to a higher level beyond headline and core, here is a graph breaking out services and durable goods for PCE. The services component is running higher, but the durable goods which historically ran well below services has popped recently. Perhaps this is the supply chain referenced by the Fed. Shipping container rates have skyrocketed this past year, though have eased over 10% in October. The pickup in international air travel again with capacity in the planes’ cargo hold is another release valve for these bottlenecks.
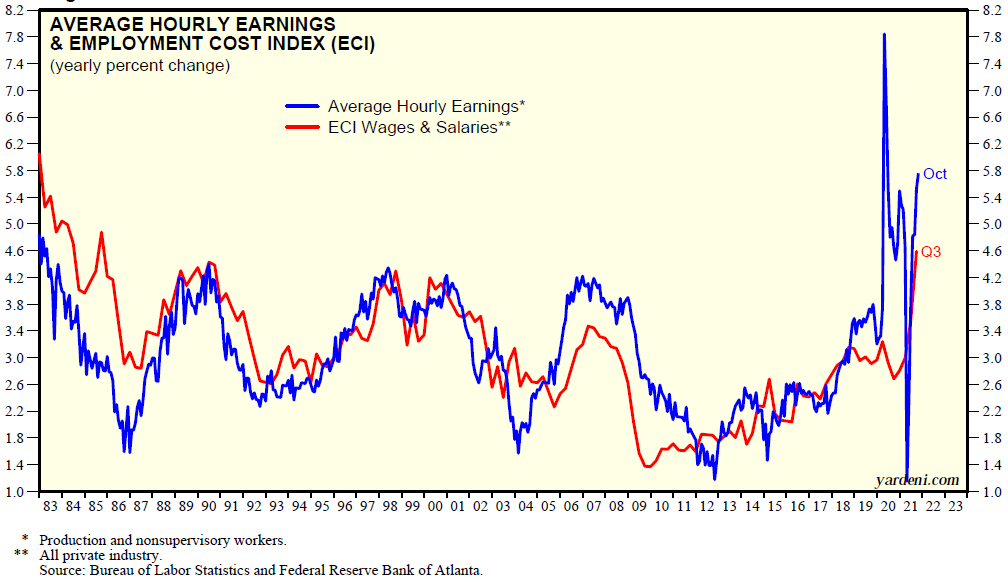
Another component of inflation that has remained relatively subdued but is also starting to warm up is wages. The graph below from Yardeni Research shows both average hourly earning and the employment cost index (ECI) back to 1982. The former index can be a bit more volatile but the ECI hasn’t seen this level since the mid-80s, although still below 5%.
Are interest rates rising because of higher inflation?
You would think so. But not now. Let’s look at long, short, and real rates.
Long rates
Normally longer-term nominal treasury yields compensate an investor for a real cash yield plus expected inflation plus a risk premium. If expected inflation is going up then usually the cash real yield remains positive and nominal rates increase to reflect higher compensation for inflation. The 10-year treasury rate is normally above (and often well above) inflation. 10-year rates began drifting higher early in 2021 as inflation concerns percolated but paused mid-year. One strong force keeping nominal yields down is the low global rate environment and demand for yield.
Short rates
Shorter-term rates are mostly driven by Fed rate move expectations. The Fed has (and continues) to state that inflation is transitory and they plan to finish its buying of bonds (tapering) by mid-2022. Only after that would they consider the process of raising Fed Funds rates. But starting in September, with continued trends higher in inflation, the market began to price in a Fed moving sooner than stated and the short-term rates moved higher, more than long rates. The movement of these rates are the markets pricing in expected Fed action in response to inflation while the long end held back by a combination of global demands and lower long-term inflation expectations.
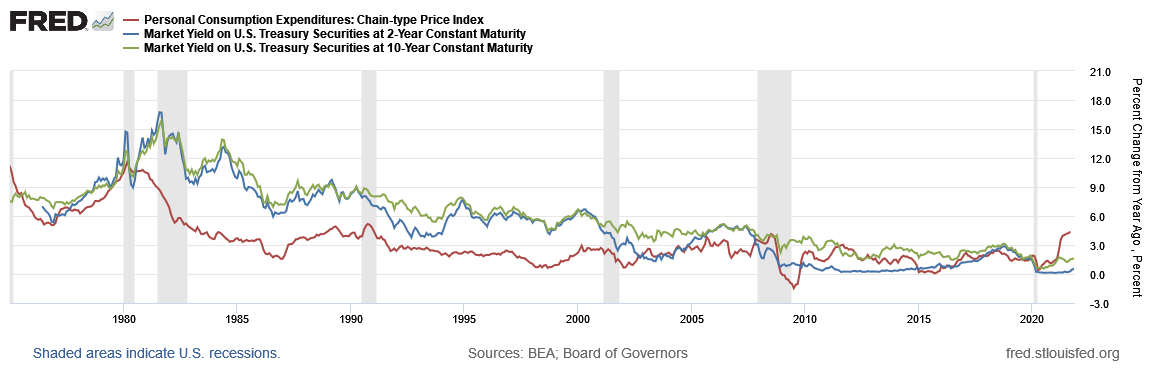
Before looking at real yields, lets throw in a graph of the PCE inflation gauge along with 2- and 10-year treasury rates since 1975.
Real Yields
So what happens if higher inflation is expected and nominal yields are lower than expected inflation? Real yields not only go down but they go negative – really negative. And what happens to equity valuation with really low, even really negative real rates? They go up. A lot. Especially for longer-running growth stocks.
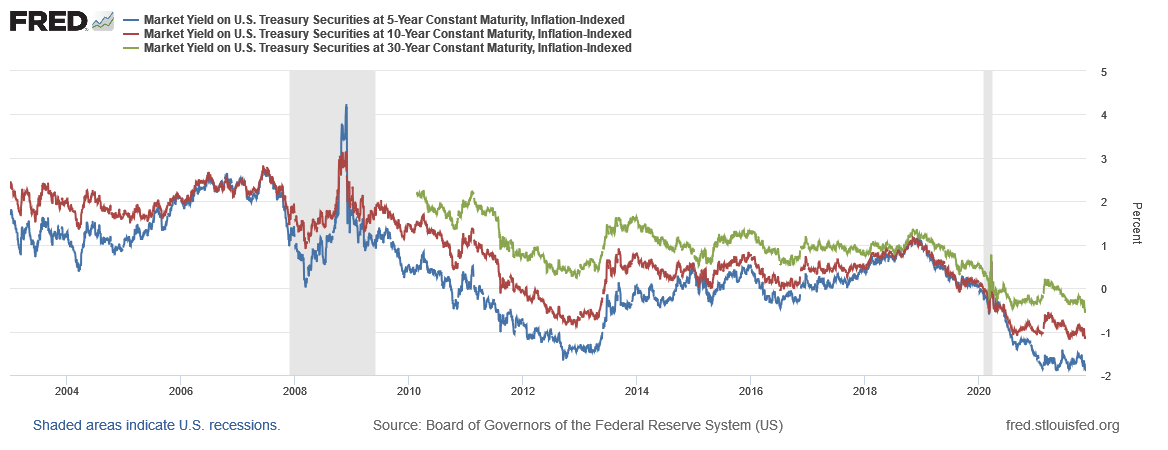
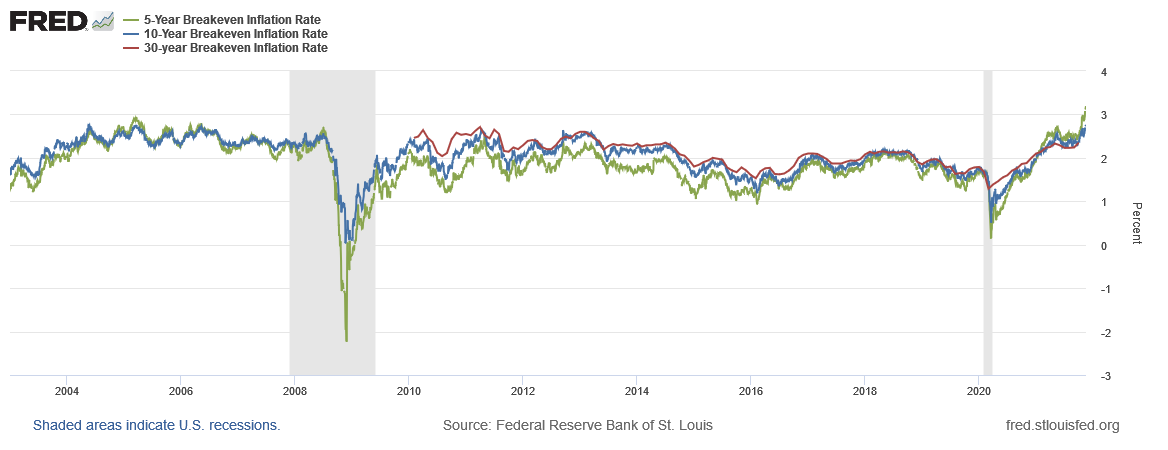
The next two graphs show real yields for 5- 10- and 30-year bonds. I thought I saw the lows in late 2020 and the slow rise in early 2021 was making sense. Then it reversed and real yields are now at all time-lows. The difference between nominal and real yields for the same maturity is called the break-even rate. I don’t use this rate as a predictor of inflation but rather as a balance scale. If you think actual inflation will be higher than break-evens, buy Treasury Inflation Protected Securities (TIPS); if you think will be lower, buy nominal treasuries (or other credit bonds if comfortable with credit risk). Back when the Fed told us they would let inflation run hotter than 2% and break-evens were in the low 2% range, that was interesting. Now that break-evens are above 3%, still interesting but less so.
“So what does it mean Jimmy?” One answer is found at the end of “The Commitments” movie. For me, the real yields holding down at such low levels is throwing off normal market reactions I would have expected in a higher inflationary environment. Maybe it is transitory (I don’t think so) but many other factors including global rates and COVID shutdown supply side disruptions are additional factors to consider with the higher inflation story.
… back when I was a kid, that only cost me…
Posted by Kirk, a fee-only financial advisor who looks at your complete financial picture through the lens of a multi-disciplined, credentialed professional. www.pvwealthmgt.com