How Does PE Ratio Impact Expected Returns?
Most equity investors have heard of the PE ratio, or price-to-earnings ratio. It is the multiple investors are willing to pay for the future stream of company earnings. Recall a share of a company stock gives you the right to earnings generated by the company. If a company is expected to earn $1 of earnings per share over the next year and a share of stock trades at $15 per share, the PE ratio is 15. This is technically called the forward PE ratio since based on expected earnings; the ratio based on past 12 months earnings is referred to as simply the PE ratio or trailing PE ratio (sometimes TTM PE ratio for ‘trailing twelve months’).
If a company’s earnings are expected to grow rapidly, an investor would be willing to pay a higher multiple relative to a slower growing company. Another measure to adjust for this growth of earnings difference is the price/earnings-to-growth ratio or PEG Ratio. A fast-growing company may have a higher forward PE ratio than a slow-growth company, but after adjusting for expected growth, it may have a better valuation (i.e. cheaper) based on the PEG ratio. For example, if two stocks both trade at a 15 PE ratio but one has a growth rate 15% and the other at 25%, the PEG ratios are 1.0 and 0.6 respectively. The projected earnings growth is typically one or three years; just be sure it is consistent across PEG ratios comparing. A general rule is a stock with a PEG ratio below 1 is on cheap side while above 1 can be more expensive. PEG ratios can be especially useful within a sector.
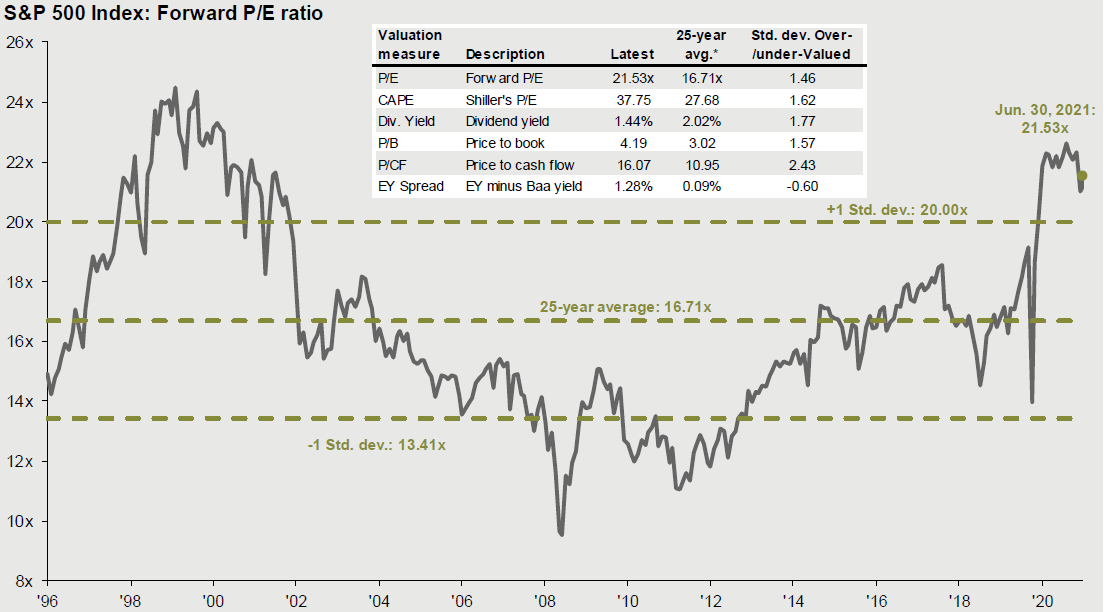
Rolling up individual stock’s forward PE ratios at the asset class level can be instructive to see how the overall market is priced relative to expected earnings and how that ratio compares historically. When the forward PE ratio increases over time it is called multiple expansion; a decreasing ratio is multiple contraction. During periods of multiple expansion, investors are willing to pay a higher price for a given level of earnings leading to higher than expected stock returns. Here is the forward PE ratio for the S&P500 over the past 25 years from the most recent JPM Guide to Markets.
NOTE: Let me mention that PE ratios are not good market timing indicators as stretched ratios can continue to stay elevated or even go higher near-term. However, from a longer-term perspective they are instructive to see where at in the historic range.
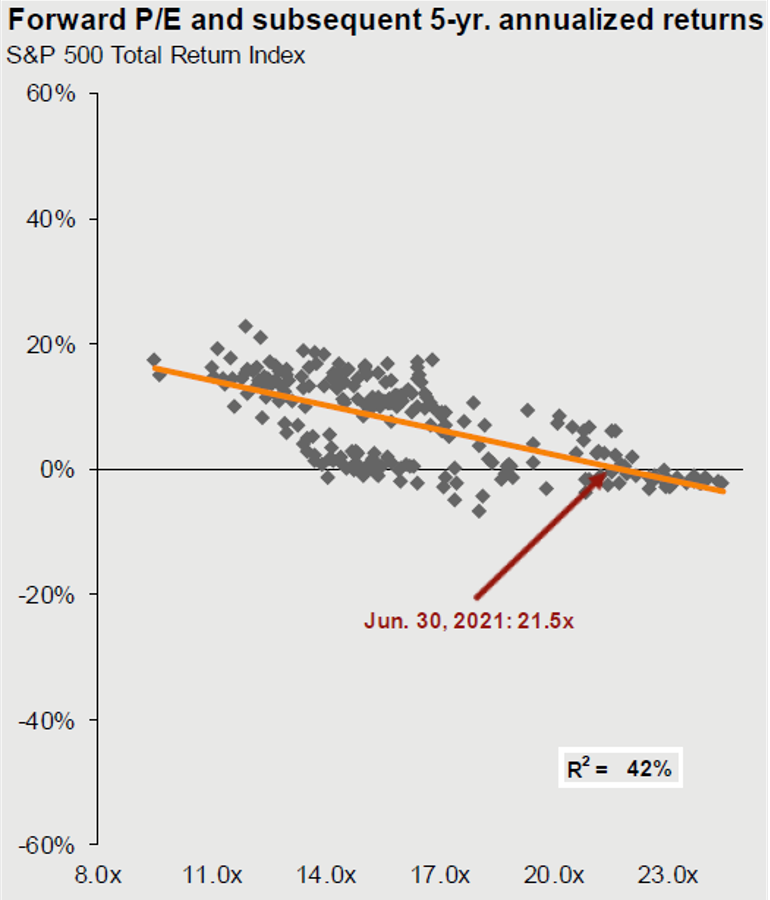
Now what happens to subsequent stock returns if PE ratios reverse course and experience multiple contraction back to longer term levels? The market returns will likely be lower even if earnings come in as expected. How much lower is hard to pinpoint, but the graphic below for US equities from the most recent JPM Guide to Markets indicates it could be much lower than if entering the market when PE ratios were much lower. Keep this in mind when investing and setting market return expectations.
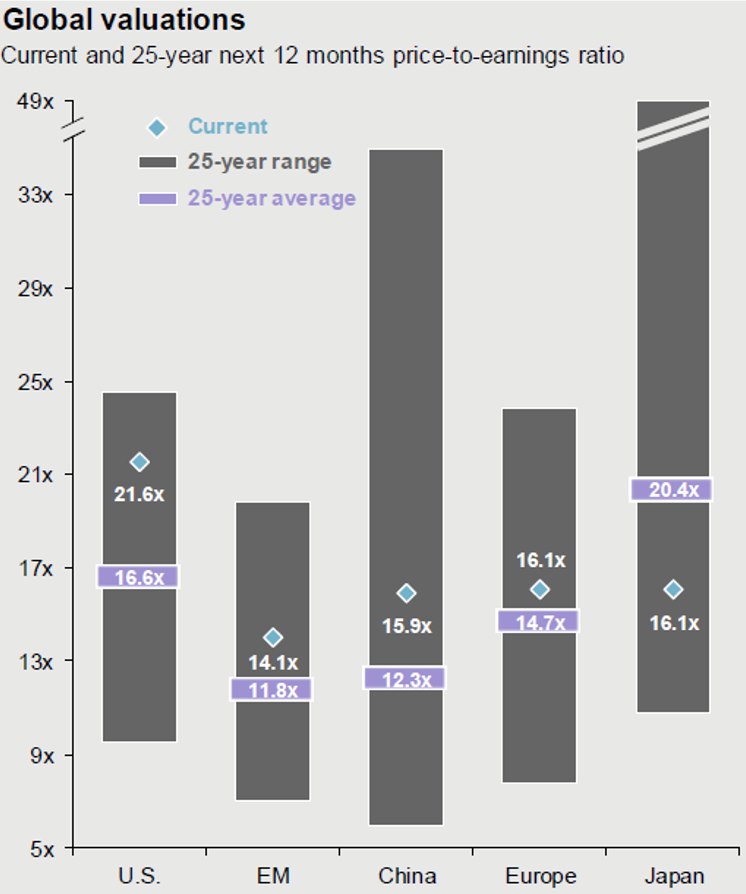
Another interesting comparison is how PE ratios differ across various equity markets. Keep in mind that not all regions will have the same long-term average PE ratio, but it is instructive to see how a region’s current PE ratio compares to that region’s long-term average. The graph below from the JPM Guide to Markets shows the US equity market forward PE ratio is quite a bit higher than the long-term average while different international equity regions are closer to or even below long-term averages. This is what analysts are referring to when they might say “international equities are cheap relative to the US.”
Most everyone wants good value. Looking at forward PE ratios relative to long-term averages and how that compares across different asset classes one invests in may help guide toward better value over the long-term, or at least help set future expectations.
Keep enjoying the summer and ice cream – perhaps with Marshmallow Fluff!
Posted by Kirk, a fee-only financial advisor who looks at your complete financial picture through the lens of a multi-disciplined, credentialed professional. Intersted in learning more about our services? Schedule a call with us by clicking here.


