

Fed's Dot Plot vs. Market Data (Really Cool Graph!)
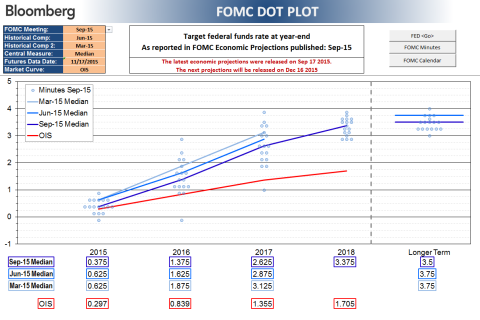
The Federal Open Market Committee (FOMC) meets eight times a year to discuss and decide on monetary policy. At the conclusion of each meeting a statement is released which is followed closely for any subtle word changes describing the economic outlook. As an added bonus, the committee releases economic forecasts on real GDP, unemployment and inflation at four meetings near each quarter-end. They also release a graphic summarizing the estimate of the Fed Funds rate (short-term rate) at year-end of the next few years. This graphic is called the "Dot Plot".
Markets price in expectations of future events. One may think rates are rising but you must ask "is the market pricing it in?" before determining the best investment based on your view. The very cool graphic below (Source: Bloomberg.com) captures how the Fed's view of future rate increases has changed over the last three "dot plots" compared to the current market expectations. The market is not expecting anywhere near the rate increases as the FOMC particpants. A couple drivers keeping market expectations down are relatively low global rates and low inflation.
So yes, many market participants expect a rate hike in December, but they also expect a much slower rate trajectory. If the Fed indicates a more firm rate trajectory in its communication or wage inflation establishes a trend higher, the rate (and other) markets have a lot of wood to chop.
Source: Bloomberg.com