

Asset Class Returns - 4/30/2023
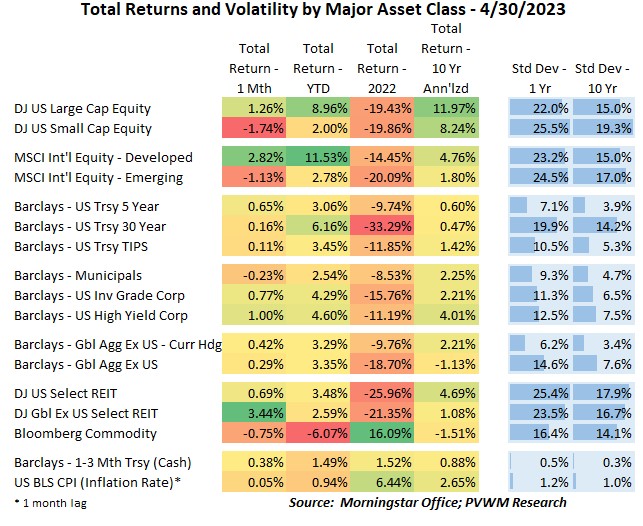
Looking at the “1 Month” column in the table above shows equity markets were all over the place while bond markets were “meh”. But it is worth digging a bit deeper. On the equity side, once again the US large caps and international developed markets continued their strong run, bringing YTD returns to very attractive levels. However, US large cap returns were driven by only a handful of names while the rest of the market was flat to down, more indicative of the US small cap returns. The international developed does benefit from a weaker US Dollar, though that was not a strong driver this month. The international REITs stand out for the month though the YTD column shows they were lagging prior to April. Nothing jumps out from the bond indices, other than the continued resiliency of the high yield bond market in front of increasing recession concerns. But until then, that market wants to keep on whistling.
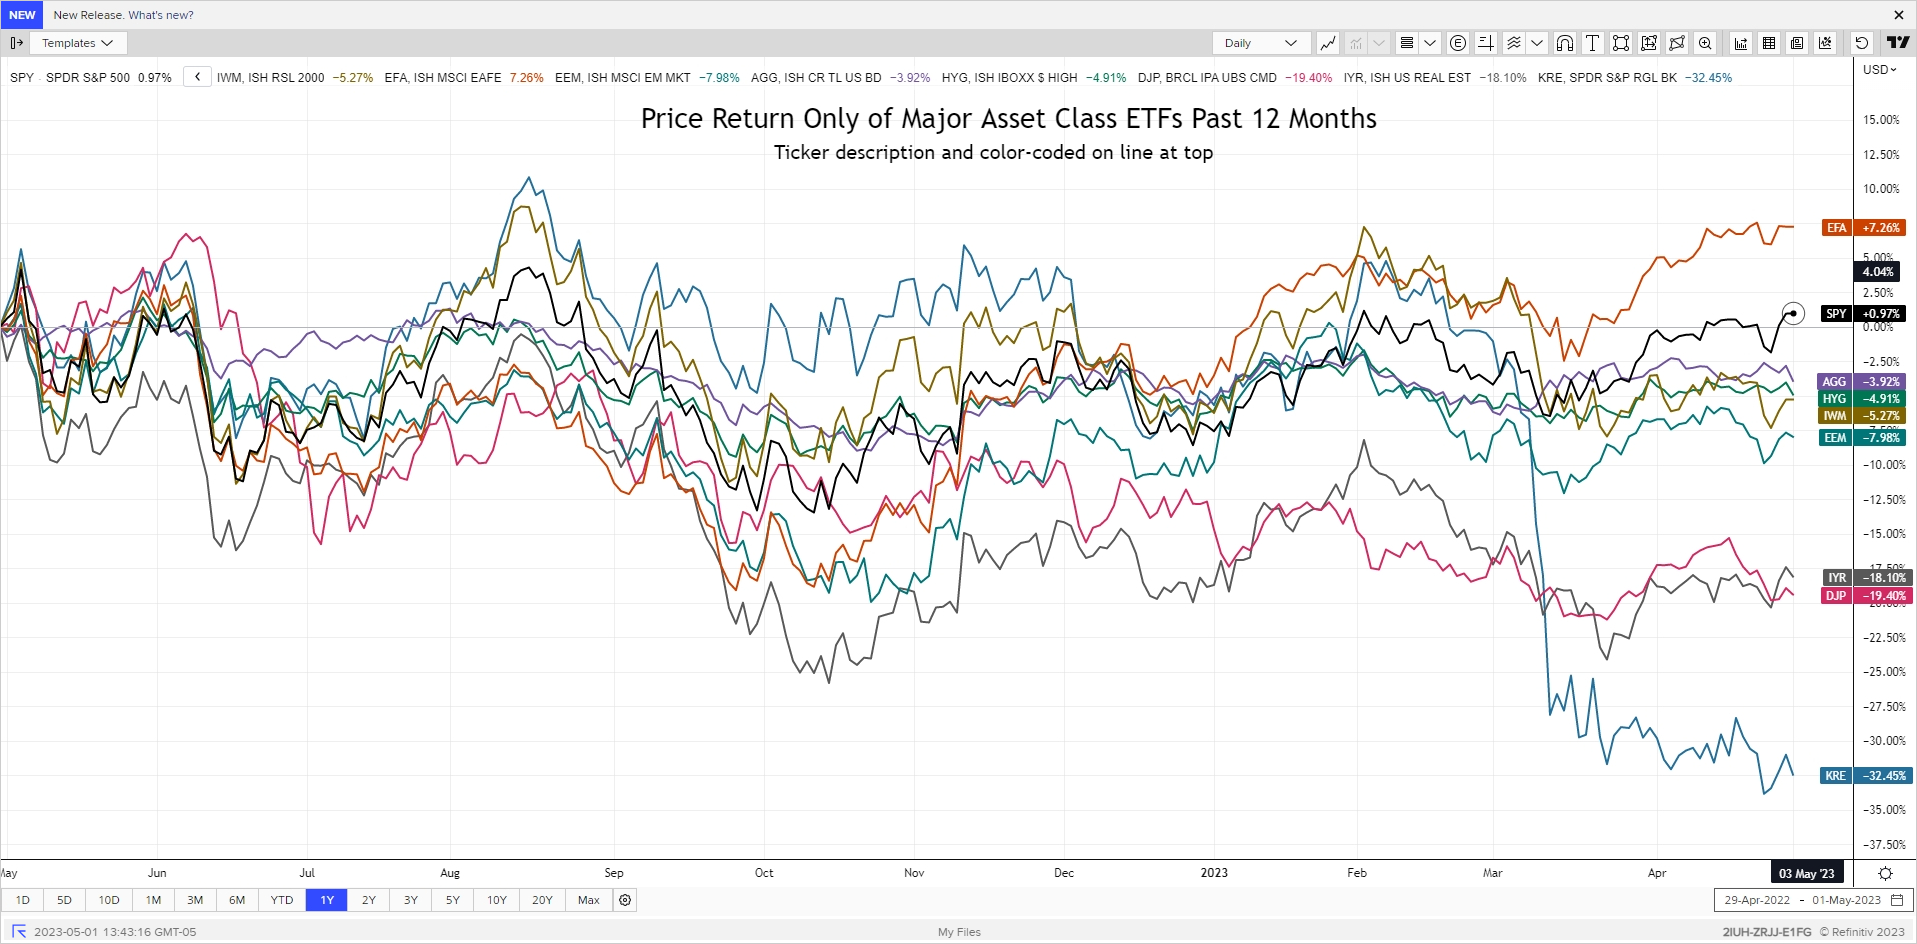
The graph below shows the price return only of the major asset classes based on related index ETFs. You can see how the divergence described above has played out recently by looking at SPY vs. IWM (for US equity) and EFA vs. EEM (for int’l equity). And in case you have forgotten, the banking issues are still with us. We received a stark reminder this morning with the news of JPMorgan acquiring First Republic Bank. I also added the regional bank ETF – KRE – to show how the market remains skeptical of a near-term resolution. In case you can’t find it, look at the bottom of the chart!
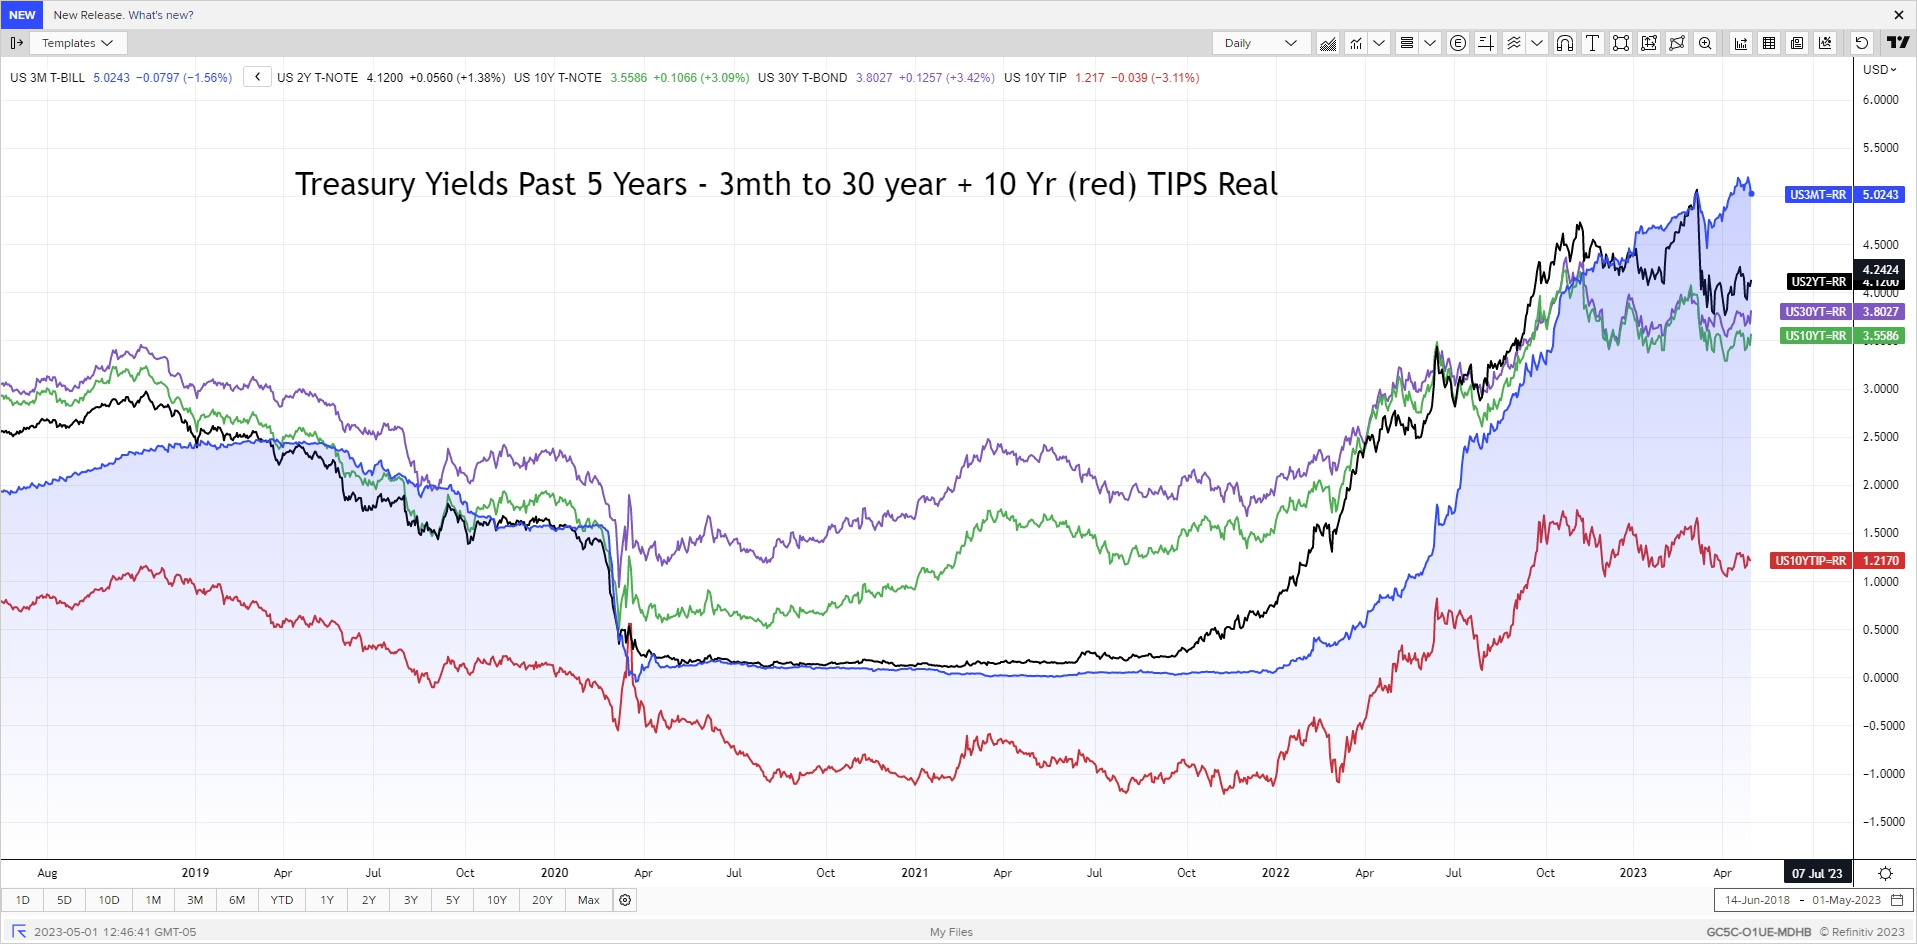
The usual Rates graph shows that rates may have ended the month close to where started, but there were noticeable swings mid-month – with the slight trend moving higher. This was more pronounced for shorter maturities as the market began unwinding some of the expected rate cuts later in the year as inflation remains elevated. The 3-month treasury bill moved back above 5%, though surprisingly the 2-year rate still remains quite low, reflecting some participants’ views that multiple rate cuts will be needed when a recession hits. That continues to be pushed out further, though the banking issues are still with us and the inevitable credit tightening as banks pull back on lending remains a concern.
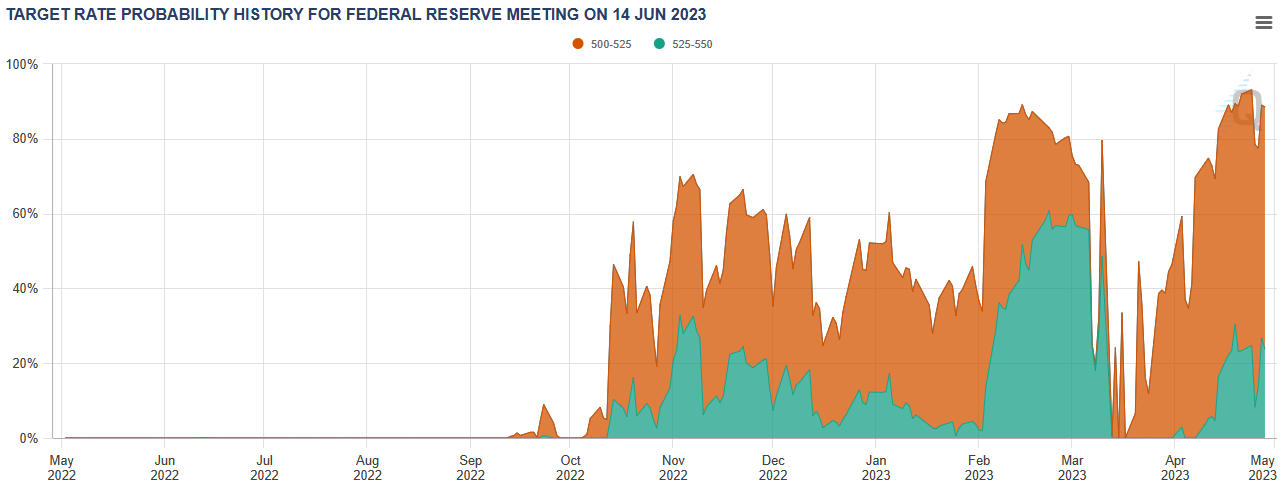
The next Fed meeting concludes this Wednesday, May 3rd. The market is expecting the Fed to raise rates by 0.25% to a Fed Funds target range of 5.00% to 5.25% - the mid-point of the end-of-year Fed projection from the “dot plot”. But as Chair Powell has and continues to remind us, the future path will depend on the data. Pending any reversal in the inflation trends, it is likely the Fed may pause after this hike, though I would not expect the Fed to begin cutting rates anytime soon either. And while fighting inflation is a key focus, any rate increases will add further pressure on the banking sector as bank deposits continue to flee for higher yields. The graph below shows the implied probability of raising rates by 0.25% in early May and then holding at the mid-June meeting to be over 60% (orange band) based on Fed Funds futures. However, the chance of another rate hike (green band) has moved up recently to over 25% (Source: CME FedWatch Tool).
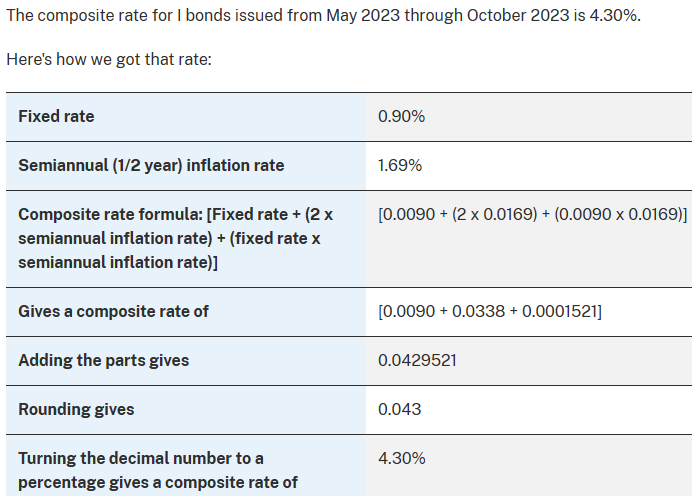
The Treasury Department issued the latest I Bond rate last Friday – 4.30%. Recall the rate is set by the Treasury each May 1 and November 1. That rate is the annualized crediting rate for new funds deposited over the next six months. For funds deposited prior, the inflation component is added to the fixed rate of older contributions’ fixed rate and that combined rate is also earned when the six-month contribution anniversary arrives. Below is the actual calculation from Treasury Direct. Note the following:
- The fixed rate is set at Treasury’s discretion but informed by market-based TIPS real yields (see red line in Rates graph above)
- The inflation rate is formulaic using non-seasonally adjusted CPI-U over past six-months, then annualized; this recent level may seem low but recall the rate set for previous six-month periods was quite high during the rapidly rising inflation period
- Since TIPS real yields turned negative starting in 2019, many recent I Bond contributions have a 0% fixed rate component, so the new crediting rate for those past deposits will only reflect inflation, not an additional real yield
- Recall can’t withdraw new contributions for 12 months, then lose last 3 months interest if withdraw over next four years
- The high I Bond rate over recent past leaves your accrued balance higher even with the 0% fixed rate and you should wait for a lower inflation component reset before considering withdrawing and/or rolling into a new I Bond
- If you haven’t made your 2023 I Bond contribution yet to build up your reserve fund (I view as that only, not an active investment), the 0.90% fixed rate is attractive
Speaking of Treasury Department, Treasury Secretary Yellen announced today (May 1) the US debt limit “x day” may come as soon as June 1st based on latest revenue update. I don’t believe the US will default on debt but based on current political environment and well respected strategists, I do expect negotiations to go up to the 11th hour… and even the 12th and 13th.
To all the Mothers out there – have a Happy Mother’s Day!
Posted by Kirk, a fee-only financial advisor who looks at your complete financial picture through the lens of a multi-disciplined, credentialed professional. www.pvwealthmgt.com