

Asset Class Returns - 3/31/2022
Here is this month’s market summary. Unless noted, the time frame is year-to-date with screen shots through 4/1/2022.
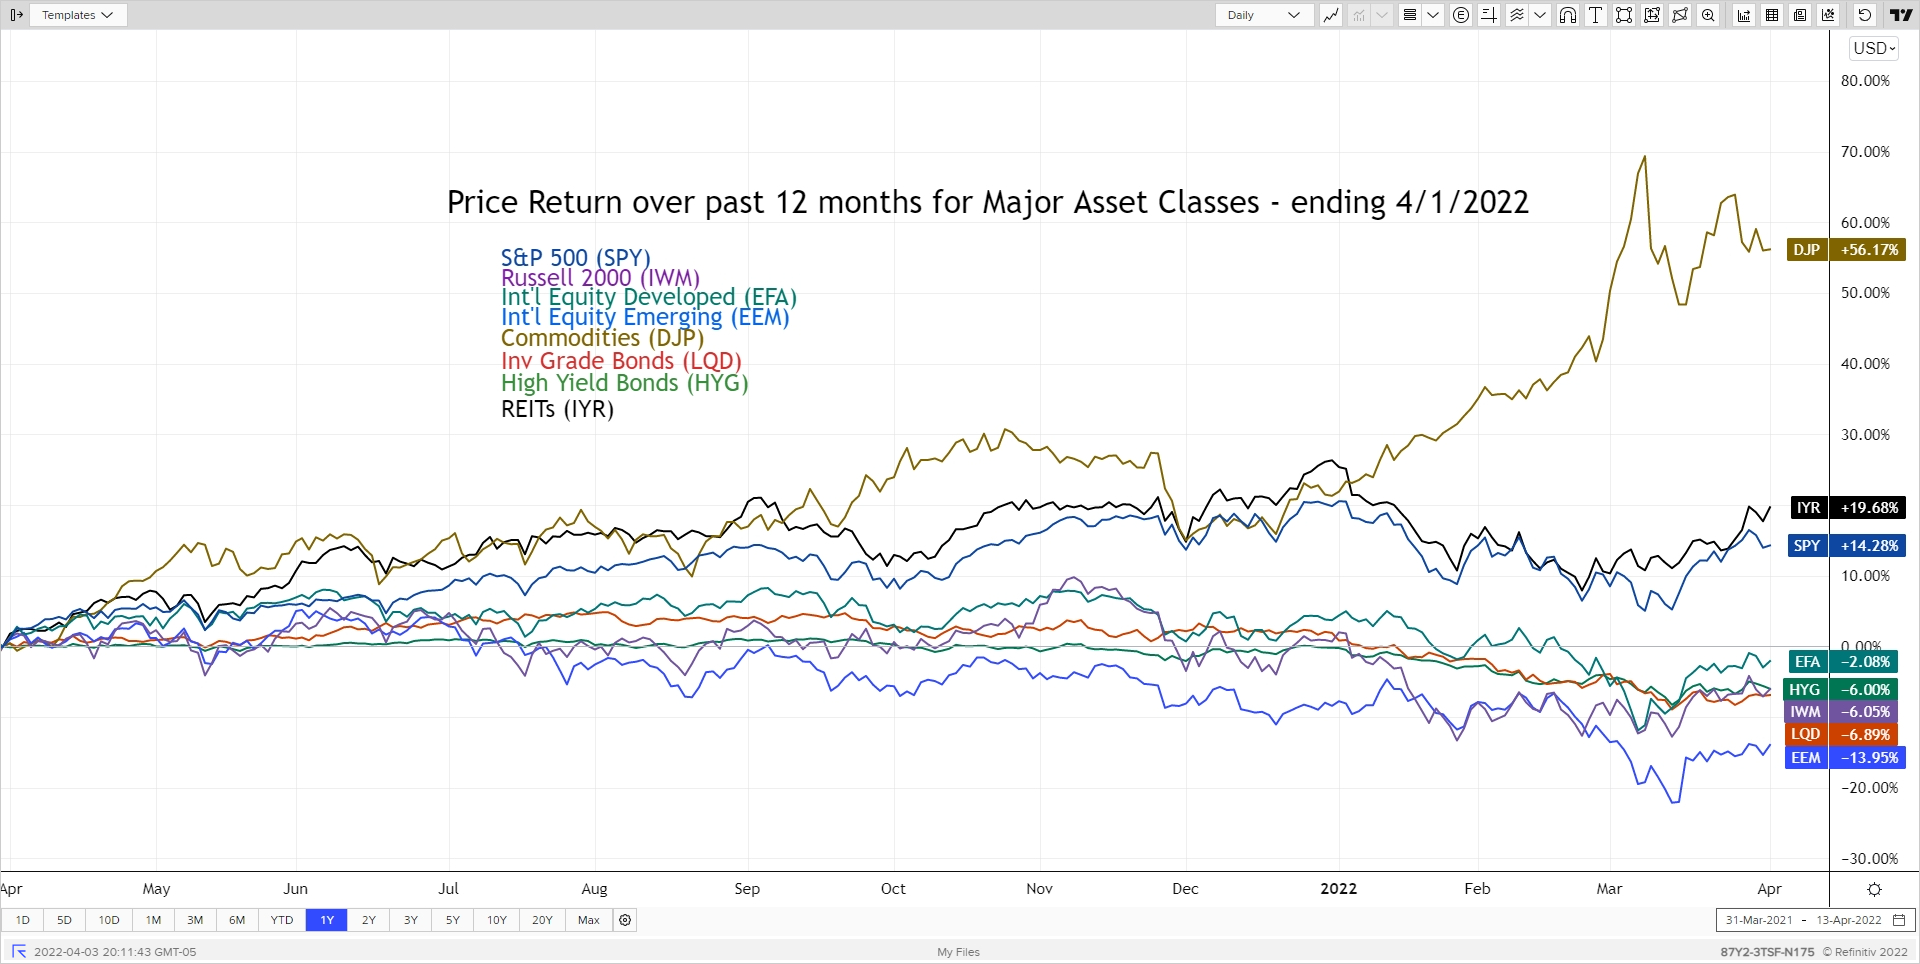
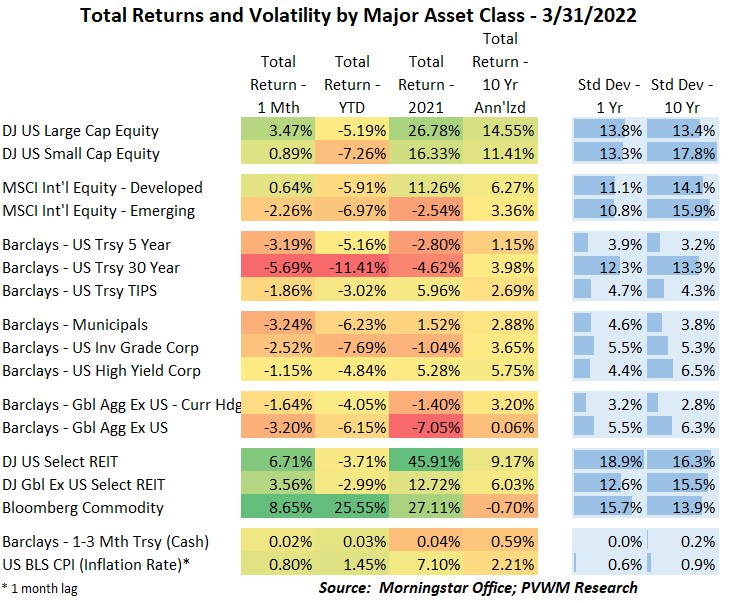
March Madness was present in the bond markets this past month. This blog post will have more rate graphs than usual because of it. Equity markets can be negatively impacted by rising rates also, especially growth stocks, but this month was not that time. Even REITs, also sensitive to rising rates, had positive returns as the inflationary component won over. But what is the biggest red on the table below – both monthly and YTD? Long-term treasuries. The biggest green? Commodities continues the rally on the back of Ukraine/Russia war – and not just driven by energy.
Let’s first look at the major asset class graph. This month the graphs display the past 12 months return. Seeing any positive return is surprising given the backdrop but US Large Caps and REITs had a solid monthly return. Part of this may have been a bit of a relief rally, but the favorable returns are surprising given the active Fed. Emerging markets lagged this month, though on a YTD basis both US and Int’l equities have similar negative returns.
Now on to those bonds…
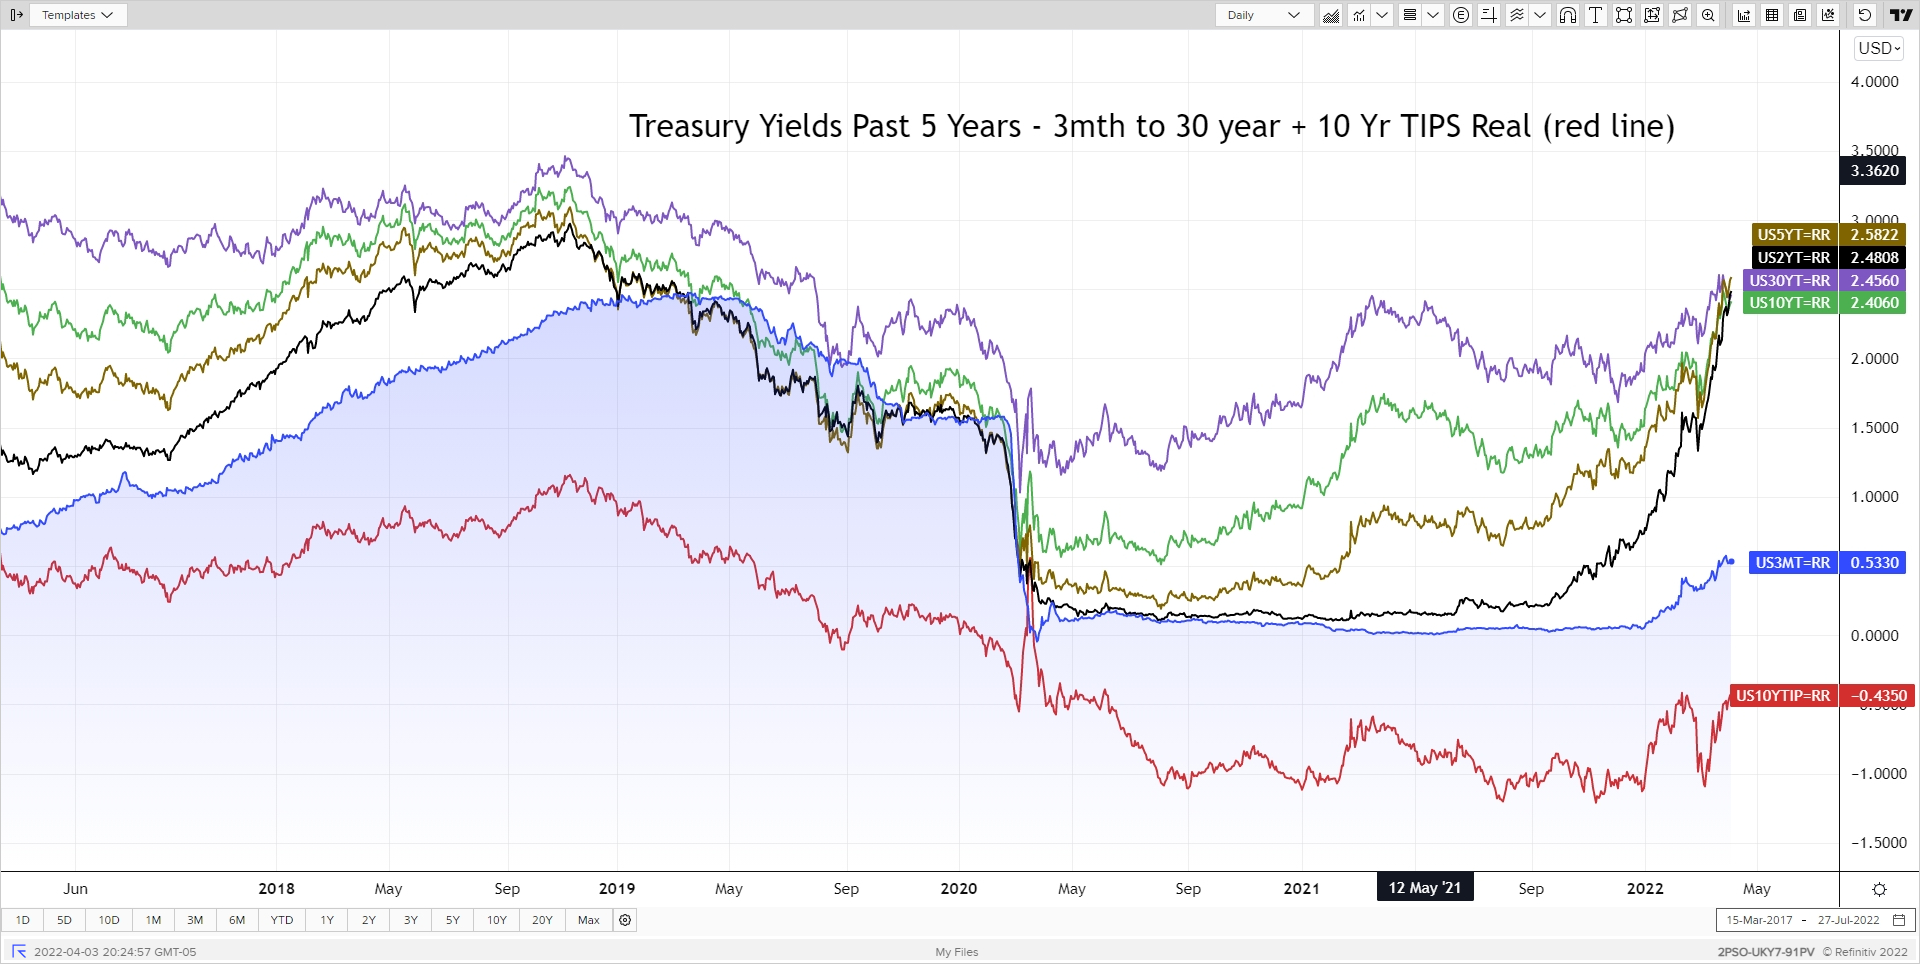
I will start with the usual rate graph. You will see this past month rates really shot up, especially on the short-end of the curve. After the Fed meeting on March 16th where short-rates were raised 0.25%, many Fed officials the following week began talking about the potential for a 0.50% hike at the May meeting. This drove up short rates (3mth, 2- and 5-year). You may have heard in the news the “flat yield curve” or “inverted yield curve indicating recession”. What that commonly means is the 2-year yield is greater than 10-year yield. This can be seen as the rates are all converging around the 2.45% area in the graph below. Bear in mind even IF this signaled an upcoming recession, it is typically at least a year or longer before occurring. Fed officials also believe that is the wrong curve to monitor and instead favor the current 3 month T-Bill vs. the implied 3 month T-Bill 18 months from now. I also believe the 10-year is being distorted by the Fed’s purchases of bonds which they stopped in early March and may announce plans to begin reducing the balance sheet at the May FOMC meeting.
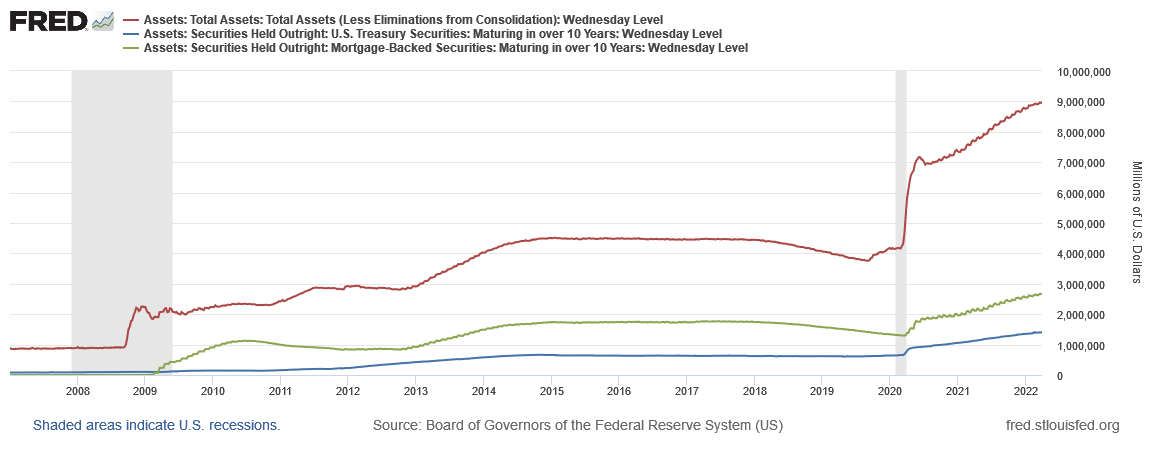
Does the Fed own enough bonds with longer maturities to make a difference? Yes. The following graph shows the total Fed balance sheet (yes, that is in trillions!) along with treasuries and mortgage-backed securities owned with 10-years or longer in maturity. How the Fed reduces the balance sheet is expected to be announced at the May FOMC meeting. Just letting bonds mature without reinvestment is a likely option, but will the Fed decide to sell longer-dated bonds if the yield curve inverts by a larger amount?
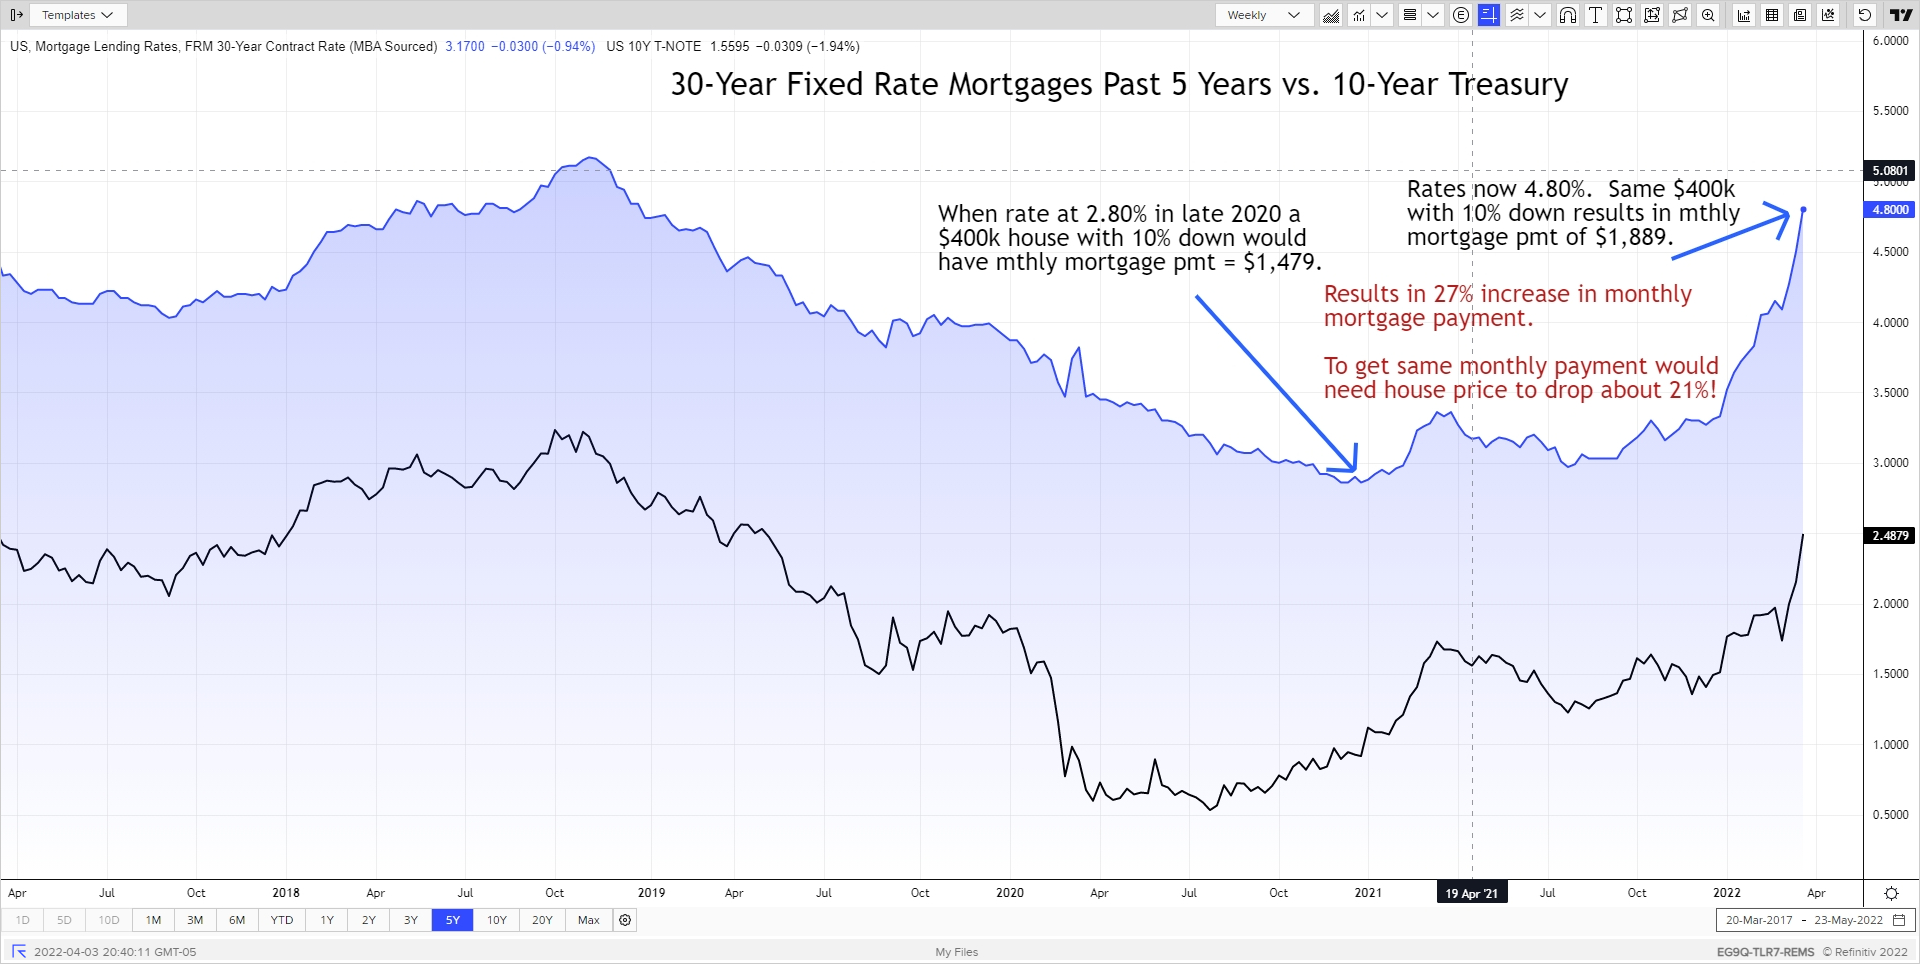
In addition to the negative returns of one’s bond funds this past quarter, another area this is impacting individuals is in mortgage rates. After sub-3% rates in late 2020 due to low rates from Fed buying bonds, the mortgage rate had been drfting up through the end of last year but has sky-rocketed so far this year, especially this past month. The monthly mortgage payment using a 2.80% mortgage from late 2020 versus the 4.80% rate now results in a monthly payment about 27% higher! The impact on the housing market will have to be watched, though perhaps not in those states that are attracting out-of-state buyers that are paying with cash.
May 4th is the conclusion of the next FOMC meeting. The current Fed regime doesn’t like to surprise the markets. The Fed Funds futures are pricing in a 70% chance of a 0.50% rate hike in May (Source: CME FedWatch - 4/1/2022). Given the many Fed speakers that are reinforcing that move during recent speeches makes it more likely to happen. Details of the balance sheet reduction will also be watched closely. For those with active Home Equity Lines of Credit, expect that rate to keep rising in lockstep with the Fed increases. And given the high inflation and the Fed's commitment to fight it, it is very likely that HEL rates may be above 6% by year-end, so plan accordingly.
April showers bring May flowers. And for those living in Chicagoland area, Tom Skilling said we will gain 1 hour and 17 minutes of extra daylight from 4/1 to 4/30, so we have that going for us!
Posted by Kirk, a fee-only financial advisor who looks at your complete financial picture through the lens of a multi-disciplined, credentialed professional. www.pvwealthmgt.com