

Asset Class Returns - 12/31/2022
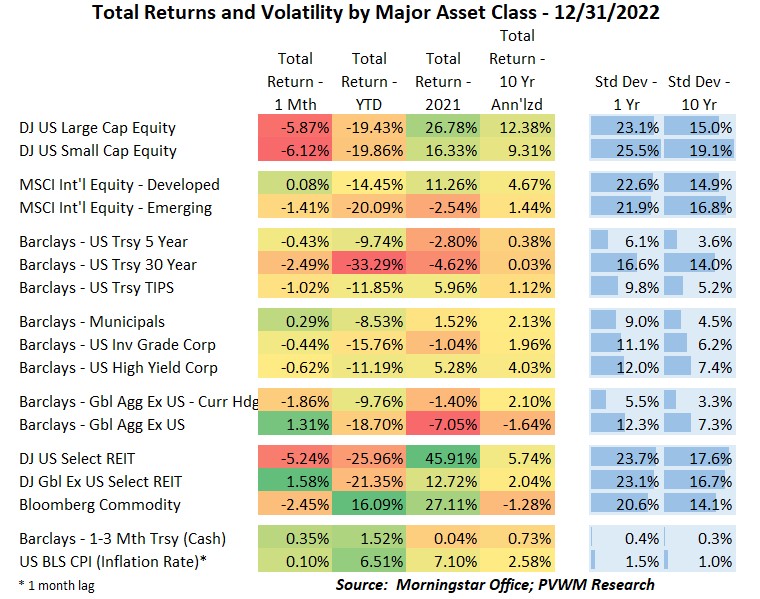
The first part of December saw the momentum continue from the late November rally. That was abruptly stopped after the FOMC meeting mid-month. Not even an attempted Santa Claus rally could get the US returns up for the month. International equities performed much better for a second month in a row bringing YTD returns for emerging markets in line with US equites and the developed markets outperforming by about 5%. Unlike November, the US dollar only contributed about 1% of the outperformance. The less than feared energy crisis from Europe and China backing away from zero-COVID policy were other contributors. US interest rates began drifting back up for the month leading to negative returns for bonds. The YTD loss for 30-year treasuries leads the pack to the downside at over -33%. When you hear US Treasuries are risk-free, that is referring to credit risk, not interest rate risk (rates up, prices down). The largest YTD positive in the table are commodities over +16%. Not shown but even larger gains were seen in the Energy sector (part of commodity driver) and trend-following strategies.
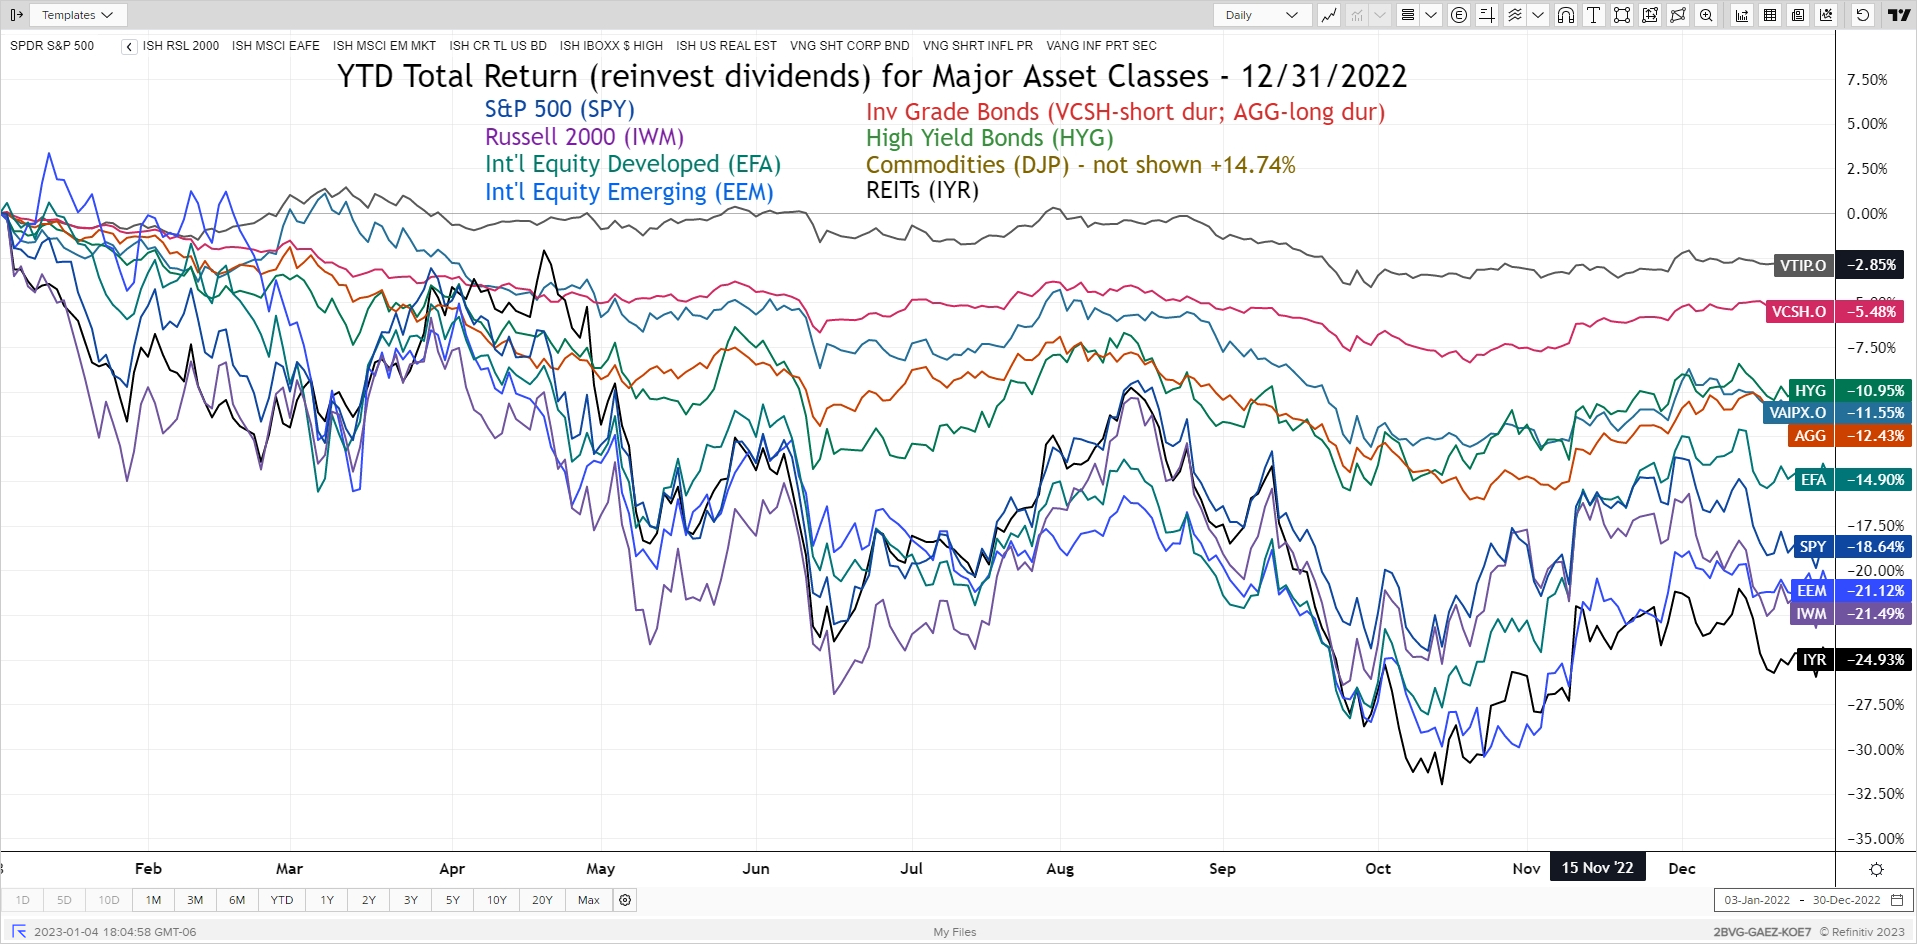
The YTD major asset classes graph below (full year 2022, TOTAL RETURN with investments of dividends) once again excludes Commodities -DJP (+16.9%) for a more refined view. You can see the drop-off in returns after the December 14th FOMC meeting where the Fed was more hawkish (see later) than Powell’s speech at the end of November. Note the different bond fund returns that crystalize the concept of 2022 being an interest rate story, not a credit story which should be monitored closely for 2023:
- The investment grade (AGG) and high yield (HYG) had very similar returns of -11 to -12% despite the different credit quality
- Two Vanguard inflation-linked funds – VTIP and VAIPX – had a return difference of 9% due to the former having a much shorter duration (lower bond price sensitivity).
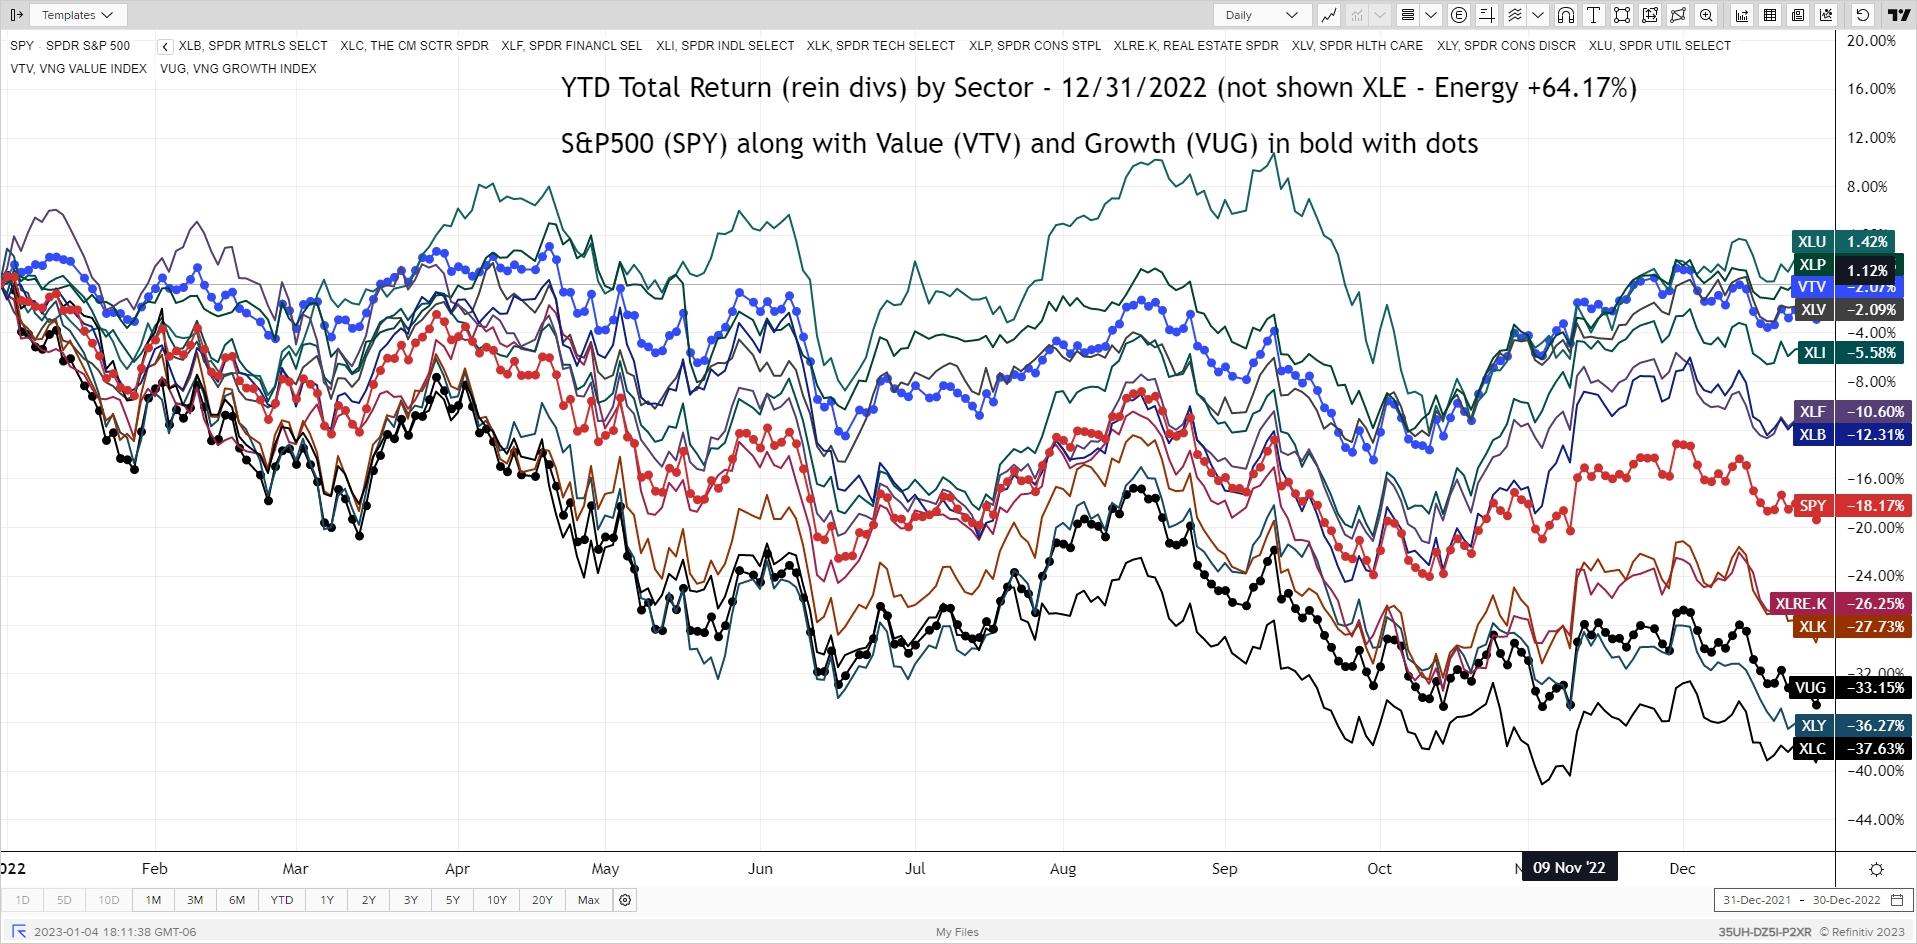
The busy graph below shows the undercurrents of the US equity market by capturing both “Growth vs. Value” and “Sector” returns. Like above, this chart captures TOTAL RETURN with the reinvestment of dividends. While the overall S&P500 had a price return of -18%, Growth stocks were down -34% while Value stocks were only down -2%. Within sectors, the leader was Energy -XLE at +64% (not shown) and the laggard was Communication Sector at -38%. While it’s true AT&T and Verizon are in this sector, over 35% is comprised of Meta (old Facebook) and Alphabet (old Google).
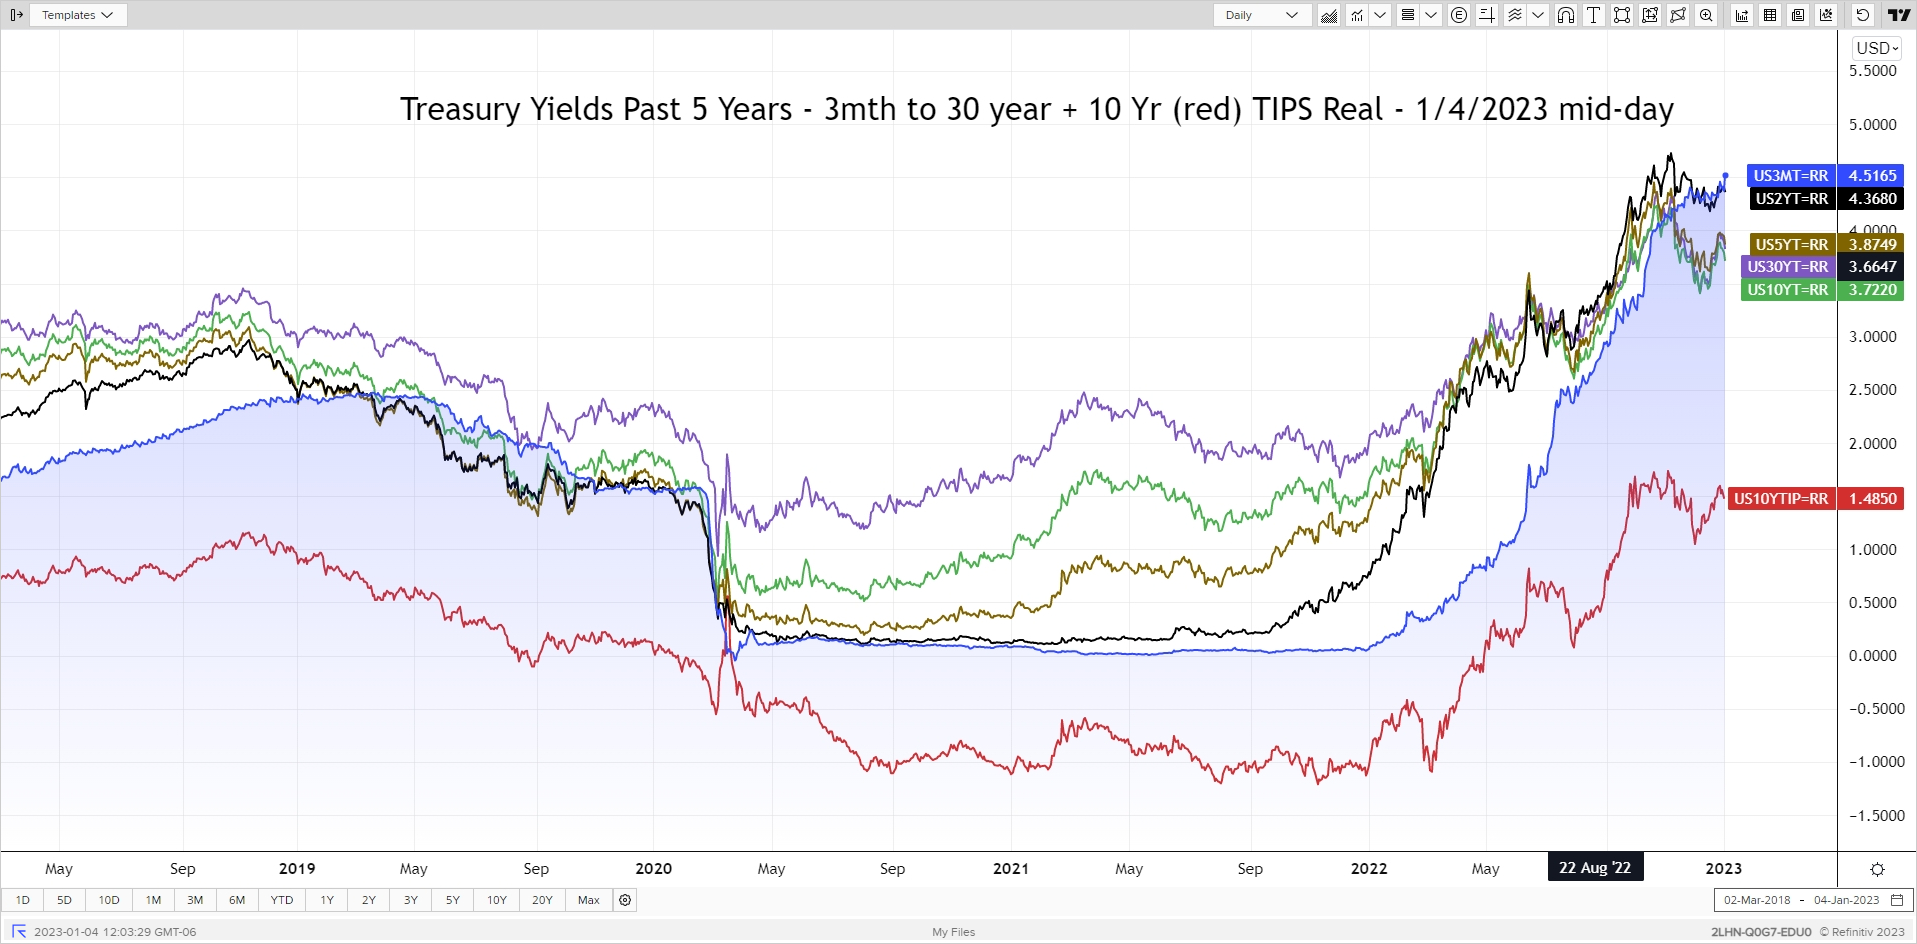
The treasury rate graph this month saw interest rates rising again in December after the FOMC meeting. These rate moves for 2022, on the back of an active Federal Reserve to fight inflation, was the story of the year. Comparing the starting and ending values for 2022 alone are quite astonishing and resulted in the large bond losses captured in the table at the top of this blog post. The curve is quite inverted now (short-term rates higher than long-term) as the Fed continues to tighten to combat inflation and the market is pricing in an upcoming recession and ultimate Fed rate cut – the timing of which is debated. 3-month T-Bill rates are on the top of the mountain, piercing through 4.5%!
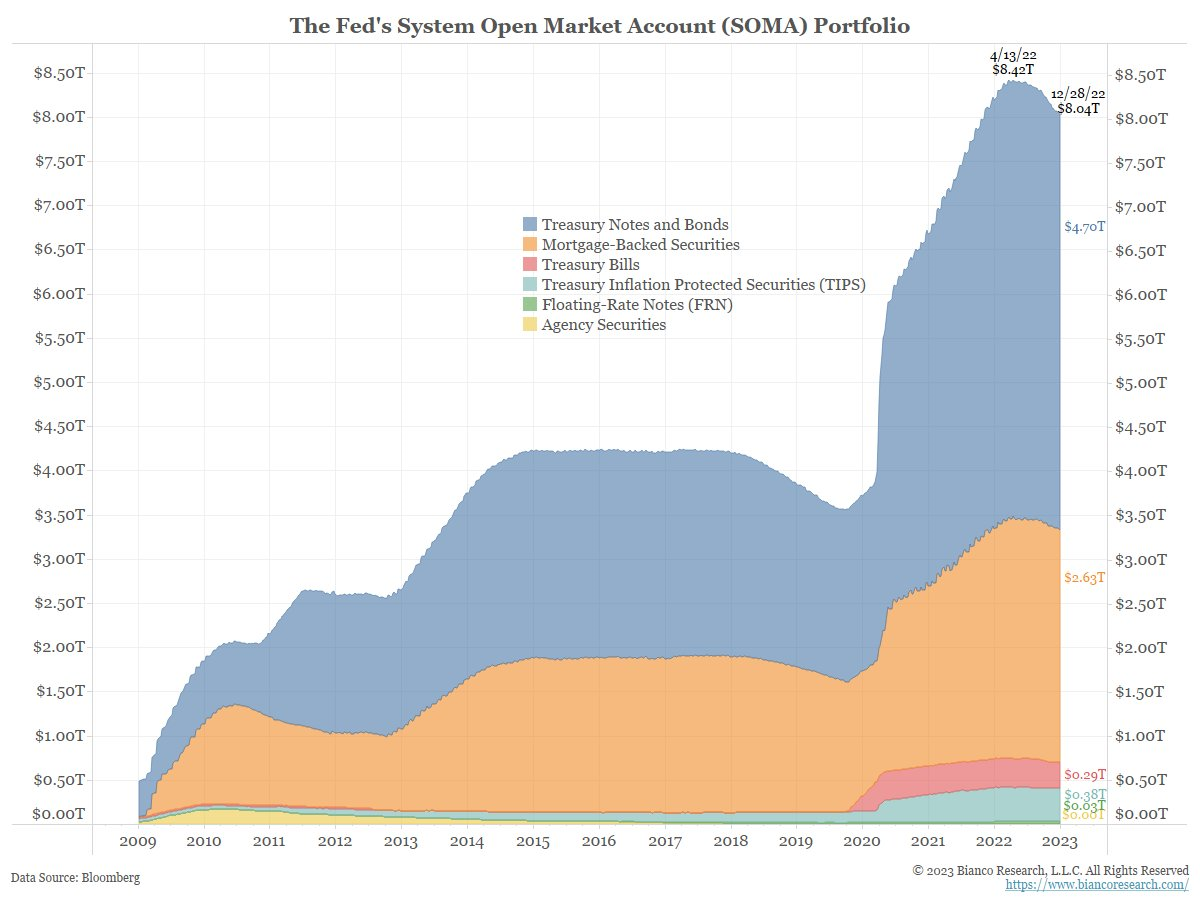
The FOMC meeting concluded December 14th. After four consecutive 0.75% rate hikes, the Fed “only” raised the Fed Funds rate by 0.50% to a target range of 4.25% to 4.50%. The bigger surprise was found in the quarterly ‘Summary of Economic Projections’. Table 1 of this document summarizes the Fed Board and Bank presidents’ individual assumptions of five key metrics. These 19 individuals collectively assumed the Fed Funds rate would reach 5.1% by the end of 2023, up from the 4.6% assumption made in September - and another 0.75% higher than current Fed Funds rate. This was higher than the market had priced in after incorrectly interpreting Powell’s comments as dovish from the late November Brookings Institute speech. During the press conference following the meeting, Powell reiterated the need to see inflation cool (target of 2%) and parsed inflation into Goods (falling), Housing (increasing) and Non-Housing Services (very strong – makes up 55% of index). He indicated the need to keep rates high once they do decide to pause. Powell also mentioned reducing the “balance sheet” multiple times. Recall the Fed is not reinvesting $60 billion/month of Treasuries and $35 billion/month of mortgage-backed securities. In addition to explicit rate cuts, the reduction in balance sheet has the impact of additional rate hikes. A Fed Board of Governors study estimated a $2.5 trillion balance sheet reduction is roughly equivalent to another 0.50% rate hike. The graph below shows the current Fed Balance Sheet standing at $8.04 trillion (Source: Bianco Research). There is more wood to chop.
“That’s very profound, Jimmy. What does it mean?” – The Commitments, 1991, end of movie.
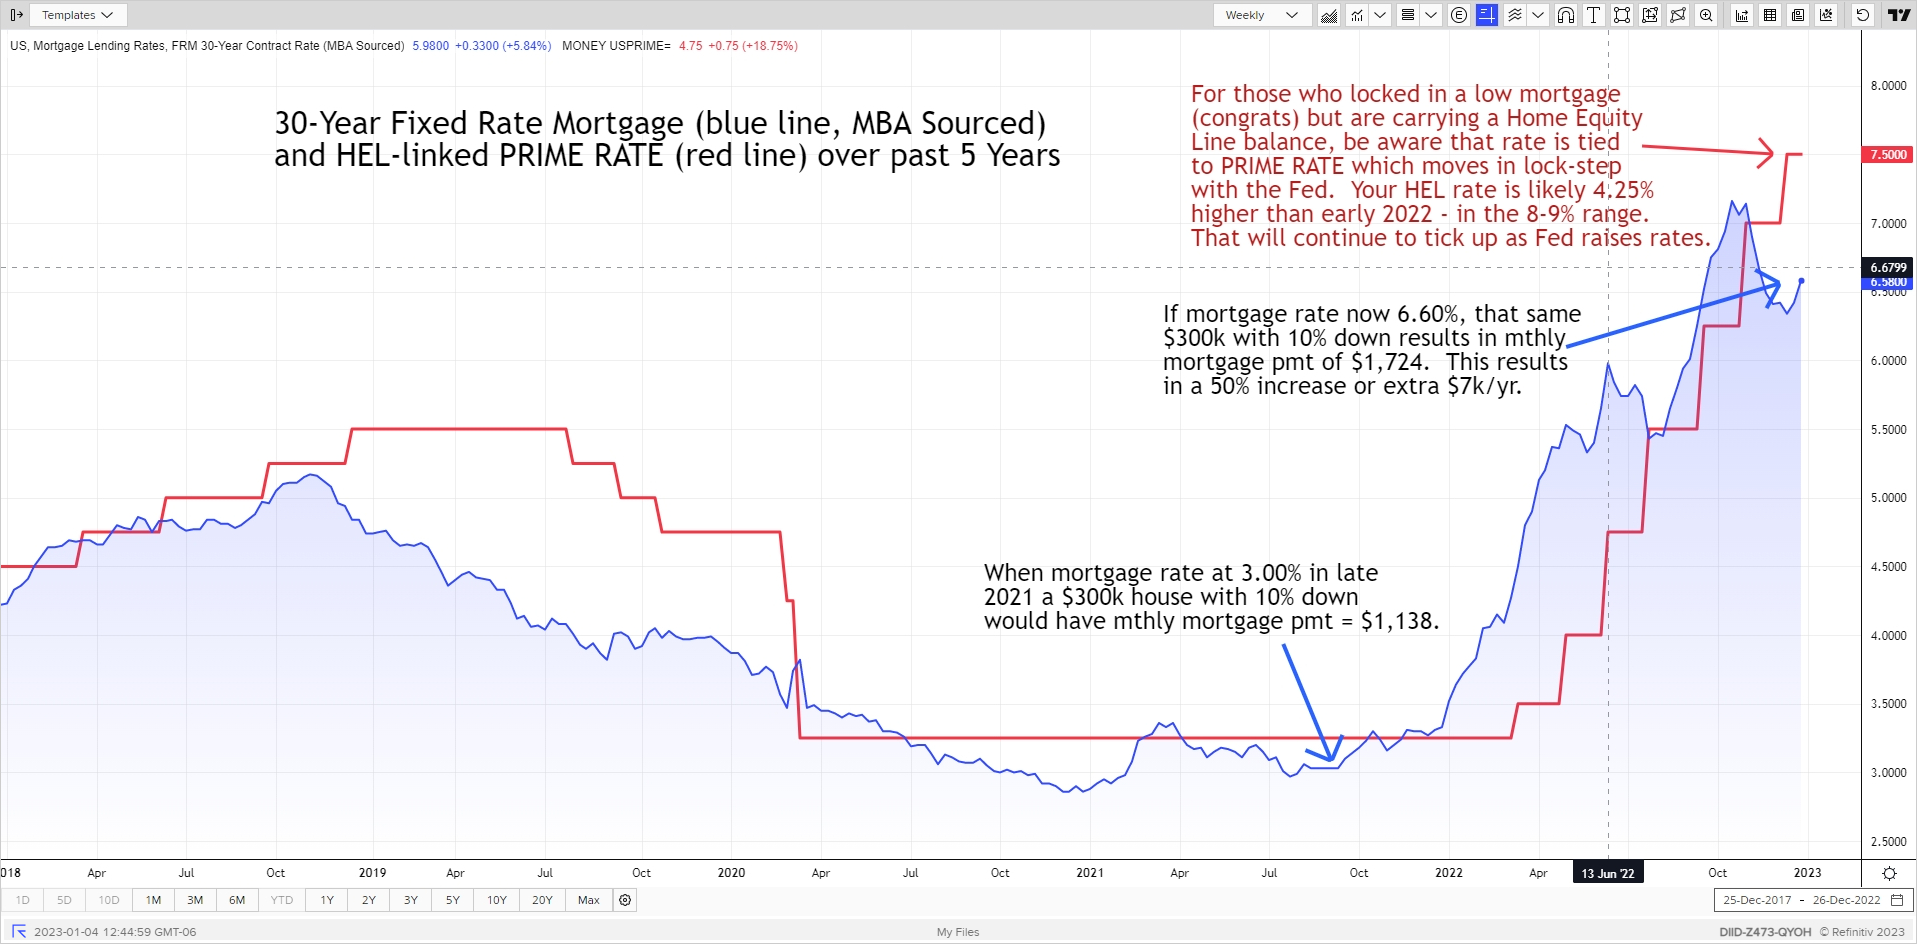
These higher interest rates and active Fed are most felt in the Housing market. Not only are underlying treasury rates rising but the demand to buy mortgage-backed securities is softening as the Fed lets those bonds roll off the Fed Balance Sheet. The Case-Shiller Home Price Index is showing signs of cooling as higher mortgage rates has a direct impact on affordability. The monthly mortgage payment on a $300k house with 10% down is up about 50% relative to a year ago. And those who have a balance on a Home Equity Line should be very aware that borrowing rate has increased substantially in 2022 as well – and with a little more to go. For new home buyers looking for some hope, I read a clever line from a recent @Properties newsletter that says “Marry the Home, Date the Rate” to remind you that if rates do come down after inflation is tamed, refinancing into a lower rate is a fairly easy process.
Happy New Year! If you are into making resolutions, a recent 3-2-1 Thursday by James Clear contained a quote from Patricia Digh that reminded us to not only ask ourselves what we want to create in this New Year but also what to let go of.
Posted by Kirk, a fee-only financial advisor who looks at your complete financial picture through the lens of a multi-disciplined, credentialed professional. www.pvwealthmgt.com