

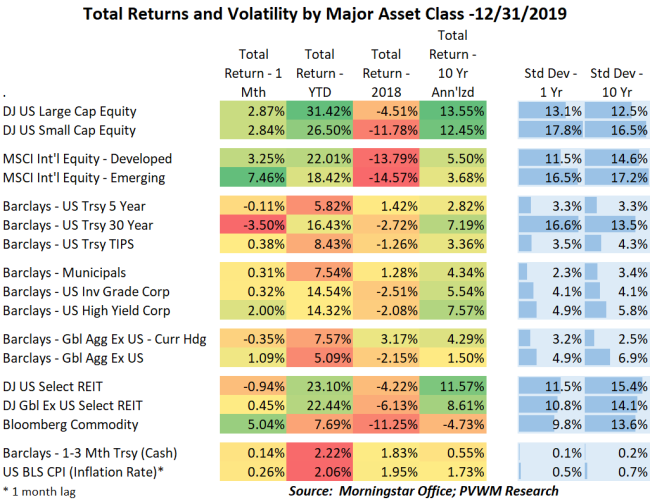
Asset Class Returns - 12/31/2019
2019 returns were very strong across most asset classes, something not many expected at the beginning of the year. The year started with concerns of a potential recession despite (or in part because of) the Fed raising rates which led to an inverted yield curve which in the past was a leading indicator. Since then - with bouts of volatility around trade negotiations - we have a Fed that cut rates three times and indicated on hold, an unemployment rate that is the lowest since the 1960’s and a trade deal which removed some global growth concerns.
For the month, international equities and commodities were the strong performers on the back of the trade deal. Emerging markets were up almost 7.5% for the month alone, though still trailing other major equity indices YTD. At the US sector level, Technology continued the strong run for 2019 though Energy was in the lead for most of the month. Long-term rates drifted higher causing a 3.50% loss on 30-year treasuries while shorter maturity rates were relatively flat. Corporate credit – both investment grade and high yield – were roughly tied for the year at a very lofty 15% return. That is not uncommon for high yield to hit that level but for investment grade, 2009 was the last time it was higher following the very wide spread levels from 2008 crisis.
Immediately below is the usual table I show each month. Following that are six graphs through a wider lens touching upon various topics to consider as you enter the new year and look at your portfolio. As viewers of Hill Street Blues may remember - "Let's be careful out there."
Six charts through a wider lens
#1 - A low 2019 starting point caused YTD returns to be large. This graph shows cumulative returns since Jan 2018. Divide by two for a rough approximation of annual returns. US large caps still had impressive double-digit returns.

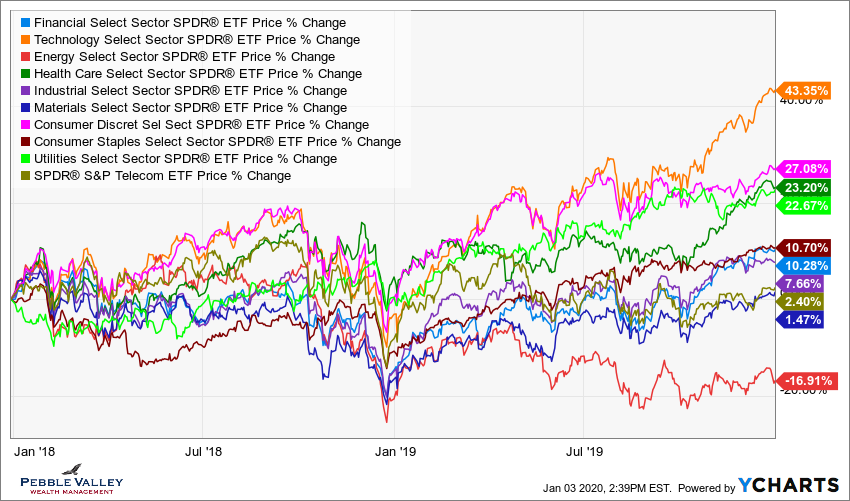
#2 – US equity sector returns were quite disperse over the past two years. Technology had a very efficient recovery, Energy had no energy and Utilities got a jolt from continued low rates. Also note Amazon is in the Consumer Discretionary, not Technology sector with about a 25% weighting!
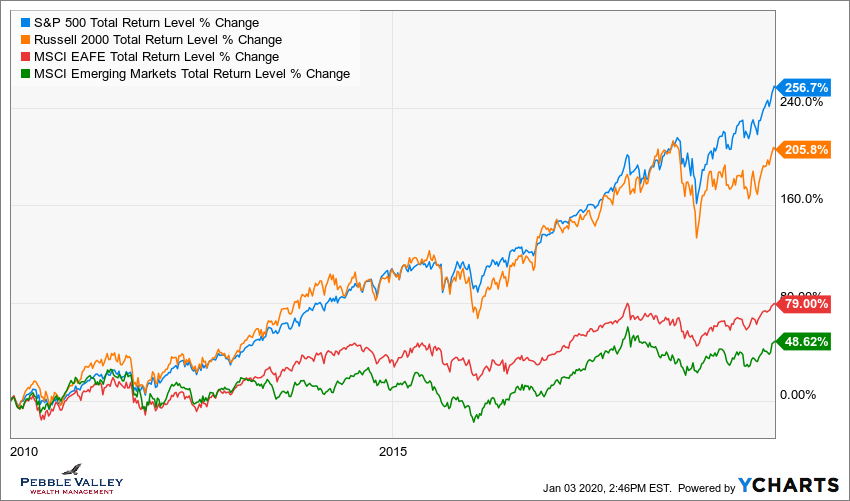
#3 – The prudent investor who diversified with international equity has not been rewarded over the past decade relative to US equities. A strong dollar driven by “+” interest rates and US growth also hurt when converted back to US$. But relative valuations for int'l equity and the impact of potential dollar weakness may help going forward.
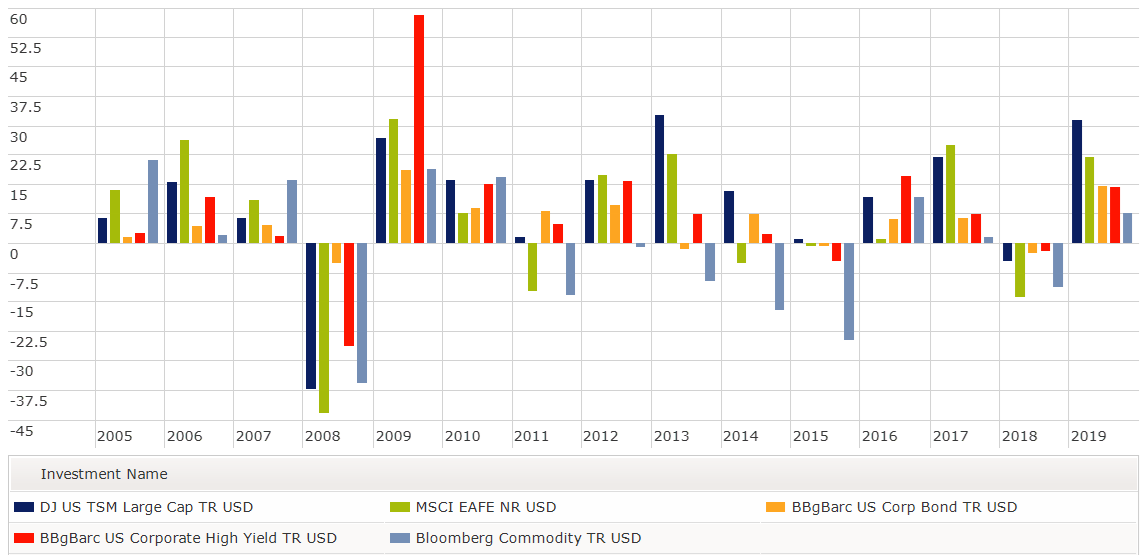
#4 – Everything is up bigly which is rare across so many asset classes in the same year. You have to go back to 2009 and 2010 for a similar “everything up” scenario. Notice the similar “everything down” the year prior then and now.
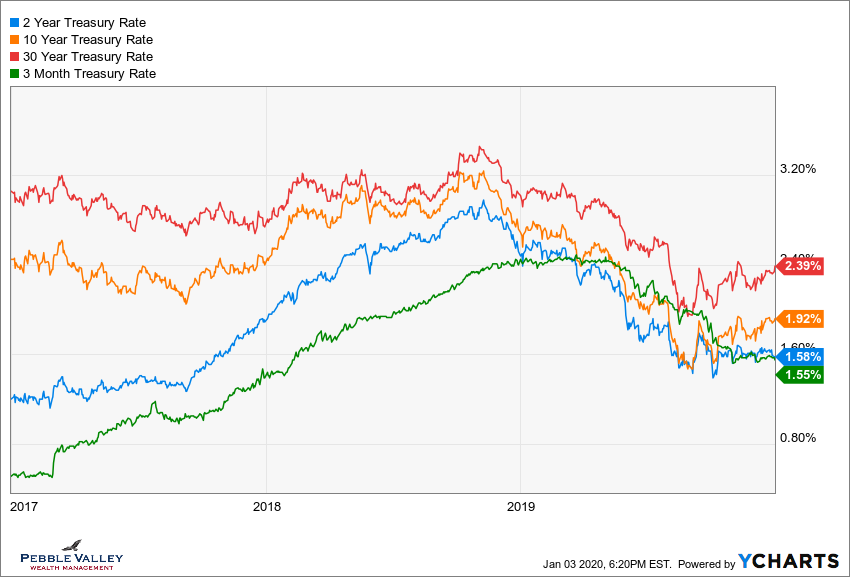
#5 – The inverted yield curve (short-term rates higher than long-term) got much attention early in 2019 with concerns as a recessionary signal. There was a brief time in August when the 3-month T-Bill had a higher rate than the 30-year. Fed rate cuts since then has normalized the curve, though still quite flat. Do you want the extra duration risk of 10yr vs. 2yr for 34bps? With benefit of hindsight the answer was 'yes' in 2019 but what about going forward?
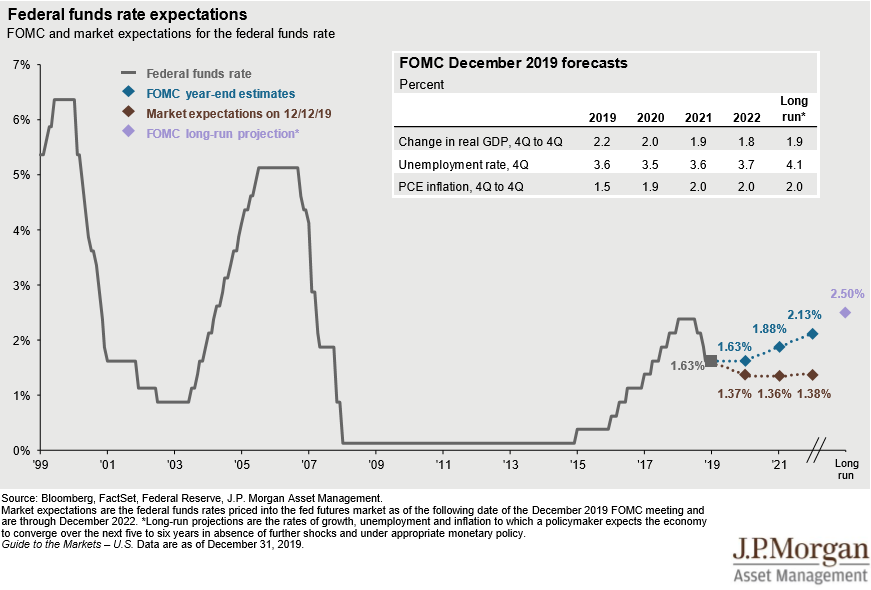
#6 – The Fed cut rates three times in 2019 – July, September, October. The December meeting indicated they were likely on hold for a while. The average future yr-end rate estimates as captured by the Fed’s “dot plot” shows on hold for 1 year and then drifting back higher. The Fed Funds futures market disagrees, expecting the next move lower this year.
Posted by Kirk, a fee-only financial advisor who looks at your complete financial picture through the lens of a multi-disciplined, credentialed professional. www.pvwealthmgt.com