

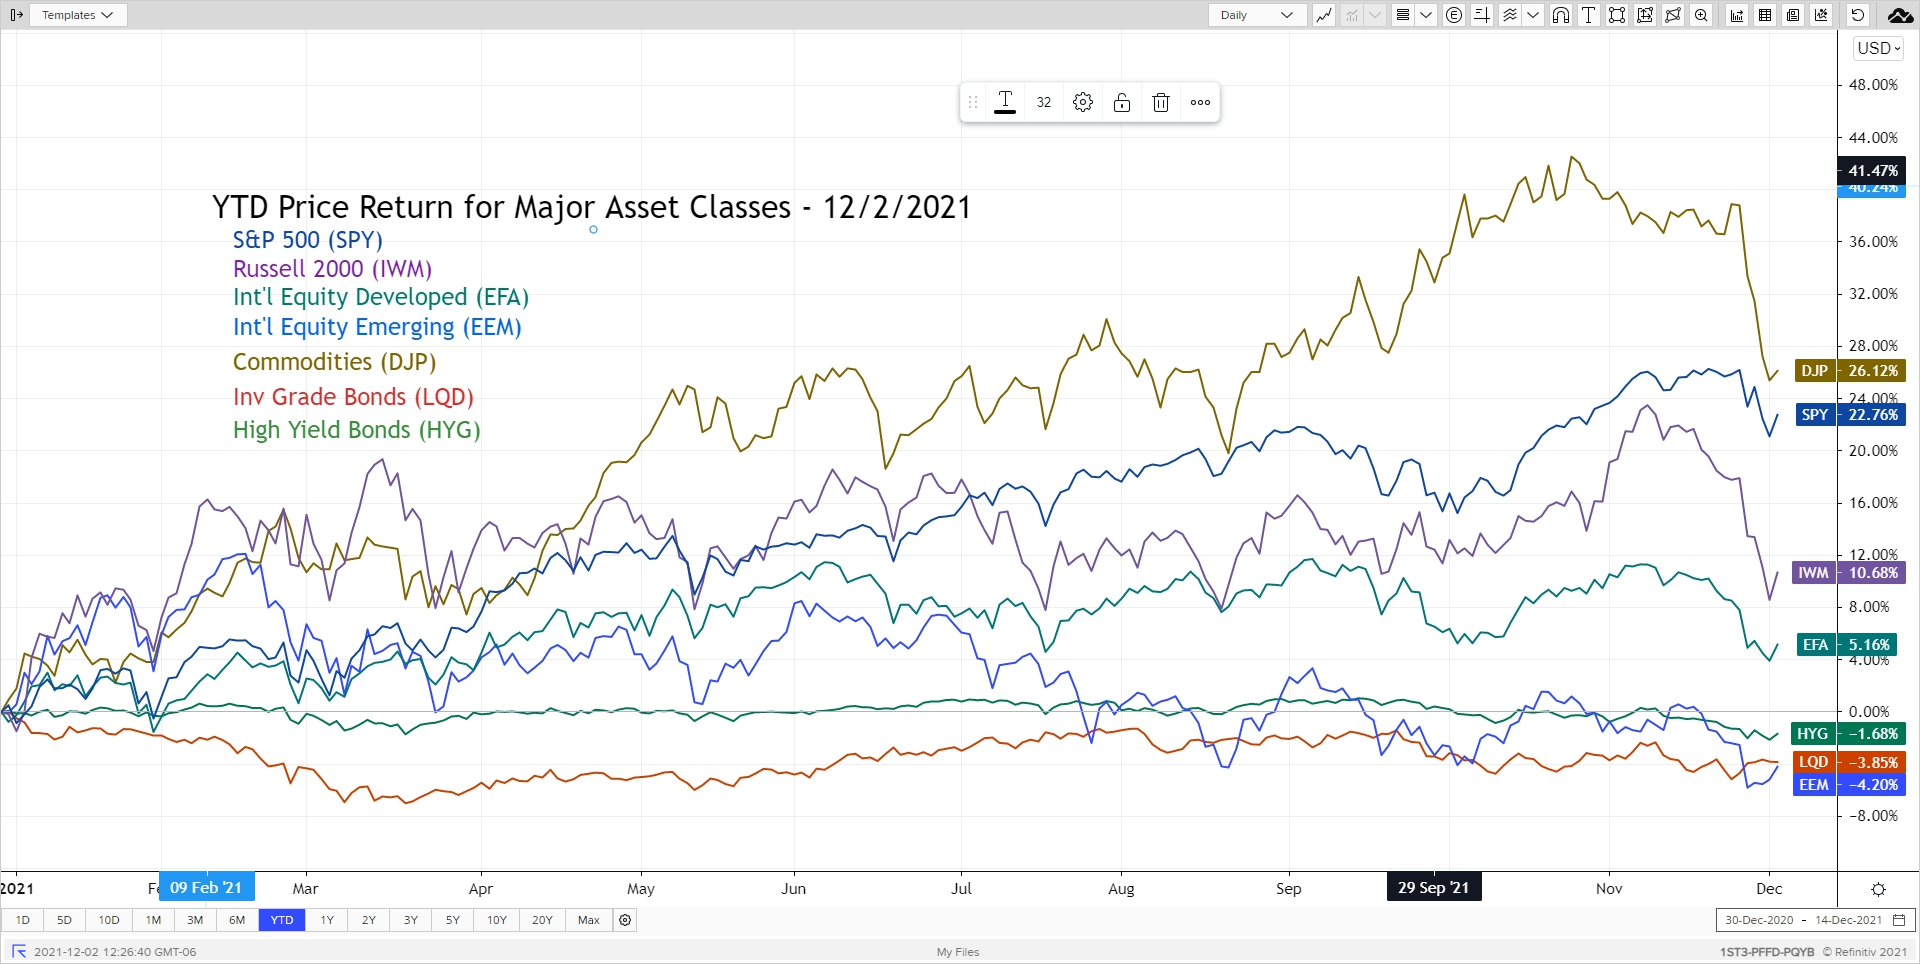
Asset Class Returns - 11/30/2021
Here is this month’s market summary. Unless noted, the time frame is year-to-date with screen shots through 12/2/2021 am.
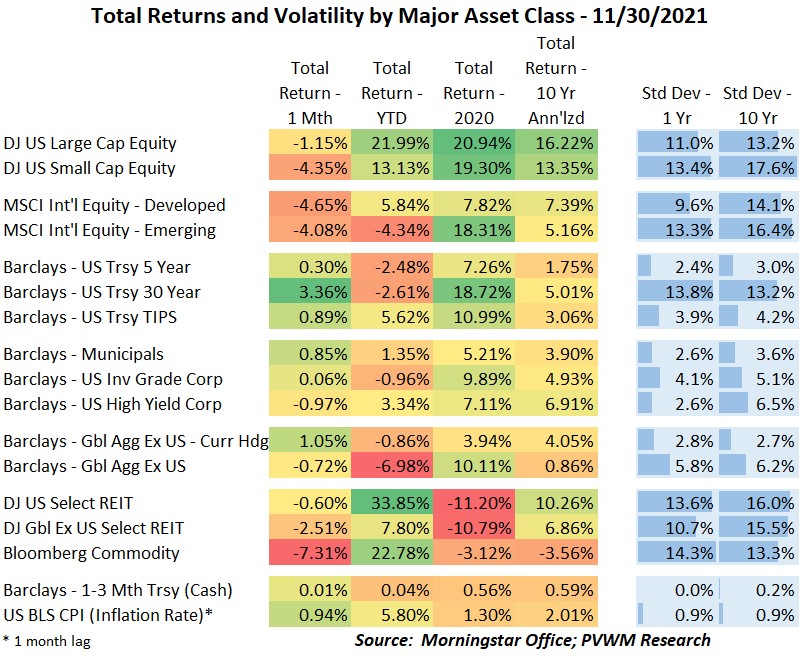
Market returns were looking tasty up until Thanksgiving but the announcement of a new COVID variant (still to be determined how severe, if at all) and the Federal Reserve acknowledging inflation may not be “transitory” caused a significant pullback during the last week. Bond asset classes are the only positive monthly returns in the table far below, though the same can’t be said for year-to-date returns. The larger pullback in US Small Caps in November caused the YTD dispersion vs. Large Caps to widen to just under 8%! The international markets had an equally ugly November. Note this brings Emerging markets negative on a YTD basis – not able to overcome the China crackdown earlier in the year and COVID concerns. Of the two Alternative asset classes that were on top YTD last month, US REITs remained at the peak with the help of falling interest rates but Commodities saw a very large pullback, though hanging on to second best YTD returns.
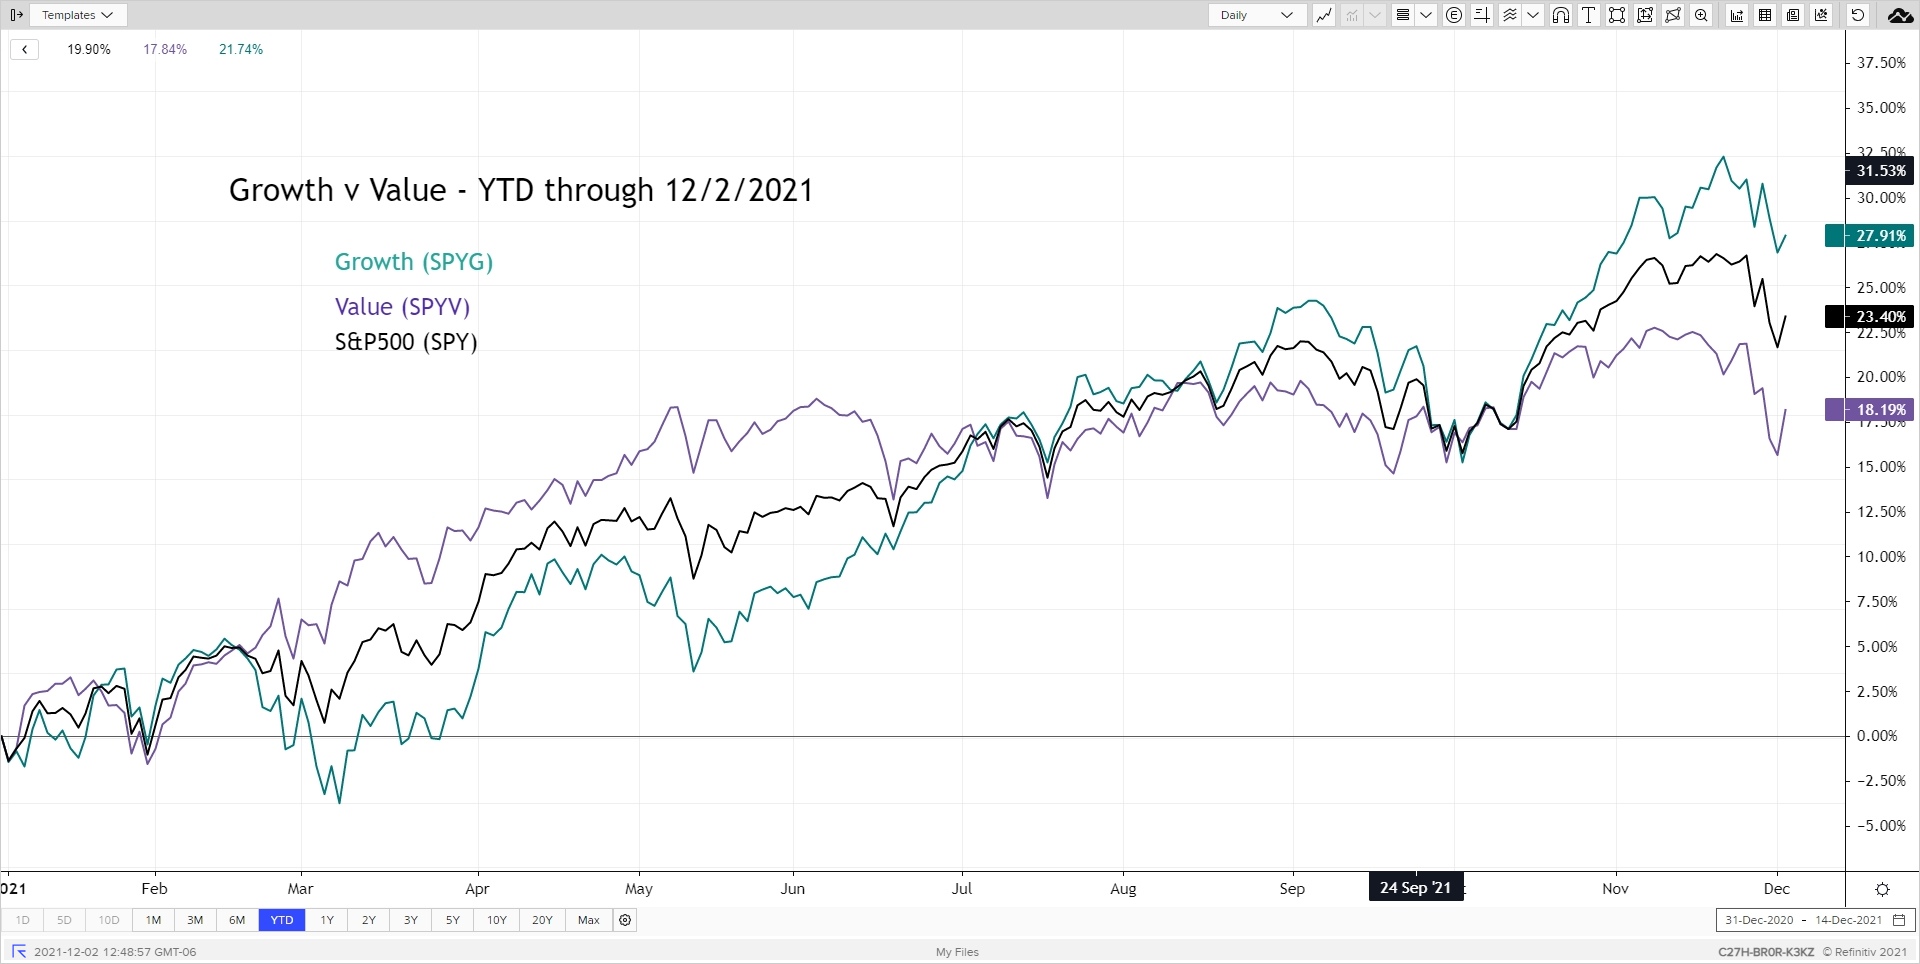
A graph I haven’t shared in a while but that caught my attention recently is the Growth v. Value chart. Value charged out of the gates at the beginning of the year as rising rates early in the year started taking a toll on growth companies. As rising rates cooled in late spring and throughout the summer performance flipped. With the potential for a rising rate environment again (see below), Value may begin to outperform. The recent selloff didn’t spare Value however with the Energy and Financial components adding to the near-term drag.
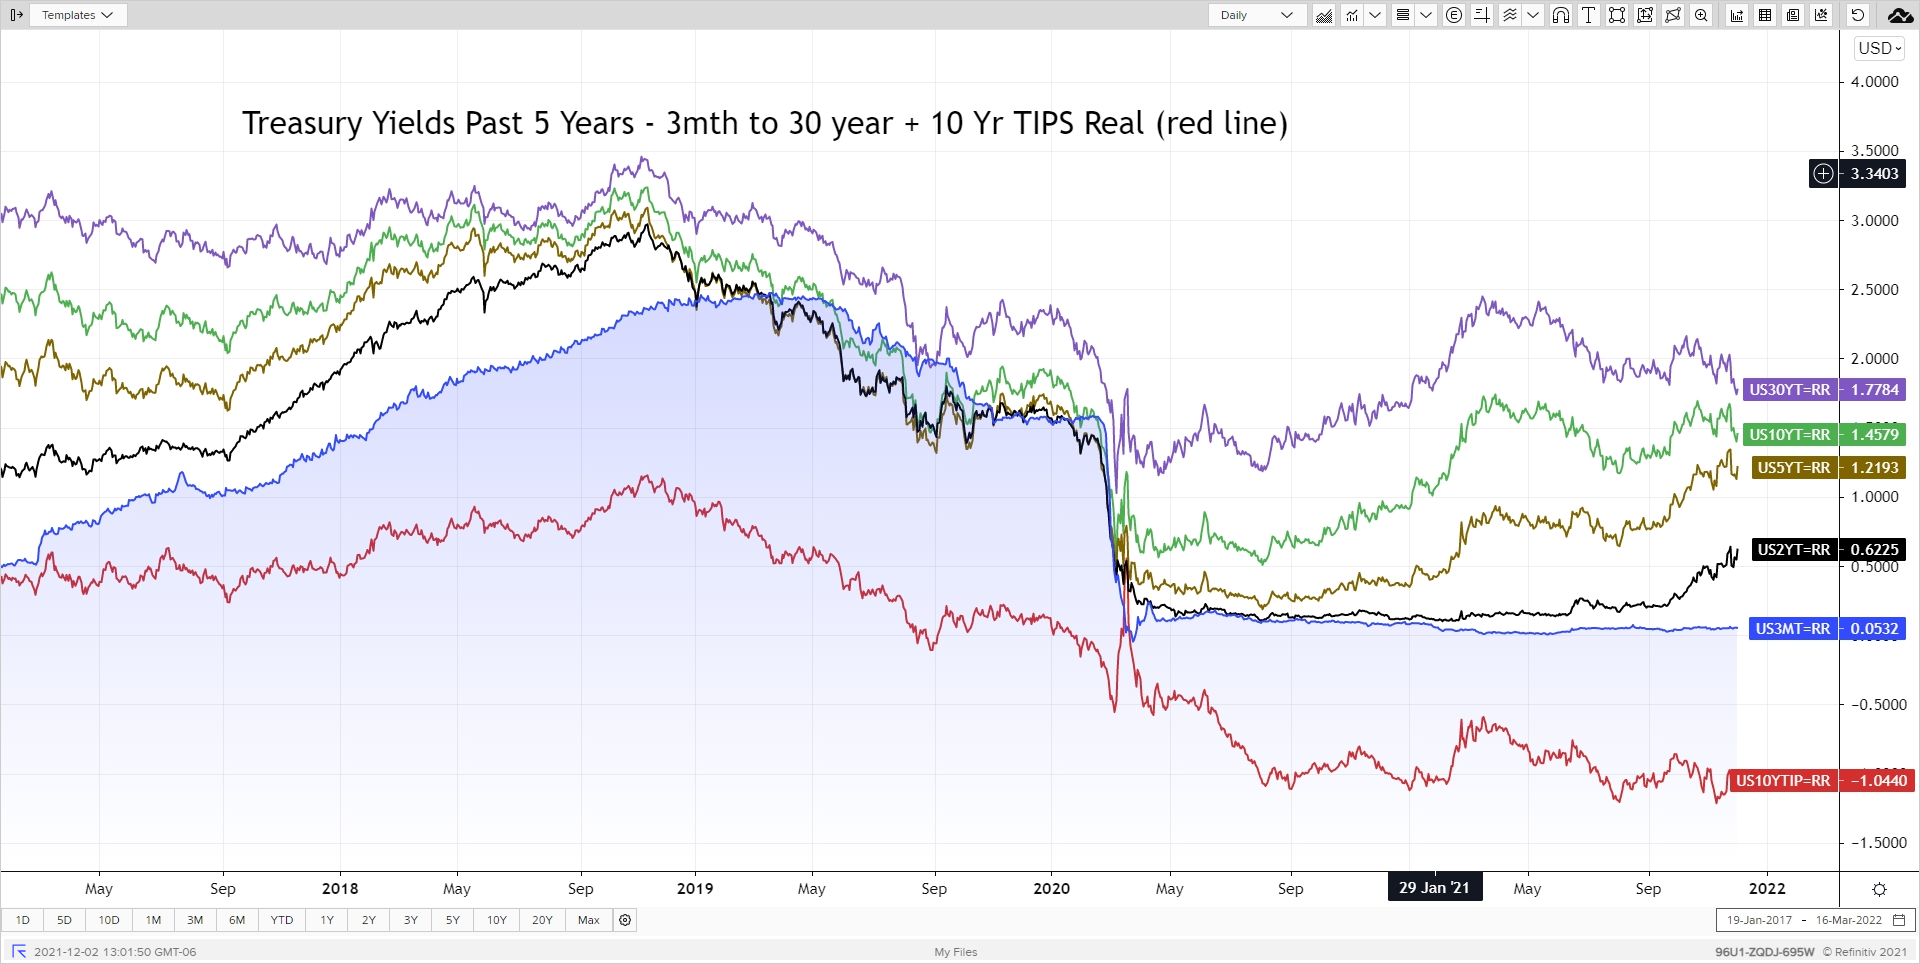
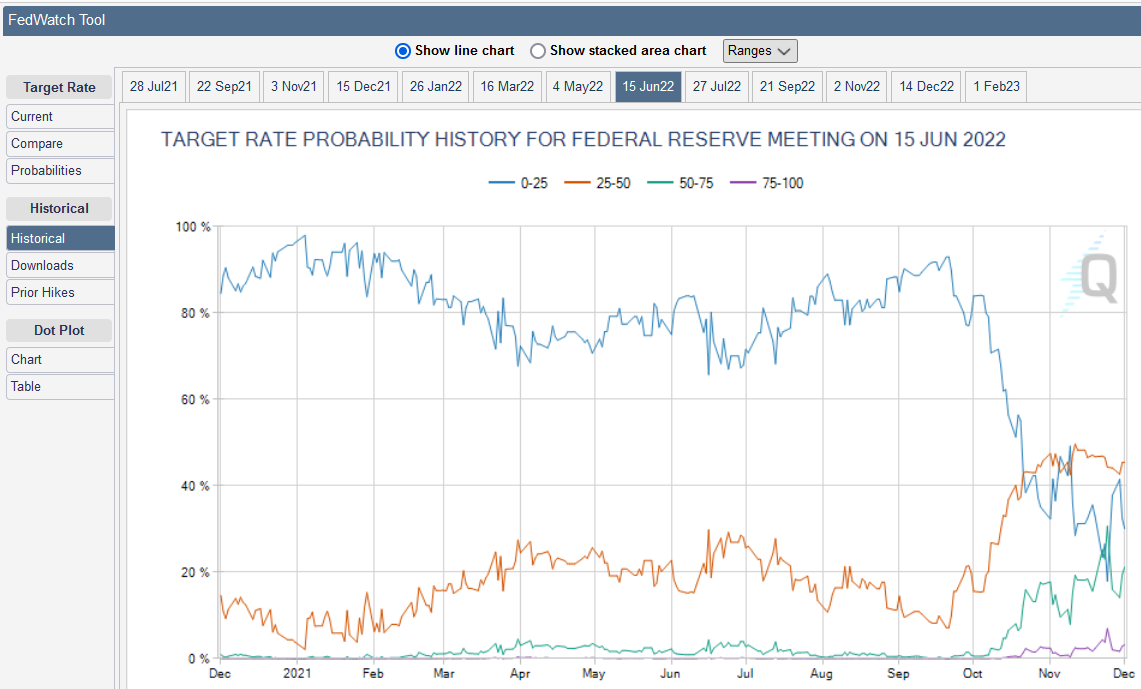
The Federal Reserve had another major shift in their characterization of inflation. Initially inflation was viewed as transitory and supply-chain concerns weren’t on their radar. Last month Fed Chair Powell acknowledged supply-chain bottlenecks were adding to the inflationary pressure and may persist, causing the market to begin pricing in earlier rate hikes. Then this week in front of Congress, Powell dropped the work “transitory” in describing inflation and indicated they may buy even fewer bonds than initially indicated at the November FOMC meeting (i.e. speed-up the “tapering”). This would allow these bond purchases to end by March, opening the door for the Fed to begin raising rates if necessary. The first chart shows the usual treasury yields over time. Again, I point out the continued moves in 2- and 5-year rates as Fed hikes get priced in. The second graph shows the increase in the probability of at least one and possibly two Fed rate hikes by next June based on market instruments (Source: CMEGroup FedWatch tool).
December is here! Start early and savor the season.
Posted by Kirk, a fee-only financial advisor who looks at your complete financial picture through the lens of a multi-disciplined, credentialed professional. www.pvwealthmgt.com