

Asset Class Returns - 04/30/2020
After the very rapid, deep plunge of risky markets in late March, there was almost as robust a recovery in April for US equities. You might ask if there was such a large % increase, why aren’t we closer to previous highs? Note the larger the % drop in value, an even larger % increase is required to get back to the starting level. The common example is “it takes a 100% return to recover after a 50% drop”. In the spirit of learning at home like our future leaders are currently doing, let’s use the price of a popular S&P 500 ETF (SPY) as a real-life example since it just occurred over a short time period.
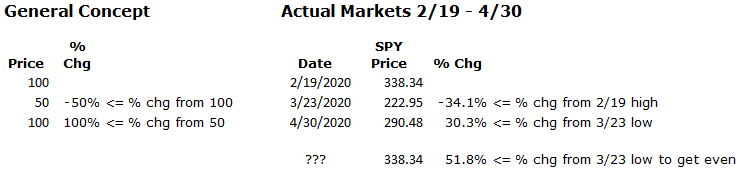
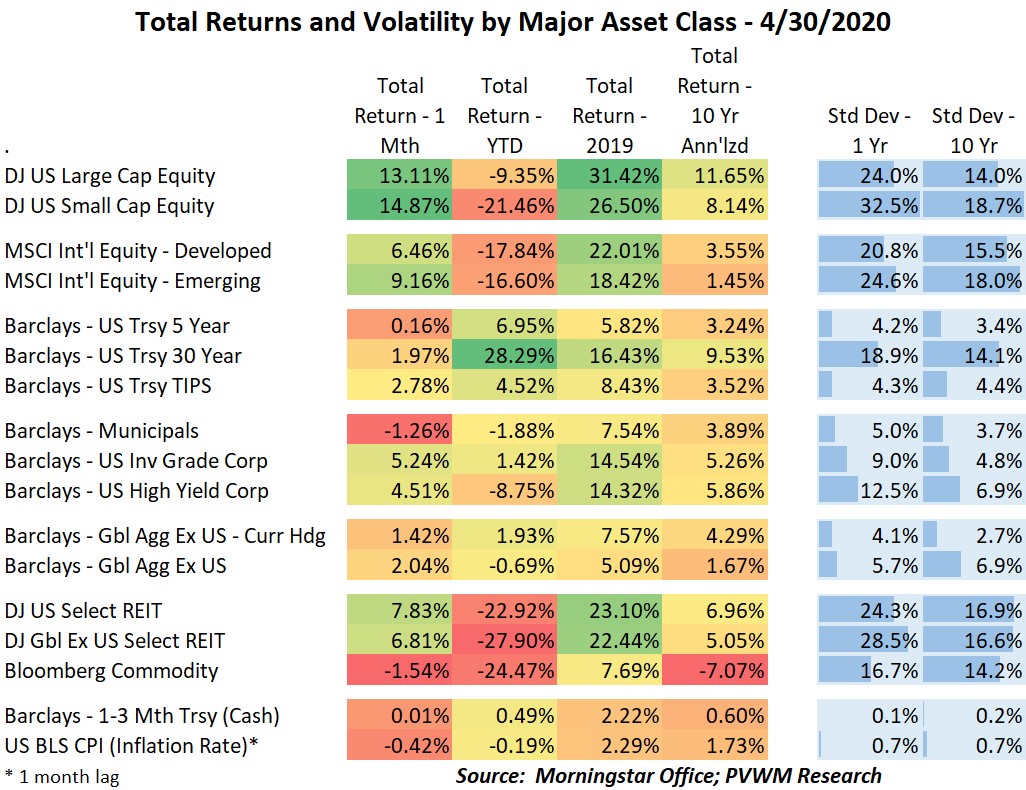
The eager student may now be asking why the 1-month return of large caps in the table below is “only” 13.1% when my whiteboard (or chalkboard for some) above shows a 30.3% return. Anybody remember the last week of March? The same SPY ETF was up 15.6% from 3/23 – 3/31! Things move fast in volatile times.
Ok “teach”, get back to the market summary…
The recent market moves were reacting to positive developments from the COVID situation but also the extreme moves to the downside. However, the economic impact will take longer to play out. While I’m optimistic on the re-emergence of economic activity, it feels the recent market moves were too far, too fast.
Before I show market graphs with a few bullets, I want to briefly comment on the “negative oil price” some of you may have heard about in late April. It is true the price of the FRONT-MONTH ONLY FUTURES CONTRACT traded close to -$38/barrel the day before the contract expired. It is also true there is very low demand and very high supply of oil right now leading to low oil prices – but still quite positive in the +$20/barrel range. The reason for the negative price on the futures contract was the way that oil future contract settles at expiration. Anyone still holding that future contract at expiration had to take physical delivery of oil. Given the large excess supply storage barrels were full and the holders of the contract were willing to pay to avoid taking delivery.
Here are some brief comments followed by the related graphs I find interesting.
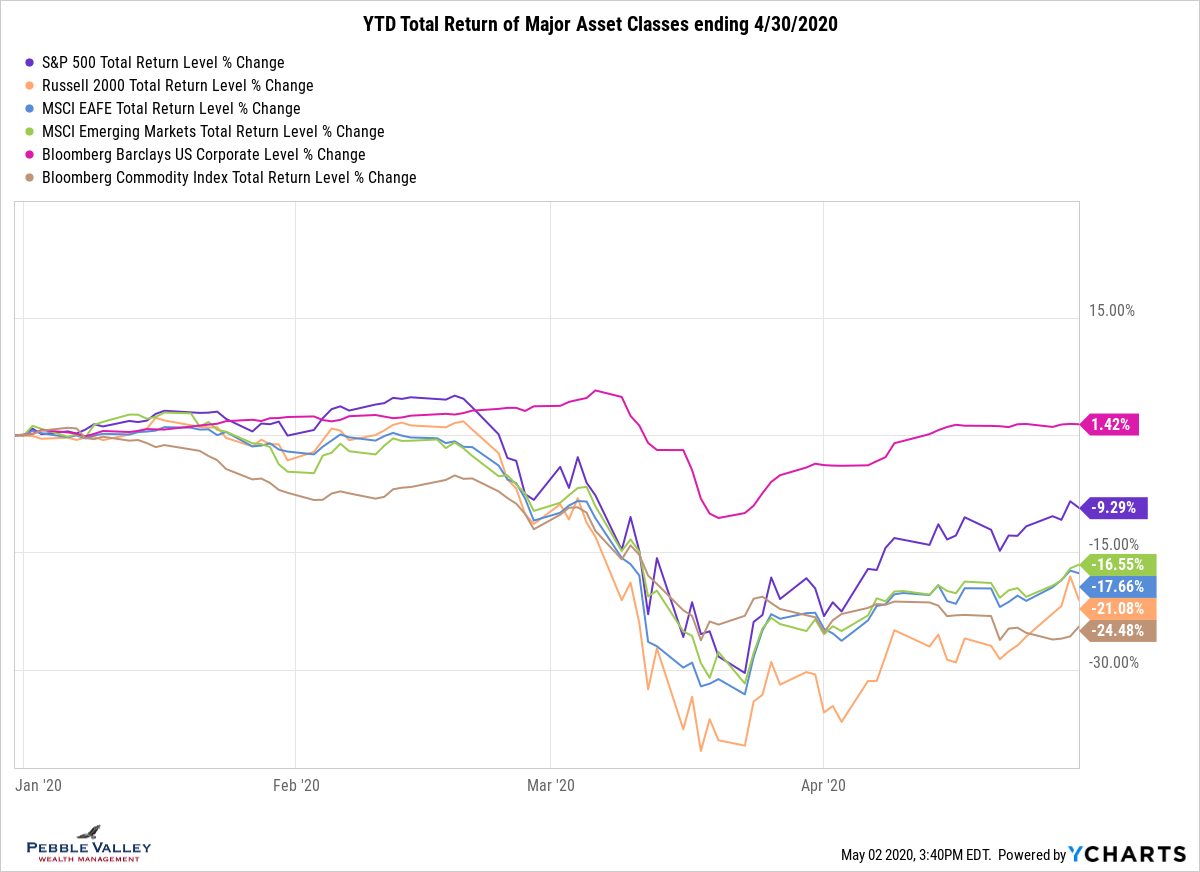
- As always but especially now, given the large and rapid swings focus on charts longer than one month
- Be aware of your large vs. small equity exposure; the ‘size’ factor to smart beta or factor investors
- International equities did not recover as much as US large caps but are holding up better than small caps
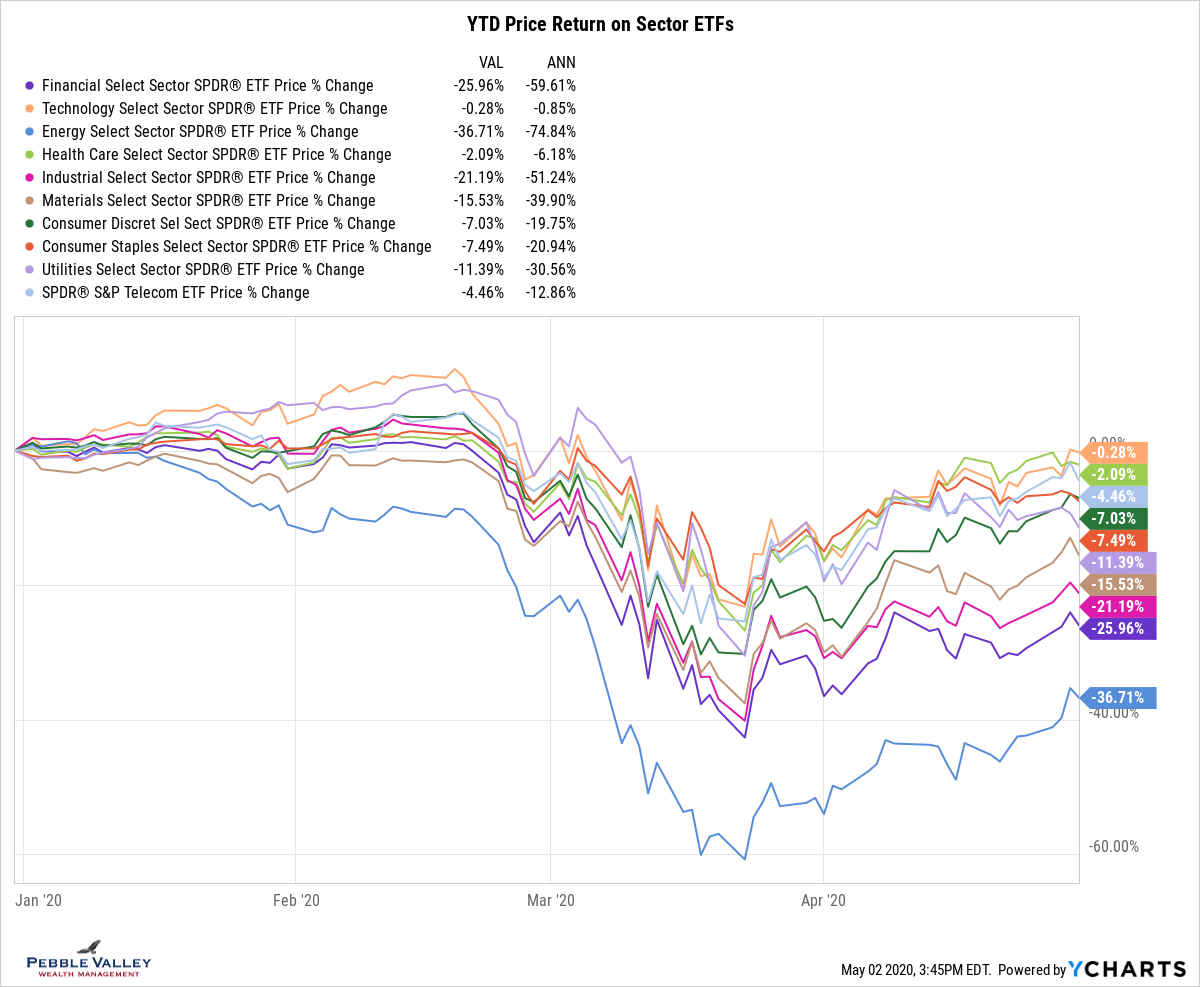
- At the sector level, Energy had a strong recovery (despite the technical dislocation in futures; note these are energy companies, not direct oil investments)
- Still at sectors – Technology is almost back to flat on the year and Financials continue to lag
- US equity volatility actually came down and stayed below 40; above 30 is still a very high level however
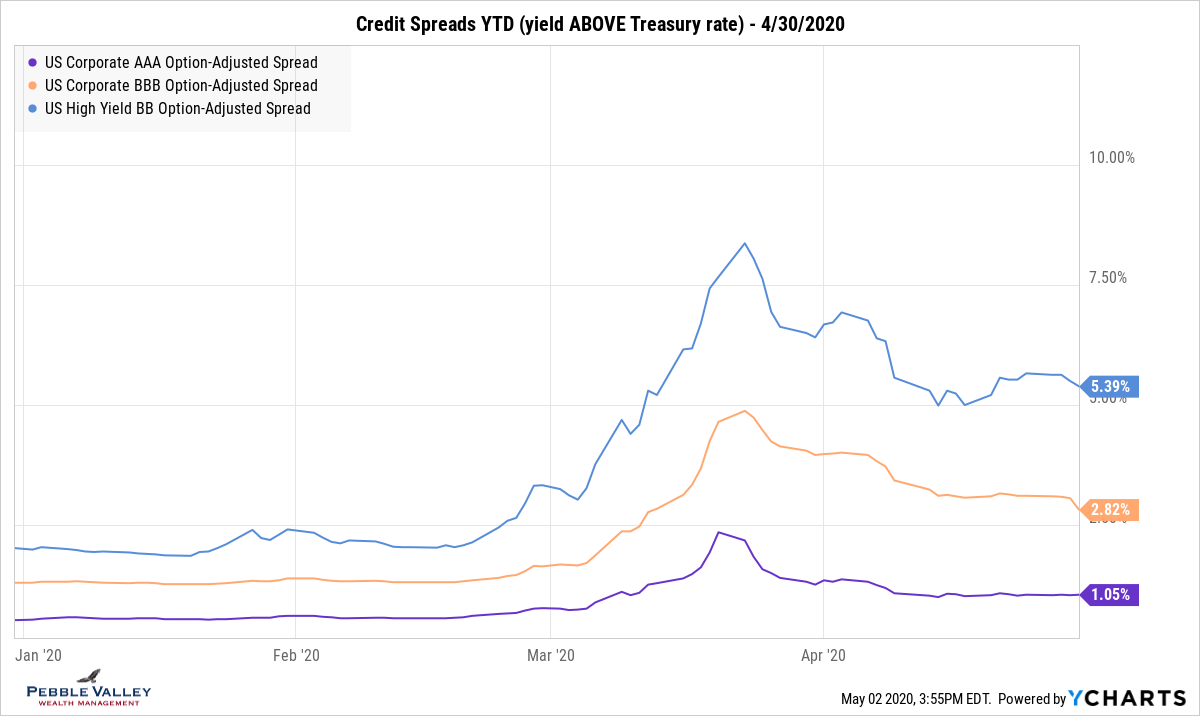
- Credit spreads have fallen (a more favorable view) after the Fed stepped in on various programs to add stability; spreads remain relatively wide however as economic uncertainty remains
- No graph, but notice the muni market did NOT recover in April like corporate bonds; state and local municipal economies are taking hits from both sides – lower tax revenue with less economic activity and higher costs for healthcare and unemployment claims; pension financing will also take a hit with lower rates and market losses
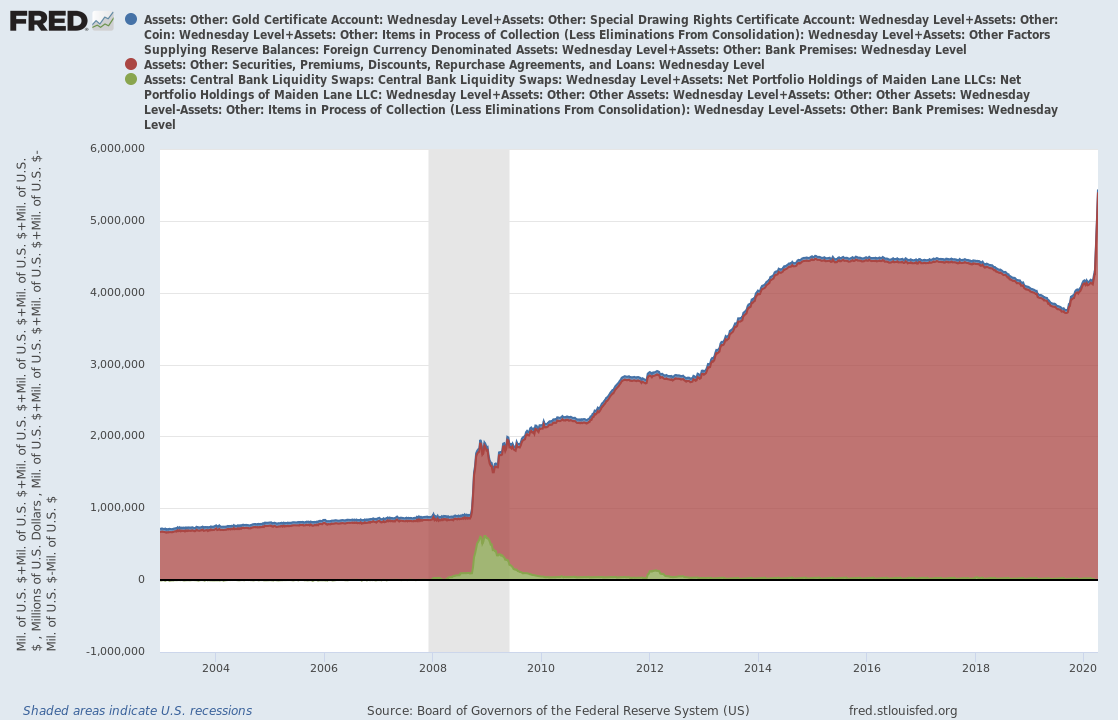
- The FOMC meeting concluded April 29. The issuance of a statement and press conference was not unusual, but the format of each was this time. The statement was completely reworded to summarize the massive efforts the Fed is using to support “smooth market functioning” and providing “large-scale overnight and term repurchase agreement operations.” How big is this getting? See graph below. Reporters asked questions remotely via video conference.
For the college students out there… good luck with finals. You will be back in the fall – demand it!
any headers?
Posted by Kirk, a fee-only financial advisor who looks at your complete financial picture through the lens of a multi-disciplined, credentialed professional. www.pvwealthmgt.com