

Asset Class Returns - 2/29/2024
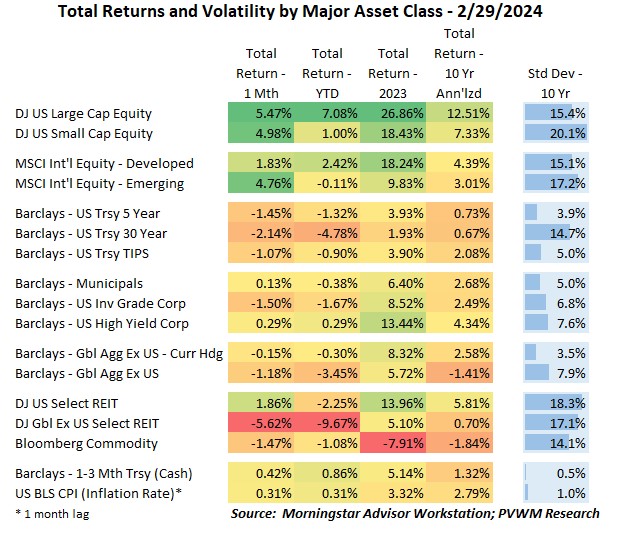
You will see in the table above that equity markets didn’t seem to care the Federal Reserve may not cut rates as much as the market was expecting late last year. Recall there was a very strong rally since late October on the back of an easier Fed. Much of the US Large caps returns continue to be dominated by the tech sector, but even the small caps joined the rally this month. However, part of the small cap run was more of a catch-up trade as the YTD returns continue to lag large caps. International markets also had a solid month, with developed markets up +1.8% while emerging up a very strong +4.8%. The international equities YTD returns are not as favorable as the US, with those markets having a lower tech weighting in their index. US REITs were surprisingly up for the month despite higher interest rates and continued negative sentiment in commercial real estate. The international REITs did not have the same experience, but one could say those returns were more expected given the environment. Most bond asset classes were down for the month on the back of rates being higher by about 0.25%. The exception remains high yield, as tighter credit spreads offset the underlying rate rise.
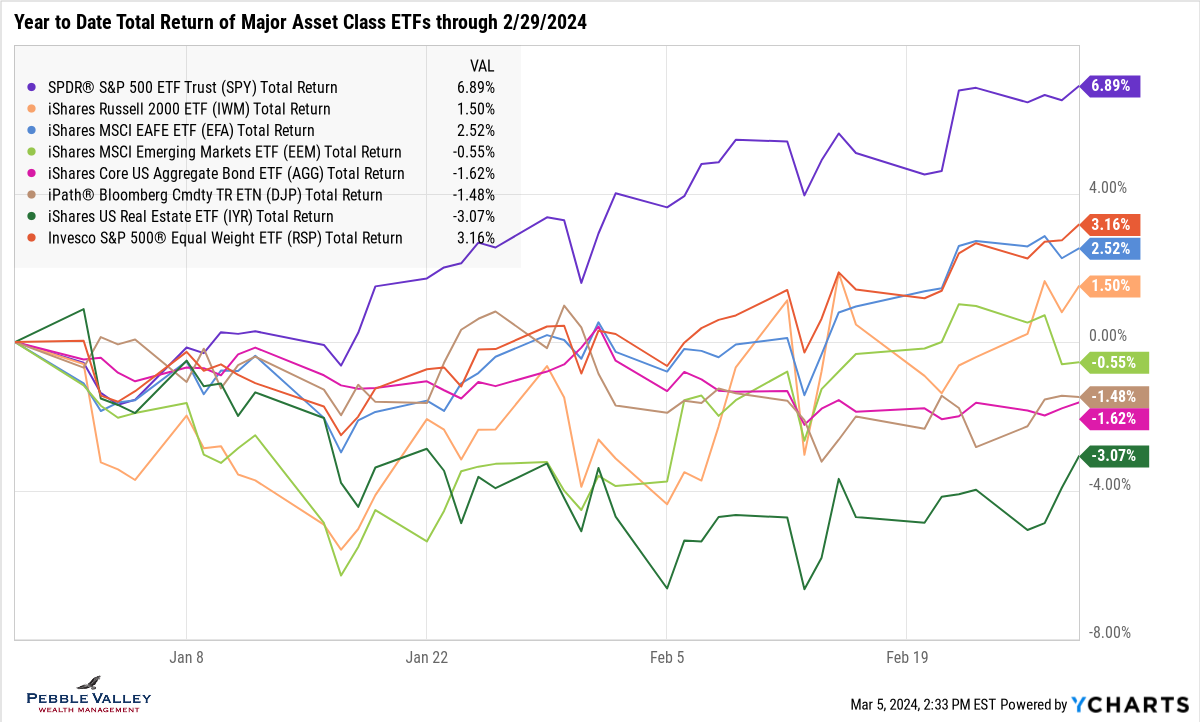
The graph below shows total returns of major asset class ETFs, but I shifted to YTD returns to better capture the current movements. I kept the equal-weighted S&P index ETF (ticker RSP) to capture the dominance of the higher market-cap weighted names in the overall market weighted market (ticker SPY). You can see the US small caps (IWM) are lagging the large caps (SPY) but they recovered nicely after being down about 4% at the end of January. REITs (IYR) have the lowest return on the graph but as mentioned above, you can see they stabilized in February. Bond asset classes, as captured by the aggregate bond index (AGG), continue to slowly bleed lower as rates begin to drift back up following the very strong bond rally (price up, yield down) late last year. That strong bond rally is reversing as inflation continues to run hotter and Fed rate cuts may occur later. See my latest blog post for an update on inflation.
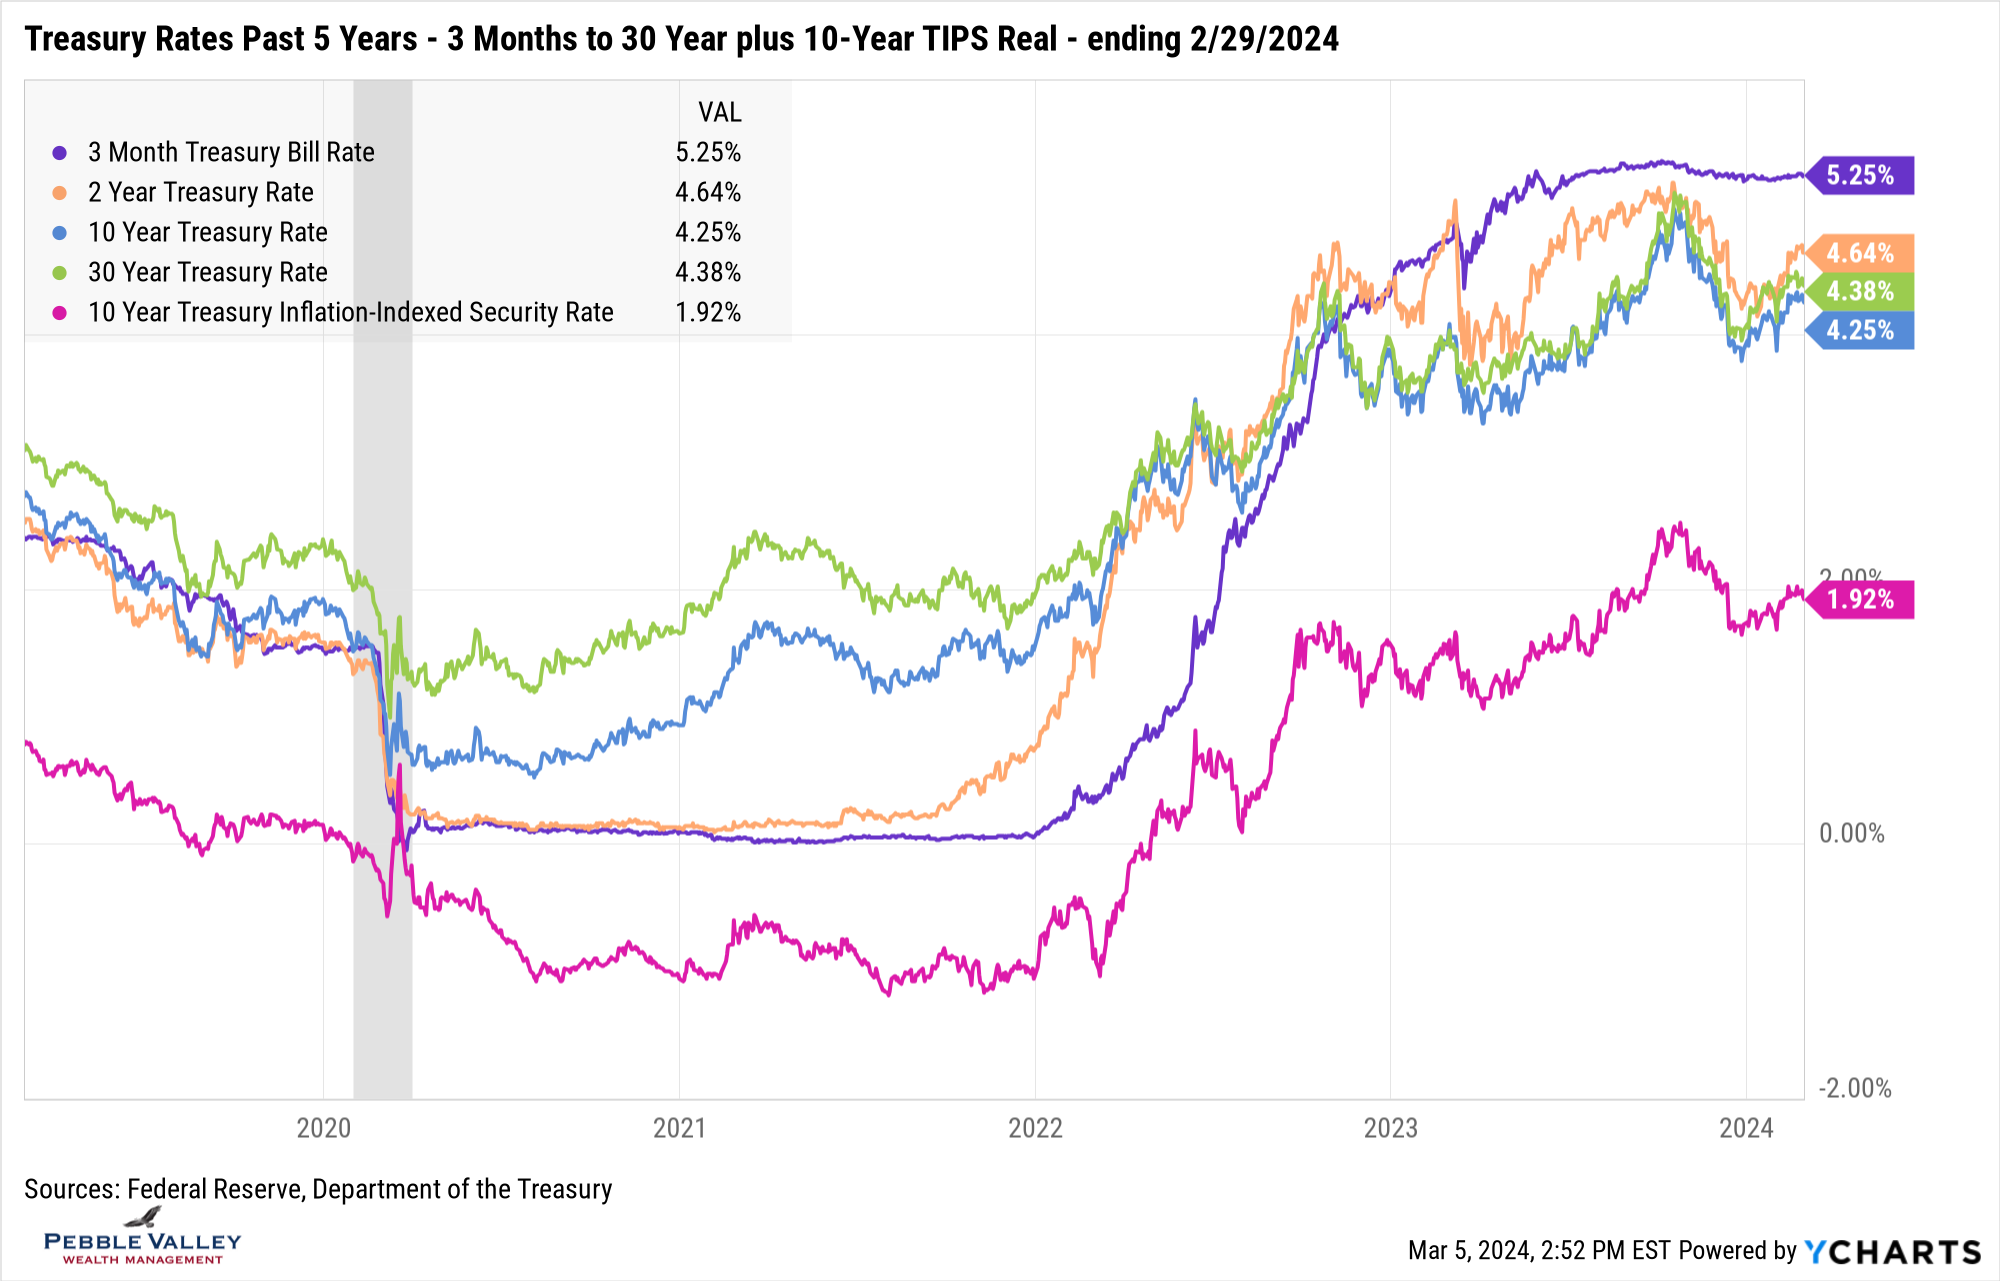
Treasury rates continued their march higher that began in January. The pace quickened mid-month after the release of the hotter than expected inflation reading captured by the CPI. While rate levels haven’t reached the peak of last October, the 2-year is back above 4.5% as the Fed remains on hold and 3-month T-Bills stay elevated for the same reason. The TIPS real yield – fixed coupon receive IN ADDITION to actual inflation – remains at attractive levels in the 2% zip code.
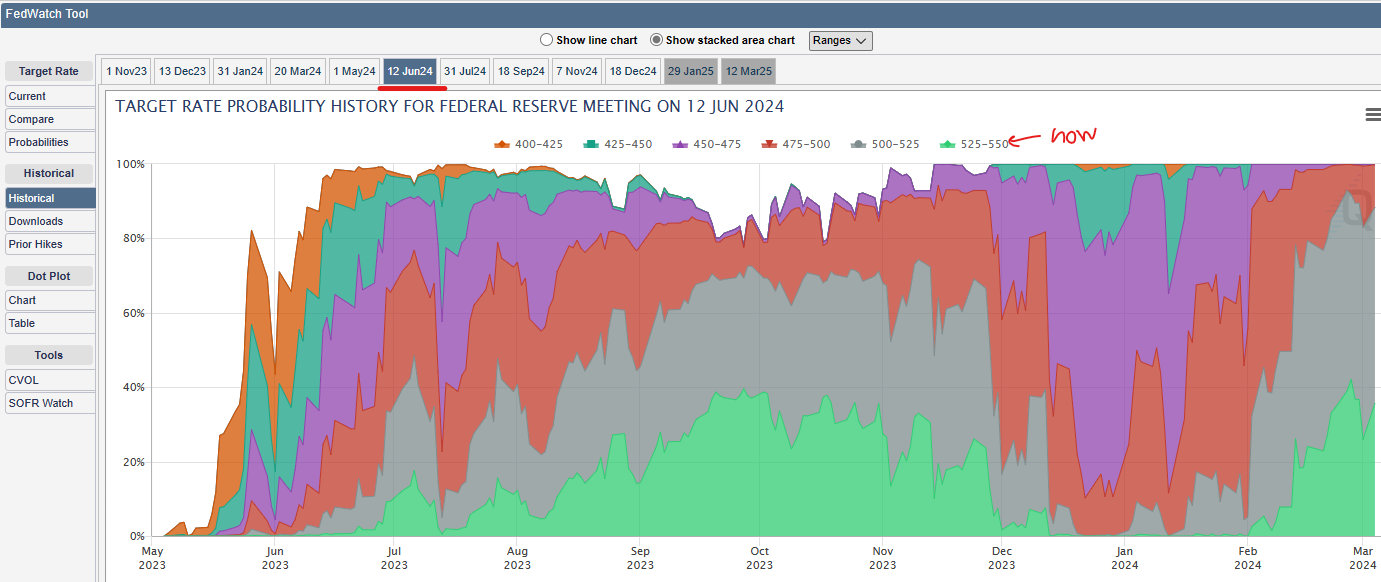
The next FOMC meeting will conclude March 20th. In addition to the Fed’s updated views on inflation after recent hotter readings, this meeting includes an updated Summary of Economic Projections. The metrics in this report not only includes inflation, but also the unemployment rate, real GDP growth and the infamous “dot plot” – where the Fed Reserve members see the Fed Funds rate at the end of next three years. Back in mid-January the market implied about a 75% chance of a rate cut at this meeting, but that has all but been removed. Looking out two more Fed meetings after this one – the June 12th meeting – the market is implying about a 35% chance of no rate cuts but the most likely scenario is one rate cut (see gray shaded area below). We get the next look at the jobs report this coming Friday.
No special topics this month. Use the extra time to get your info to your accountant!
Posted by Kirk, a fee-only financial advisor who looks at your complete financial picture through the lens of a multi-disciplined, credentialed professional. www.pvwealthmgt.com